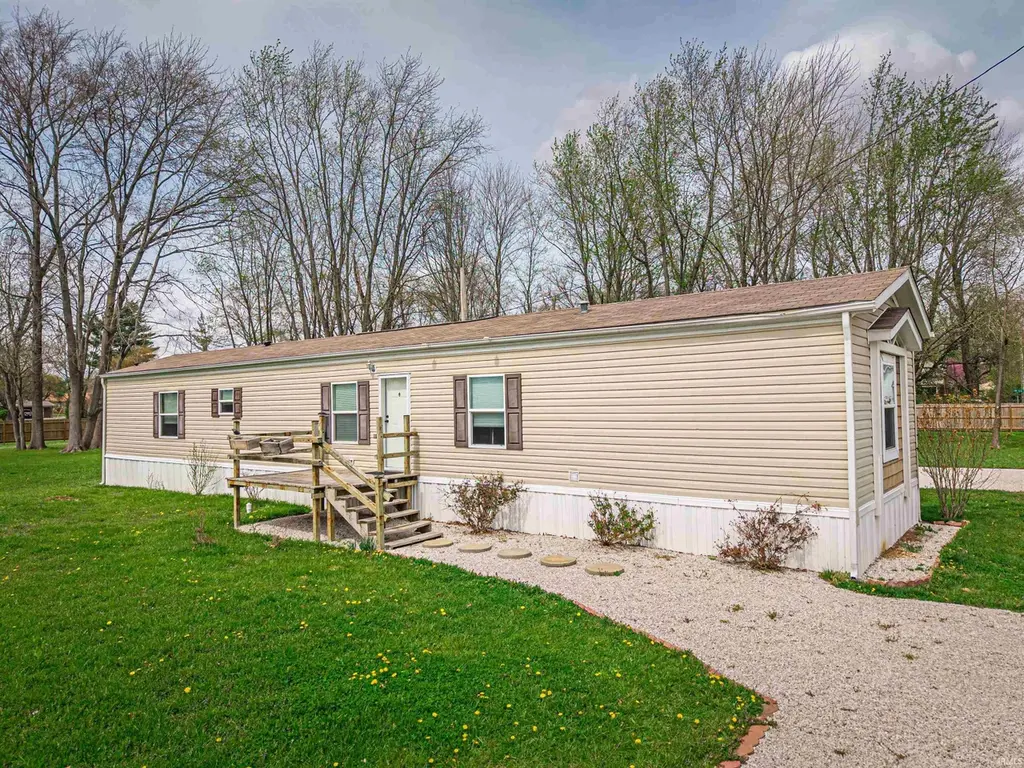
4611 N Alford Locust St · Alford, IN
Flood risk No data
- FEMA flood zone
- —
- Chance of flooding over 30 yrs
- —
- Est. flood insurance / yr
- —
Fire risk No data
- Est. fire insurance / yr
- —
Heat risk No data
- Hot days now (above threshold)
- —
- Hot days in 30 yrs
- —
Wind risk No data
- Chance of severe wind over 30 yrs
- —
Air-quality risk No data
- Unhealthy air days now
- —
- Unhealthy air days in 30 yrs
- —
Risk factors via First Street. Map © Google.
Why this score? — see what drove the D grade
The composite is a weighted blend of 9 inputs, each scored 0–100. Each bar is that input's sub-score; the figure is the points it added to the 100-point composite (weight × sub-score).
- Cash flow +14.7/30.0
- ARV discount +7.5/15.0
- DSCR +4.5/10.0
- 1% rule +4.1/10.0
- Schools +2.9/10.0
- Rent growth +2.5/5.0
- Livability +2.5/5.0
- Condition / age +2.5/5.0
- Appreciation +0.0/10.0
$144,000
🖨 Deal sheet (PDF) 📄 Offer letter ✓ Due diligence
Listing remarks
WOW—check out that yard!! This 3 bed, 2 bath home sits on a HUGE fully fenced lot with mature trees—perfect for pets, play, or backyard entertaining. Inside, you’ll love the open layout with a stylish kitchen, tons of cabinet space, and a cozy living area that feels like home the moment you walk in. The spacious primary suite features a private bath with a double vanity, giving you plenty of room to unwind. As an added bonus, ALL appliances stay—washer, dryer, fridge, dishwasher, range & microwave—so you can move right in!
Key facts
- 0.78 acre lot
- Built 2018
- Listed 11 days
Neighborhood map
What this means for you Summary
Snapshot
- This is a 3-bed/2.0-bath manufactured listed at $144k.
Deal economics
- At list price, monthly cash flow is $36 ($434/yr) — positive.
- The deal already cash-flows at list — no discount required.
- To meet the 1% rule (rent ≥ 1% of price), the offer needs to be $131k (9.3% below list).
- Recommended offer: $131k (9.3% below list) — sets the bar for 1% rule.
Location & tenants
- Location reads: area grade D — affects rentability + tenant quality, not the cash-flow math above.
- Pike County School Corporation (rural): math 29% / reading 39% proficiency, ranked #203 of 301 in IN (top 67%) — families likely to look elsewhere, expect single-tenant / working-renter base with shorter leases.
- Zoned schools: Petersburg Elementary School (math 32% / reading 32%, grade F, #652 of 994 statewide, top 68%, 458 students, 57% FRL); Pike Central Middle School (math 20% / reading 33%, grade F, #236 of 330 statewide, top 72%, 366 students, 49% FRL); Pike Central High School (math 32% / reading 57%, grade F, #169 of 369 statewide, top 51%, 475 students, 44% FRL) — zoned schools average 50% FRL vs 33% district-wide (18 pts higher); higher-poverty schools than district average — tighter screening recommended.
- Market conditions: 28 active listings in the ZIP; 7 units permitted in Pike County in 2024 (0 in 5+ unit buildings).
Forward outlook
- Local home prices are declining (-3.0%/yr); year-one equity from $996 of loan paydown is wiped out by about $4k of value loss. Plan a longer hold.
- Pike County population projected at -20% by 2050 — secular population decline; favor cash flow + early exit over multi-decade hold.
Negotiation context
- Only 11 days on market — expect competitive offers; lowballing is unlikely to land.
Questions for the listing agent
- Is there a deadline driving the sale (1031 exchange, divorce, estate, relocation)? That informs how much negotiation room exists.
- The area grade is low — what's the realistic commute time and amenity access for the typical tenant pool here? Any planned neighborhood developments (good or bad) we should know about?
- What's the average days-on-market for RENTAL listings here right now (not sales)? A rising rental-DOM trend means longer vacancies and softer asking-rent achievability than the comps imply.
- What's the recent tenant-quality profile in this submarket — average credit score on applications, eviction rate, late-payment / NSF rate, and stable-employment percentage? A property-management company in the area should have these aggregated.
- How much new for-sale + rental construction is in the pipeline within 1–3 miles? Heavy new supply typically softens prices + rents 12–24 months out; constrained supply supports both.
Investment metrics
- 1% rule
- 0.91% ✗
- Cap rate
- 6.59%
- Cash-on-cash
- 1.08%
- DSCR
- 1.05
- GRM
- 9.2
CMA / ARV
No comps found within radius.
Projected returns pro-forma
-3.0% appreciation · 3.0% rent growth · sell at horizon
- IRR
- -14.6%
- Equity multiple
- 0.48×
- Total profit
- $-21,012
- Equity at exit
- $21,471
- IRR
- -5.8%
- Equity multiple
- 0.62×
- Total profit
- $-15,253
- Equity at exit
- $12,450
Cash invested: $40,320 (down + closing). Projections, not guarantees.
Landlord ↔ Tenant lean methodology
- Overall (STATE)
- 90 Strongly Landlord-Friendly
- State Indiana
- 90 Strongly Landlord-Friendly · R+11
- County
- — inherits STATE
- City
- — inherits STATE
ZIP-level market 47567
- Home prices YoY
- -5.7%
- Active inventory
- 28
- Price-to-rent
- 9.2×
Monthly cashflow live
- Estimated rent
- $1,305 medium interval (Pro) →
- Mortgage (P&I)
- −$755
- Tax est. 1.5%
- −$180 /mo · $2,160/yr
- Insurance
- −$60
- HOA
- −$0
- Vacancy / Maint / Mgmt
- −$274
- Net cashflow
- $36
Break-even live
Sensitivity live
| Price | -10% $136 | -5% $86 | +0% $36 | +5% $-14 | +10% $-63 |
|---|---|---|---|---|---|
| Rent | -10% $-67 | -5% $-15 | +0% $36 | +5% $88 | +10% $139 |
| Rate | -1.0pp $109 | -0.5pp $73 | base $36 | +0.5pp $-1 | +1.0pp $-39 |
UW: 25.0% down · 7.5% · 30yr · 1.5% tax · 5.0% vac · 8.0% maint · 8.0% mgmt
Financing live
Cash to close
- Down payment
- $36,000
- Closing costs
- $4,320
- Reserves months
- —
- Total cash needed
- —
Loan-product check · same deal, 3 products live
Conventional
25% down · 7.5% · 30yr
- Down + closing
- —
- Monthly P&I
- —
- Monthly cashflow
- —
- DSCR
- —
- Eligible?
- —
Personal DTI + credit; lowest rate.
DSCR
20% down · 8.5% · 30yr
- Down + closing
- —
- Monthly P&I
- —
- Monthly cashflow
- —
- DSCR
- —
- Eligible?
- —
No personal income docs; deal must DSCR.
Hard money
10% down · 12.0% · 12mo
- Down + closing
- —
- Monthly P&I
- —
- Monthly cashflow
- —
- DSCR
- —
- Eligible?
- —
Short-term bridge; refi at stabilization.
Listing history 2 events
-
2026-04-20status Pending
-
2026-04-08$144,000 Active
ⓘ Source: listings_history table (triggers on properties + properties_extension) + one-shot
backfill from property_details.listing_events for pre-trigger history.
Nearby sold comps map
Loading sold comps map…
Walkable amenities ~0.75 mi
Loading nearby amenities…
Taxation est. · year 1
- Rental income
- $15,665
- − Mortgage interest
- −$8,066
- − Property taxes
- −$2,160
- − Insurance
- −$720
- − Repairs & maintenance
- −$1,253
- − Management
- −$1,253
- − Depreciation
- −$4,189
- Taxable loss
- −$1,976
- Est. tax savings @ 24.0%
- +$474
- After-tax cash flow
- $908/yr
For passive investors: Depreciation is non-cash, so a rental often shows a tax loss while cash-flowing — sheltering income. Rental losses are passive: they offset passive income freely, and up to $25,000/yr can offset ordinary (W-2) income if you actively participate and your MAGI is under $100k (phasing out to $0 by $150k); unused losses carry forward. On sale, claimed depreciation is recaptured at up to 25%, and gains may owe capital-gains tax (a 1031 exchange can defer both). Figures are a year-1 estimate at your 24.0% rate — not tax advice; consult a CPA.
Schools (NCES district)
- District
- Pike County School Corporation
- NCES district ID
- 1808900
- Math proficiency
- 29% ▼ -6.00%
- Reading proficiency
- 39% ▼ -2.00%
- Median HH income
- $43,646
- Composite
- 28.88/100
- National rank
- #6642
- State rank
- #203 of 301 in IN
Livability — Alford
No livability data for this city. (Only ~50 U.S. cities are tracked.)
Census & demographics
- Census place
- Alford, IN
- Population (ZIP)
- 6,187
Population outlook (Pike County) Hauer SSP2
- Today (2025)
- 11,816 people
- By 2030
- 11,348 · -4.0%
- By 2040
- 10,351 · -12.4%
- By 2050
- 9,410 · -20.4%
- By 2075
- 7,638 · -35.4%
- By 2100
- 6,118 · -48.2%
Race, ethnicity, and origin ACS 2023
- Neighborhood character
- Predominantly White (96%)
- Race & ethnicity
- White 96% Native American 2% Two or more races 1%
- Common ancestry
- Slovak 3% Portuguese 2% Serbian 1%
- Foreign-born
- 1% · Canada
Political lean MEDSL · Pike
- 2024 margin
- Solid R (+54.9) · D 21.9% · R 76.7% · Other 1.4%
- 2008→2024 swing
- -46.2pp toward R · 2008: -8.6pp · 2024: -54.9pp
- All cycles
- 2024: R+54.9 2020: R+52.7 2016: R+51.9 2012: R+25.4 2008: R+8.6
Not yet ingested
- Civics
- —
Market trends
- HPI YoY
- ▼ -12.97%
- Current HPI
- 216.028
- Rent YoY
- —
- Metro
- —
- State GDP YoY
- ▲ 2.90%
- F500 in state
- 18
Industry mix (Fortune 500 HQ in IN)
| Industry | F500 HQs | Revenue |
|---|---|---|
| Industrial Machinery | 2 | $37B |
|
||
| Healthcare | 1 | $177B |
|
||
| Pharmaceuticals | 1 | $45B |
|
||
| Metals / Steel | 1 | $18B |
|
||
| Agriculture | 1 | $17B |
|
||
| Packaging | 1 | $12B |
|
||
Price history
2 events — show timeline
- 2026-04-20 Pending — IRMLS
- 2026-04-08 Listed $144,000 IRMLS
Property tax history
-7.6%/yrLatest (2024): $18 · +2.4% YoY. Source: county tax records.
Cash-flow waterfall
monthlySold comps — $/sqft
last 12 mo · ≤1 miLoading sold comps…