2300 Smith Rd · Haines City, FL
Flood risk 1/10 · Minimal
- FEMA flood zone
- X (unshaded)
- Chance of flooding over 30 yrs
- 0.0%
- Est. flood insurance / yr
- $507 – $1,088
Fire risk 5/10 · Moderate
- Est. fire insurance / yr
- $947 – $1,759
Heat risk 8/10 · Major
- Hot days now (above 108°F)
- 7 days/yr
- Hot days in 30 yrs
- 23 days/yr
Wind risk 9/10 · Severe
- Chance of severe wind over 30 yrs
- 99.0%
Air-quality risk 2/10 · Minimal
- Unhealthy air days now
- 0 days/yr
- Unhealthy air days in 30 yrs
- 1 days/yr
Risk factors via First Street. Map © Google.
Why this score? — see what drove the D grade
The composite is a weighted blend of 9 inputs, each scored 0–100. Each bar is that input's sub-score; the figure is the points it added to the 100-point composite (weight × sub-score).
- Cash flow +14.8/30.0
- ARV discount +7.5/15.0
- DSCR +4.5/10.0
- Livability +3.7/5.0
- Schools +3.5/10.0
- 1% rule +3.2/10.0
- Rent growth +2.8/5.0
- Condition / age +2.5/5.0
- Appreciation +0.0/10.0
$200,000
🖨 Deal sheet (PDF) 📄 Offer letter ✓ Due diligence
Listing remarks
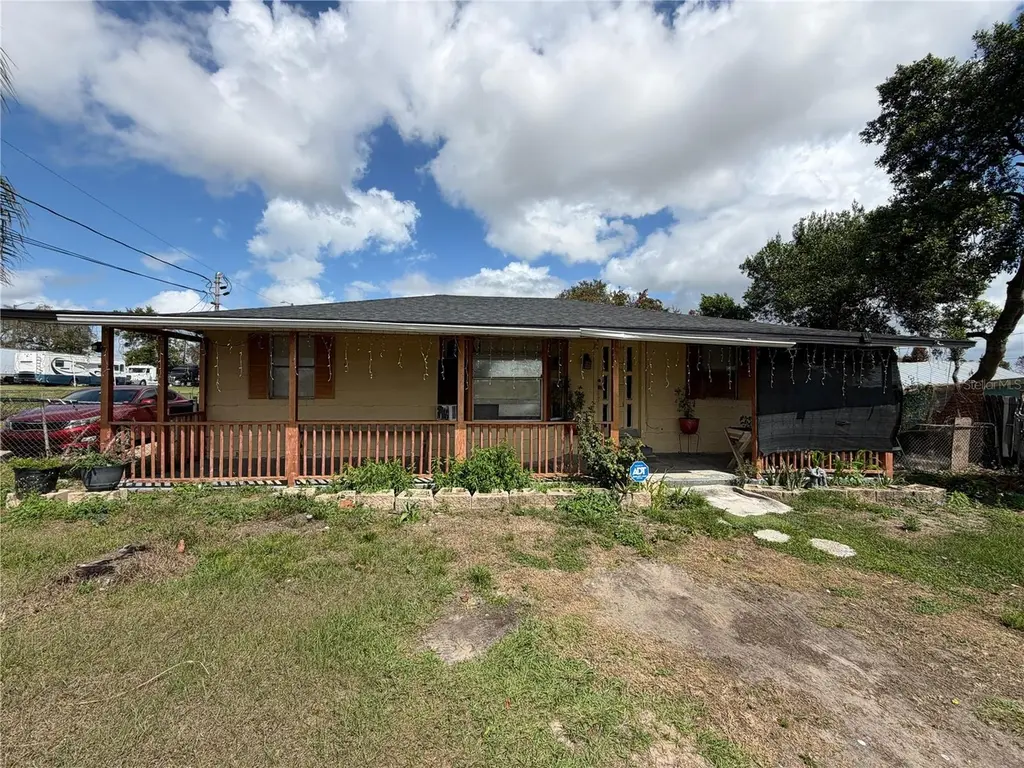
Don’t miss this opportunity to own a 3-bedroom, 1-bath home situated on a generous 0.26-acre lot in the growing area of Haines City. Offering 916 sq ft under air and 1,264 total sq ft, this property combines functionality, outdoor space, and future potential. The home features a covered front porch and a spacious yard with ample room for parking, recreation, or expansion. Recent and ongoing improvements are being completed, making this a great opportunity for buyers looking for a move-in ready home with added value. The oversized lot provides flexibility rarely found at this price point—ideal for storing work vehicles, boats, or creating your own outdoor oasis. Conveniently loca
Key facts
- Covered front porch
- Spacious yard
- Oversized lot
Tags
Property features AI
Finance
- Other: Property type: Residential, single family; Zoning: R-3; Lot size approximately 0.26 acres (about 1/4 to less than 1/2 acre)
- HOA & community: No HOA association indicated
Exterior
- Utilities: Public water; Public sewer; Electricity connected; Water connected
- Home design: Single family residence; One story; Faces northwest
- Construction: Wood siding; Shingle roof; Crawlspace foundation; Built with approximately 1,264 total building area
- Exterior features: Private mailbox; Asphalt road frontage
Interior
- Kitchen: Range; Refrigerator
- Bedrooms: 3 bedrooms
- Flooring: Laminate
- Bathrooms: 1 full bathroom
- Heating & cooling: Central heating (electric); Central air conditioning
- Interior features: Ceiling fans; Skylights
- Laundry & utility: Laundry room; Washer; Dryer; Electric water heater
Neighborhood map
What this means for you Summary
Snapshot
- This is a 3-bed/1.0-bath single-family listed at $200k.
Deal economics
- At list price, monthly cash flow is $56 ($675/yr) — positive.
- The deal already cash-flows at list — no discount required.
- To meet the 1% rule (rent ≥ 1% of price), the offer needs to be $164k (17.8% below list).
- Recommended offer: $164k (17.8% below list) — sets the bar for 1% rule.
Location & tenants
- Location reads 74/100 on livability (#285 in FL, #4,575 nationally) — a middle-class / working-renter tenant base. Strengths: crime A+, cost of living A+, housing A+; Watch: amenities F, commute F, employment F.
- Polk (suburban): math 39% / reading 43% proficiency, ranked #62 of 73 in FL (top 85%) — families likely to look elsewhere, expect single-tenant / working-renter base with shorter leases.
- Zoned schools: Eastside Elementary School (math 33% / reading 29%, grade F, #1,854 of 2,144 statewide, top 87%, 615 students, 66% FRL); Shelley S. Boone Middle School (math 25% / reading 25%, grade F, #517 of 571 statewide, top 91%, 1,403 students, 52% FRL); Ridge Community High School (math 12% / reading 33%, grade F, #539 of 667 statewide, top 81%, 2,711 students, 48% FRL) — zoned schools at 55% FRL track the district average.
- Zoned-school proficiency averages 26% at this address vs 41% district-wide (-15 pts) — the specific schools serving this property underperform the Polk average; the district grade overstates school quality for this exact location.
- Market conditions: Rents rising (+1.2%/yr); 1344 active listings in the ZIP; 5 comparable units currently listed for rent nearby; rentals at typical pace (median 16d on market — plan ~3-4 weeks tenant-placement turnaround); 10,384 units permitted in Polk County in 2024 (1,716 in 5+ unit buildings).
- This rent runs 31% of the median local income ($64k/yr) — at the standard rent-burdened threshold; future hikes will face affordability resistance.
Forward outlook
- Local home prices are declining (-3.0%/yr); year-one equity from $1k of loan paydown is wiped out by about $6k of value loss. Plan a longer hold.
- Polk County population projected at +33% by 2050 — long-run rental-demand tailwind backs the buy-and-hold thesis.
Negotiation context
- It's been on market 88 days — a 6% lower offer ($188k) is reasonable based on typical stale-listing flexibility.
- 2 sale attempts since 14y ago with the ask held roughly flat each time — persistent listings suggest the price (not the market) is what's stuck; bring a comps-based counter.
Risks & watch-outs
- Climate carrying-cost: severe wind risk, 99% chance of damaging wind over 30y; moderate wildfire risk; extreme-heat days projected 7→23/yr by 2055 (HVAC capex compounding) — expect insurance premiums to compound above CPI over the hold.
Questions for the listing agent
- It's been on market 88 days. Have you received any prior offers? Is the seller open to a 18% concession, seller financing, or rate buy-down credit?
- Built in 1969 — when were the roof, HVAC, electrical panel, plumbing, and water heater last replaced?
- Why hasn't it sold? Are there any deal-killer items the seller is aware of (foundation, flood, title, zoning, code violations)?
- Is there a deadline driving the sale (1031 exchange, divorce, estate, relocation)? That informs how much negotiation room exists.
- Schools are D-rated, which usually means shorter tenancies and higher turnover. Who's the typical renter profile here, and what's been the actual vacancy rate?
- The area grade is low — what's the realistic commute time and amenity access for the typical tenant pool here? Any planned neighborhood developments (good or bad) we should know about?
- What's the average days-on-market for RENTAL listings here right now (not sales)? A rising rental-DOM trend means longer vacancies and softer asking-rent achievability than the comps imply.
- What's the recent tenant-quality profile in this submarket — average credit score on applications, eviction rate, late-payment / NSF rate, and stable-employment percentage? A property-management company in the area should have these aggregated.
- How much new for-sale + rental construction is in the pipeline within 1–3 miles? Heavy new supply typically softens prices + rents 12–24 months out; constrained supply supports both.
Investment metrics
- 1% rule
- 0.82% ✗
- Cap rate
- 6.63%
- Cash-on-cash
- 1.21%
- DSCR
- 1.05
- GRM
- 10.1
CMA / ARV
No comps found within radius.
Projected returns pro-forma
-3.0% appreciation · 1.16% rent growth · sell at horizon
- IRR
- -16.3%
- Equity multiple
- 0.43×
- Total profit
- $-31,876
- Equity at exit
- $29,821
- IRR
- -11.3%
- Equity multiple
- 0.37×
- Total profit
- $-35,214
- Equity at exit
- $17,292
Cash invested: $56,000 (down + closing). Projections, not guarantees.
Landlord ↔ Tenant lean methodology
- Overall (STATE)
- 87 Strongly Landlord-Friendly
- State Florida
- 87 Strongly Landlord-Friendly · R+3
- County
- — inherits STATE
- City
- — inherits STATE
ZIP-level market 33844
- Home prices YoY
- -26.7%
- Rents YoY
- 1.2%
- Active inventory
- 1344
- Price-to-rent
- 10.1×
Monthly cashflow live
- Estimated rent
- $1,645 medium interval (Pro) →
- Mortgage (P&I)
- −$1,049
- Tax from tax record
- −$111 /mo · $1,332/yr
- Insurance
- −$83
- HOA
- −$0
- Vacancy / Maint / Mgmt
- −$345
- Net cashflow
- $56
Break-even live
Sensitivity live
| Price | -10% $169 | -5% $113 | +0% $56 | +5% $0 | +10% $-57 |
|---|---|---|---|---|---|
| Rent | -10% $-74 | -5% $-9 | +0% $56 | +5% $121 | +10% $186 |
| Rate | -1.0pp $157 | -0.5pp $107 | base $56 | +0.5pp $4 | +1.0pp $-48 |
UW: 25.0% down · 7.5% · 30yr · 1.5% tax · 5.0% vac · 8.0% maint · 8.0% mgmt
Financing live
Cash to close
- Down payment
- $50,000
- Closing costs
- $6,000
- Reserves months
- —
- Total cash needed
- —
Loan-product check · same deal, 3 products live
Conventional
25% down · 7.5% · 30yr
- Down + closing
- —
- Monthly P&I
- —
- Monthly cashflow
- —
- DSCR
- —
- Eligible?
- —
Personal DTI + credit; lowest rate.
DSCR
20% down · 8.5% · 30yr
- Down + closing
- —
- Monthly P&I
- —
- Monthly cashflow
- —
- DSCR
- —
- Eligible?
- —
No personal income docs; deal must DSCR.
Hard money
10% down · 12.0% · 12mo
- Down + closing
- —
- Monthly P&I
- —
- Monthly cashflow
- —
- DSCR
- —
- Eligible?
- —
Short-term bridge; refi at stabilization.
Rent comps 5 comps
| Address | Beds | Baths | Sqft | Rent | $/sqft | DOM | Units | Dist |
|---|---|---|---|---|---|---|---|---|
| 2109 N 13th St Haines City, FL | 2.0 | 1.0 | 772 | $1,300 | $1.68 | 25d | 1 | 0.42mi |
| 1205 Avenue I Unit I Haines City, FL | 3.0 | 1.0 | 836 | $1,340 | $1.60 | 16d | 1 | 0.62mi |
| 2896 Kokomo Loop Unit 1259817P Haines City, FL | 3.0 | 2.0 | 1119 | $6,692 | $5.98 | 21d | 1 | 0.92mi |
| 608 Claude Holmes SR Ave Haines City, FL | 2.0 | 1.0 | 748 | $1,350 | $1.80 | 5d | 1 | 1.30mi |
| 325 N 5th St Unit 325-5 Haines City, FL | 2.0 | 1.0 | 750 | $945 | $1.26 | 16d | 1 | 1.44mi |
Listing history 18 events
-
2026-06-22days on market $200,000 Active 88 DOM
-
2026-06-18days on market $200,000 Active 85 DOM
-
2026-06-17days on market $200,000 Active 84 DOM
-
2026-06-16days on market $200,000 Active 83 DOM
-
2026-06-15days on market $200,000 Active 82 DOM
-
2026-06-13days on market $200,000 Active 80 DOM
-
2026-06-10days on market $200,000 Active 77 DOM
-
2026-06-09days on market $200,000 Active 76 DOM
-
2026-06-08days on market $200,000 Active 75 DOM
-
2026-06-07days on market $200,000 Active 74 DOM
-
2026-06-05days on market $200,000 Active 71 DOM
-
2026-06-03days on market $200,000 Active 70 DOM
-
2026-06-03days on market $200,000 Active 69 DOM
-
2026-06-01days on market $200,000 Active 68 DOM
-
2026-05-31days on market $200,000 Active 67 DOM
-
2026-03-25$200,000 Active
-
2013-10-08historical
-
2012-05-23$50,000
ⓘ Source: listings_history table (triggers on properties + properties_extension) + one-shot
backfill from property_details.listing_events for pre-trigger history.
Tax reassessment forecast FL · Resets to sale price
- Current annual tax
- $1,332 · $111/mo
- Projected year-2 tax
- $1,660 · $138/mo
- Expected delta
- +$328/yr (+$27/mo · 24.6%)
ⓘ Screening estimate from a state-policy table — verify with the county assessor before closing.
Climate risk First Street
- Flood 1/10 Low FEMA zone X (unshaded) · 0% chance over 30 yrs
- Wildfire 5/10 Major
- Heat 8/10 Severe 7 d/yr ≥108°F today · 23 d/yr by 30 yrs out
- Wind 9/10 Extreme 99% chance of damaging wind over 30 yrs
- Air quality 2/10 Low 0 unhealthy d/yr today · 1 by 30 yrs out
Nearby sold comps map
Loading sold comps map…
Walkable amenities ~0.75 mi
Loading nearby amenities…
Taxation est. · year 1
- Rental income
- $19,738
- − Mortgage interest
- −$11,203
- − Property taxes
- −$1,332
- − Insurance
- −$1,000
- − Repairs & maintenance
- −$1,579
- − Management
- −$1,579
- − Depreciation
- −$5,818
- Taxable loss
- −$2,773
- Est. tax savings @ 24.0%
- +$666
- After-tax cash flow
- $1,341/yr
For passive investors: Depreciation is non-cash, so a rental often shows a tax loss while cash-flowing — sheltering income. Rental losses are passive: they offset passive income freely, and up to $25,000/yr can offset ordinary (W-2) income if you actively participate and your MAGI is under $100k (phasing out to $0 by $150k); unused losses carry forward. On sale, claimed depreciation is recaptured at up to 25%, and gains may owe capital-gains tax (a 1031 exchange can defer both). Figures are a year-1 estimate at your 24.0% rate — not tax advice; consult a CPA.
Schools (NCES district)
- District
- Polk
- NCES district ID
- 1201590
- Math proficiency
- 39% ▼ -11.00%
- Reading proficiency
- 43% ▼ -4.00%
- Median HH income
- $43,979
- Composite
- 34.74/100
- National rank
- #5132
- State rank
- #62 of 73 in FL
Livability — Haines City
- Score
- 74/100
- State rank
- #285
- US rank
- #4575
Category grades
Schools grade is shown separately in the Schools card above.
Census & demographics
- County
- Polk County · 740,051 people
- City population
- 51,255
- Metro
- Lakeland-Winter Haven, FL
- Population (ZIP)
- 51,255
- Household income
- $63,650
- Rent vs Own
- Severe rent burden
- 1107.0
Population outlook (Polk County) Hauer SSP2
- Today (2025)
- 752,975 people
- By 2030
- 804,621 · +6.9%
- By 2040
- 906,117 · +20.3%
- By 2050
- 1,000,476 · +32.9%
- By 2075
- 1,197,520 · +59.0%
- By 2100
- 1,271,518 · +68.9%
Race, ethnicity, and origin ACS 2023
- Neighborhood character
- Diverse neighborhood (Simpson 0.64)
- Race & ethnicity
- Hispanic / Latino 48% White 31% Black 18% Two or more races 12% Asian 1%
- Hispanic origin (detail)
- Mexican 19% Puerto Rican 19% Cuban 1% Dominican 3%
- Common ancestry
- Hispanic 4% Lithuanian 1% Romanian 1%
- Foreign-born
- 15% · Canada, Jamaica, Guatemala
- Languages at home
- 55% English-only · Spanish 39% French/Haitian/Cajun 4% Other Indo-European 0%
Political lean MEDSL · Polk
- 2024 margin
- Strong R (+20.7) · D 39.2% · R 59.9%
- 2008→2024 swing
- -14.6pp toward R · 2008: -6.1pp · 2024: -20.7pp
- All cycles
- 2024: R+20.7 2020: R+14.4 2016: R+14.1 2012: R+6.8 2008: R+6.1
Not yet ingested
- Civics
- —
Market trends
- HPI YoY
- ▼ -105.94%
- Current HPI
- 291.0798
- Rent YoY
- ▲ 1.16%
- Metro
- Lakeland-Winter Haven, FL
- State GDP YoY
- ▲ 3.28%
- F500 in state
- 36
Industry mix (Fortune 500 HQ in FL)
| Industry | F500 HQs | Revenue |
|---|---|---|
| Industrial Technology | 2 | $29B |
|
||
| Insurance | 2 | $17B |
|
||
| Retail | 1 | $60B |
|
||
| Technology Distribution | 1 | $58B |
|
||
| Homebuilding | 1 | $35B |
|
||
| Technology Manufacturing | 1 | $35B |
|
||
Price history
+300.0% since first listed3 events — show timeline
- 2026-03-25 Listed $200,000 Stellar MLS as Distributed by MLS Grid
- 2013-10-08 Listing Removed — Stellar MLS as Distributed by MLS Grid
- 2012-05-23 Listed $50,000 Stellar MLS as Distributed by MLS Grid
Property tax history
+12.6%/yrLatest (2025): $1,332 · +11.8% YoY. Source: county tax records.
Cash-flow waterfall
monthlySold comps — $/sqft
last 12 mo · ≤1 miLoading sold comps…