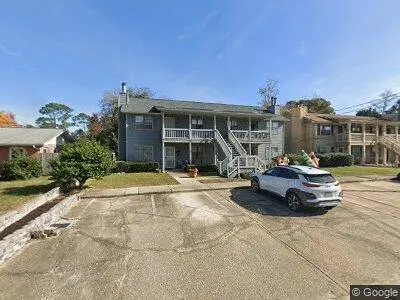
1148 Redwood Ln · Midway, FL
Flood risk 7/10 · Major
- FEMA flood zone
- X (shaded)
- Chance of flooding over 30 yrs
- 0.75%
- Est. flood insurance / yr
- $507 – $1,088
Fire risk 1/10 · Minimal
- Est. fire insurance / yr
- $947 – $1,759
Heat risk 10/10 · Severe
- Hot days now (above 105°F)
- 7 days/yr
- Hot days in 30 yrs
- 23 days/yr
Wind risk 9/10 · Severe
- Chance of severe wind over 30 yrs
- 99.0%
Air-quality risk 2/10 · Minimal
- Unhealthy air days now
- 1 days/yr
- Unhealthy air days in 30 yrs
- 1 days/yr
Risk factors via First Street. Map © Google.
Why this score? — see what drove the D grade
The composite is a weighted blend of 9 inputs, each scored 0–100. Each bar is that input's sub-score; the figure is the points it added to the 100-point composite (weight × sub-score).
- Cash flow +13.1/30.0
- ARV discount +7.5/15.0
- Schools +5.3/10.0
- DSCR +3.9/10.0
- Condition / age +3.8/5.0
- 1% rule +3.7/10.0
- Rent growth +3.7/5.0
- Livability +2.5/5.0
- Appreciation +0.0/10.0
$185,000
🖨 Deal sheet (PDF) 📄 Offer letter ✓ Due diligence
Listing remarks
Downstairs unit in small condo. No carpet, tile and wood laminate flooring. Recently updated kitchen, stainless appliances, granite counters and wood cabinets. Laundry and storage off screened porch. Ceiling fans in both bedrooms.
Key facts
- Laundry and storage
- Stainless appliances
- Ceiling fans
Tags
Neighborhood map
What this means for you Summary
Snapshot
- This is a 2-bed/1.0-bath other listed at $185k. Condition is rated good.
Deal economics
- At list price, monthly cash flow is $-72 ($-862/yr) — negative.
- To cash-flow at today's rent, offer at most $175k (5.6% below list).
- To meet the 1% rule (rent ≥ 1% of price), the offer needs to be $161k (12.9% below list).
- Recommended offer: $161k (12.9% below list) — sets the bar for 1% rule.
- Cap rate 6.3% vs local median 4.1% in Midway — top-decile yield for the area; either an underpriced asset or a hidden risk that comps aren't pricing in. Stress-test before assuming the spread holds.
Location & tenants
- Location reads: area grade D — affects rentability + tenant quality, not the cash-flow math above.
- Santa Rosa (suburban): math 63% / reading 60% proficiency, ranked #8 of 73 in FL (top 11%) — acceptable for families but not a draw, mixed tenant base, ~2y average lease.
- Zoned schools: Oriole Beach Elementary School (math 76% / reading 72%, grade A, #249 of 2,144 statewide, top 12%, 799 students, 32% FRL); Gulf Breeze Middle School (math 82% / reading 72%, grade A, #28 of 571 statewide, top 5%, 936 students, 22% FRL); Gulf Breeze High School (math 67% / reading 69%, grade B, #66 of 667 statewide, top 10%, 1,978 students, 21% FRL).
- Market conditions: Rents rising fast (+4.6%/yr); 459 active listings in the ZIP; 6 comparable units currently listed for rent nearby; rentals at typical pace (median 26d on market — plan ~3-4 weeks tenant-placement turnaround); solid renter incomes; 1,983 units permitted in Santa Rosa County in 2024 (128 in 5+ unit buildings).
Forward outlook
- Local home prices are declining (-3.0%/yr); year-one equity from $1k of loan paydown is wiped out by about $6k of value loss. Plan a longer hold.
- Santa Rosa County population projected at +31% by 2050 — long-run rental-demand tailwind backs the buy-and-hold thesis.
Negotiation context
- It's been on market 31 days — a 3% lower offer ($179k) is reasonable based on typical stale-listing flexibility.
Risks & watch-outs
- Watch-outs: flood insurance adds $66/mo.
- Climate carrying-cost: major flood risk; severe wind risk, 99% chance of damaging wind over 30y; extreme-heat days projected 7→23/yr by 2055 (HVAC capex compounding) — expect insurance premiums to compound above CPI over the hold.
Questions for the listing agent
- What do current leases actually rent for vs. the listed asking? Can we see a recent rent roll and the last 12 months of T-12 income?
- It's been on market 31 days. Have you received any prior offers? Is the seller open to a 13% concession, seller financing, or rate buy-down credit?
- What's the actual annual flood-insurance premium (NFIP or private), and is the property in a SFHA with mandatory coverage?
- Is there a deadline driving the sale (1031 exchange, divorce, estate, relocation)? That informs how much negotiation room exists.
- The area grade is low — what's the realistic commute time and amenity access for the typical tenant pool here? Any planned neighborhood developments (good or bad) we should know about?
- What's the average days-on-market for RENTAL listings here right now (not sales)? A rising rental-DOM trend means longer vacancies and softer asking-rent achievability than the comps imply.
- What's the recent tenant-quality profile in this submarket — average credit score on applications, eviction rate, late-payment / NSF rate, and stable-employment percentage? A property-management company in the area should have these aggregated.
- How much new for-sale + rental construction is in the pipeline within 1–3 miles? Heavy new supply typically softens prices + rents 12–24 months out; constrained supply supports both.
Investment metrics
- 1% rule
- 0.87% ✗
- Cap rate
- 6.26%
- Cash-on-cash
- -0.12%
- DSCR
- 0.99
- GRM
- 9.6
CMA / ARV
No comps found within radius.
Projected returns pro-forma
-3.0% appreciation · 4.6% rent growth · sell at horizon
- IRR
- -17.1%
- Equity multiple
- 0.39×
- Total profit
- $-31,850
- Equity at exit
- $27,584
- IRR
- -6.2%
- Equity multiple
- 0.57×
- Total profit
- $-22,184
- Equity at exit
- $15,995
Cash invested: $51,800 (down + closing). Projections, not guarantees.
Landlord ↔ Tenant lean methodology
- Overall (STATE)
- 87 Strongly Landlord-Friendly
- State Florida
- 87 Strongly Landlord-Friendly · R+3
- County
- — inherits STATE
- City
- — inherits STATE
ZIP-level market 32563
- Rents YoY
- 4.6%
- Active inventory
- 459
- Price-to-rent
- 9.6×
Monthly cashflow live
- Estimated rent
- $1,612 high interval (Pro) →
- Mortgage (P&I)
- −$970
- Tax est. 1.5%
- −$231 /mo · $2,775/yr
- Insurance
- −$77
- Flood insurance flood zone
- −$66 /mo · $798/yr
- HOA
- −$0
- Lot rent
- −$0
- Vacancy / Maint / Mgmt
- −$338
- Net cashflow
- $-72
Break-even live
Sensitivity live
| Price | -10% $56 | -5% $-8 | +0% $-72 | +5% $-136 | +10% $-200 |
|---|---|---|---|---|---|
| Rent | -10% $-199 | -5% $-135 | +0% $-72 | +5% $-8 | +10% $56 |
| Rate | -1.0pp $21 | -0.5pp $-25 | base $-72 | +0.5pp $-120 | +1.0pp $-169 |
UW: 25.0% down · 7.5% · 30yr · 1.5% tax · 5.0% vac · 8.0% maint · 8.0% mgmt
Financing live
Cash to close
- Down payment
- $46,250
- Closing costs
- $5,550
- Reserves months
- —
- Total cash needed
- —
Loan-product check · same deal, 3 products live
Conventional
25% down · 7.5% · 30yr
- Down + closing
- —
- Monthly P&I
- —
- Monthly cashflow
- —
- DSCR
- —
- Eligible?
- —
Personal DTI + credit; lowest rate.
DSCR
20% down · 8.5% · 30yr
- Down + closing
- —
- Monthly P&I
- —
- Monthly cashflow
- —
- DSCR
- —
- Eligible?
- —
No personal income docs; deal must DSCR.
Hard money
10% down · 12.0% · 12mo
- Down + closing
- —
- Monthly P&I
- —
- Monthly cashflow
- —
- DSCR
- —
- Eligible?
- —
Short-term bridge; refi at stabilization.
Rent comps 6 comps
| Address | Beds | Baths | Sqft | Rent | $/sqft | DOM | Units | Dist |
|---|---|---|---|---|---|---|---|---|
| 3226 Santa Rosa Dr Gulf Breeze, FL | 3.0 | 2.0 | 1108 | $1,600 | $1.44 | 26d | 1 | 0.36mi |
| 3208 College Ct Gulf Breeze, FL | 1.0–2.0 | 1.0–2.0 | 825 | $1,756 | $2.13 | 16d | 11 | 0.49mi |
| 3409 Green Briar Cir Gulf Breeze, FL | 1.0 | 1.0 | 688 | $1,095 | $1.59 | 26d | 1 | 0.95mi |
| 3411 Green Briar Cir Unit 2 Gulf Breeze, FL | 1.0 | 1.0 | 688 | $1,150 | $1.67 | 26d | 1 | 0.97mi |
| 1614 Green Briar Pkwy #4 Gulf Breeze, FL | 2.0 | 1.0 | 950 | $1,220 | $1.28 | 26d | 1 | 1.04mi |
| 2808 Villa Woods Cir Gulf Breeze, FL | 2.0 | 1.5 | 1040 | $1,375 | $1.32 | 16d | 1 | 1.19mi |
Listing history 18 events
-
2026-06-23days on market $185,000 Active 31 DOM
-
2026-06-22days on market $185,000 Active 30 DOM
-
2026-06-18days on market $185,000 Active 27 DOM
-
2026-06-17days on market $185,000 Active 26 DOM
-
2026-06-16days on market $185,000 Active 25 DOM
-
2026-06-15days on market $185,000 Active 24 DOM
-
2026-06-14days on market $185,000 Active 22 DOM
-
2026-06-10days on market $185,000 Active 19 DOM
-
2026-06-09days on market $185,000 Active 18 DOM
-
2026-06-08days on market $185,000 Active 17 DOM
-
2026-06-07days on market $185,000 Active 16 DOM
-
2026-06-05days on market $185,000 Active 13 DOM
-
2026-06-03days on market $185,000 Active 12 DOM
-
2026-06-02days on market $185,000 Active 11 DOM
-
2026-06-01days on market $185,000 Active 10 DOM
-
2026-05-31days on market $185,000 Active 9 DOM
-
2026-05-31days on market $185,000 Active 8 DOM
-
2026-05-23$185,000 Active
ⓘ Source: listings_history table (triggers on properties + properties_extension) + one-shot
backfill from property_details.listing_events for pre-trigger history.
Climate risk First Street
- Flood 7/10 Severe FEMA zone X (shaded) · 75% chance over 30 yrs
- Wildfire 1/10 Low
- Heat 10/10 Extreme 7 d/yr ≥105°F today · 23 d/yr by 30 yrs out
- Wind 9/10 Extreme 99% chance of damaging wind over 30 yrs
- Air quality 2/10 Low 1 unhealthy d/yr today · 1 by 30 yrs out
Nearby sold comps map
Loading sold comps map…
Walkable amenities ~0.75 mi
Loading nearby amenities…
Taxation est. · year 1
- Rental income
- $19,339
- − Mortgage interest
- −$10,363
- − Property taxes
- −$2,775
- − Insurance
- −$1,722
- − Repairs & maintenance
- −$1,547
- − Management
- −$1,547
- − Depreciation
- −$5,382
- Taxable loss
- −$3,997
- Est. tax savings @ 24.0%
- +$959
- After-tax cash flow
- $98/yr
For passive investors: Depreciation is non-cash, so a rental often shows a tax loss while cash-flowing — sheltering income. Rental losses are passive: they offset passive income freely, and up to $25,000/yr can offset ordinary (W-2) income if you actively participate and your MAGI is under $100k (phasing out to $0 by $150k); unused losses carry forward. On sale, claimed depreciation is recaptured at up to 25%, and gains may owe capital-gains tax (a 1031 exchange can defer both). Figures are a year-1 estimate at your 24.0% rate — not tax advice; consult a CPA.
Condition & rehab AI · 1 photo
This well-maintained, recently updated condo is ready for a fresh coat of paint and some landscaping improvements to maximize its resale and rental value.
Value-add opportunities
- Both Painting the exterior and interior walls — Fresh paint can enhance curb appeal and interior aesthetics.
- Both Landscaping improvements — A well-maintained yard can increase both resale and rental value.
- Both New flooring in the kitchen and bathrooms — Replacing old flooring with modern options can significantly boost appeal and value.
- Both Upgrading the appliances — Modern appliances can attract more buyers and renters, especially in a competitive market.
Renovation cost estimate screening
Value-add ROI direction
- Both Painting the exterior and interior walls — Fresh paint can enhance curb appeal and interior aesthetics. ↑
- Both Landscaping improvements — A well-maintained yard can increase both resale and rental value. ↑
- Both New flooring in the kitchen and bathrooms — Replacing old flooring with modern options can significantly boost appeal and value. ↑
- Both Upgrading the appliances — Modern appliances can attract more buyers and renters, especially in a competitive market. ↑
ⓘ Cost ranges are severity-bucket heuristics (US national rule-of-thumb). Get contractor quotes + a written scope before underwriting a rehab budget.
Schools (NCES district)
- District
- Santa Rosa
- NCES district ID
- 1201650
- Math proficiency
- 63% ▼ -6.00%
- Reading proficiency
- 60% ▼ -5.00%
- Median HH income
- $58,161
- Composite
- 53.12/100
- National rank
- #1511
- State rank
- #8 of 73 in FL
Livability — Midway
No livability data for this city. (Only ~50 U.S. cities are tracked.)
Census & demographics
- Census place
- Midway, FL
- County
- Santa Rosa County · 194,764 people
- Metro
- Pensacola-Ferry Pass-Brent, FL
- Population (ZIP)
- 30,364
- Household income
- $100,396
- Rent vs Own
- Severe rent burden
- 397.0
Population outlook (Santa Rosa County) Hauer SSP2
- Today (2025)
- 195,978 people
- By 2030
- 209,782 · +7.0%
- By 2040
- 235,293 · +20.1%
- By 2050
- 256,408 · +30.8%
- By 2075
- 298,074 · +52.1%
- By 2100
- 303,216 · +54.7%
Race, ethnicity, and origin ACS 2023
- Neighborhood character
- Predominantly White (87%)
- Race & ethnicity
- White 87% Two or more races 6% Hispanic / Latino 6% Black 2% Asian 1%
- Hispanic origin (detail)
- Mexican 2%
- Common ancestry
- Italian 5% Slovak 3% Romanian 3%
- Foreign-born
- 4% · Canada
- Languages at home
- 94% English-only · Spanish 3% German/W. Germanic 1% Chinese 1%
Political lean MEDSL · Santa Rosa
- 2024 margin
- Solid R (+51.0) · D 24.1% · R 75.0%
- 2008→2024 swing
- -3.0pp toward R · 2008: -47.9pp · 2024: -51.0pp
- All cycles
- 2024: R+51.0 2020: R+46.5 2016: R+53.5 2012: R+52.6 2008: R+47.9
Not yet ingested
- Civics
- —
Market trends
- HPI YoY
- ▼ -229.78%
- Current HPI
- 278.9852
- Rent YoY
- ▲ 4.60%
- Metro
- Pensacola-Ferry Pass-Brent, FL
- State GDP YoY
- ▲ 3.28%
- F500 in state
- 36
Industry mix (Fortune 500 HQ in FL)
| Industry | F500 HQs | Revenue |
|---|---|---|
| Industrial Technology | 2 | $29B |
|
||
| Insurance | 2 | $17B |
|
||
| Retail | 1 | $60B |
|
||
| Technology Distribution | 1 | $58B |
|
||
| Homebuilding | 1 | $35B |
|
||
| Technology Manufacturing | 1 | $35B |
|
||
Price history
1 event — show timeline
- 2026-05-23 Listed $185,000 FSBO.com
Cash-flow waterfall
monthlySold comps — $/sqft
last 12 mo · ≤1 miLoading sold comps…