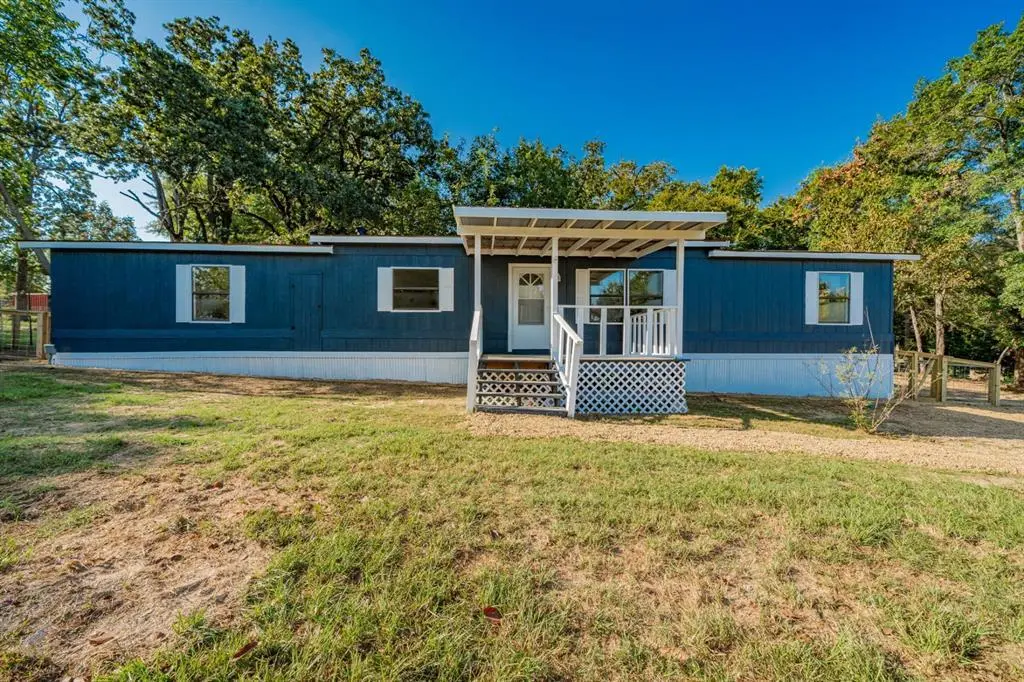
106 Creekwood Dr · Payne Springs, TX
Flood risk 1/10 · Minimal
- FEMA flood zone
- X (unshaded)
- Chance of flooding over 30 yrs
- 0.0%
- Est. flood insurance / yr
- $507 – $1,088
Fire risk 3/10 · Minor
- Est. fire insurance / yr
- $1,222 – $2,270
Heat risk 7/10 · Major
- Hot days now (above 110°F)
- 7 days/yr
- Hot days in 30 yrs
- 26 days/yr
Wind risk 6/10 · Moderate
- Chance of severe wind over 30 yrs
- 64.0%
Air-quality risk 2/10 · Minimal
- Unhealthy air days now
- 0 days/yr
- Unhealthy air days in 30 yrs
- 1 days/yr
Risk factors via First Street. Map © Google.
Why this score? — see what drove the C grade
The composite is a weighted blend of 9 inputs, each scored 0–100. Each bar is that input's sub-score; the figure is the points it added to the 100-point composite (weight × sub-score).
- Cash flow +25.1/30.0
- DSCR +8.2/10.0
- ARV discount +7.5/15.0
- 1% rule +5.4/10.0
- Schools +3.2/10.0
- Livability +3.1/5.0
- Condition / age +2.5/5.0
- Rent growth +1.1/5.0
- Appreciation +0.0/10.0
$139,900
🖨 Deal sheet (PDF) 📄 Offer letter ✓ Due diligence
Listing remarks MLS
NICE INVESTMENT OR STARTER HOME. THIS HOME SITS ON 4 NICE SIZE LOTS AND HAS A GREAT WATERVIEW.
Key facts
- Waterproof flooring
- Brand-new kitchen
- Fenced backyard
Tags
Property features AI
Finance
- Other: Located in Hidden Hills Harbor Add Sec C subdivision; Lot less than 0.5 acre
- Financial info: Listing terms: Cash or Conventional; Second mortgage: none; Loan type treated as clear
- HOA & community: Mandatory association with a monthly fee of $19 that includes management fees; HOA managed by Hidden Hills Harbor
Exterior
- Parking: Off-street parking
- Security: Smoke detectors
- Utilities: City water
- Home design: Manufactured home; Single-story
- Construction: Built in 1980; Siding construction; Composition roof; Other foundation
- Exterior features: Covered porch(es); Deck; Back yard fencing
Interior
- Kitchen: Dishwasher; Electric oven; Electric range
- Bedrooms: 2 bedrooms (primary bedroom on main level)
- Flooring: Laminate flooring
- Bathrooms: 2 full bathrooms
- Interior features: One living area and one dining area; Wood-burning fireplace; Other interior features
- Laundry & utility: Electric dryer hookup
Neighborhood map
What this means for you Summary
Snapshot
- This is a 2-bed/2.0-bath manufactured listed at $140k.
Deal economics
- At list price, monthly cash flow is $309 ($4k/yr) — positive.
- The deal already cash-flows at list — no discount required.
- Meets the 1% rule at list price ($1k rent vs $140k).
- Recommended offer: $136k (3.0% below list) — sets the bar for market timing.
- Cap rate 8.9% vs local median 3.8% in Payne Springs — top-decile yield for the area; either an underpriced asset or a hidden risk that comps aren't pricing in. Stress-test before assuming the spread holds.
Location & tenants
- Location reads 61/100 on livability (#985 in TX) — a middle-class / working-renter tenant base. Strengths: crime A+, cost of living A+, housing A; Watch: amenities F, commute F, employment D-.
- Eustace ISD (rural): math 32% / reading 45% proficiency, ranked #455 of 826 in TX (top 55%) — families likely to look elsewhere, expect single-tenant / working-renter base with shorter leases; 62% free/reduced lunch — lower-income household profile, screen leases tightly.
- Zoned schools: Eustace Pri (497 students, 74% FRL).
- Market conditions: Rents falling (-5.8%/yr); 699 active listings in the ZIP; 3 comparable units currently listed for rent nearby; rentals lingering (median 45d on market — plan ~5-8 weeks vacancy on turnover, expect pricing pressure); 100% of comp listings sitting > 30 days — soft ceiling on asking rent; 263 units permitted in Henderson County in 2024 (0 in 5+ unit buildings).
Forward outlook
- Local home prices are declining (-3.0%/yr); year-one equity from $967 of loan paydown is wiped out by about $4k of value loss. Plan a longer hold.
Negotiation context
- It's been on market 31 days — a 3% lower offer ($136k) is reasonable based on typical stale-listing flexibility.
- 3 sale attempts since 15y ago with the ask held roughly flat each time — persistent listings suggest the price (not the market) is what's stuck; bring a comps-based counter.
Risks & watch-outs
- Climate carrying-cost: major wind risk, 64% chance of damaging wind over 30y; extreme-heat days projected 7→26/yr by 2055 (HVAC capex compounding) — expect insurance premiums to compound above CPI over the hold.
Questions for the listing agent
- It's been on market 31 days. Have you received any prior offers? Is the seller open to a 3% concession, seller financing, or rate buy-down credit?
- What does the HOA fee cover, when was the last increase, and are there any pending special assessments or reserve-fund shortfalls?
- Is there a deadline driving the sale (1031 exchange, divorce, estate, relocation)? That informs how much negotiation room exists.
- Schools are F-rated, which usually means shorter tenancies and higher turnover. Who's the typical renter profile here, and what's been the actual vacancy rate?
- What's the average days-on-market for RENTAL listings here right now (not sales)? A rising rental-DOM trend means longer vacancies and softer asking-rent achievability than the comps imply.
- What's the recent tenant-quality profile in this submarket — average credit score on applications, eviction rate, late-payment / NSF rate, and stable-employment percentage? A property-management company in the area should have these aggregated.
- How much new for-sale + rental construction is in the pipeline within 1–3 miles? Heavy new supply typically softens prices + rents 12–24 months out; constrained supply supports both.
Investment metrics
- 1% rule
- 1.04% ✓
- Cap rate
- 8.95%
- Cash-on-cash
- 9.48%
- DSCR
- 1.42
- GRM
- 8.0
CMA / ARV
- ARV (on-the-fly)
- $314,496
- Comps found
- 2
Show comp detail 2 sales within ~0.75 mi
| Address | Dist | Beds/Ba | Sqft | Sold | Price | $/sf | Match |
|---|---|---|---|---|---|---|---|
| 215 Oak Hills Dr | 0.35mi | 2/1.0 | 1,080 (+7%) | 16mo | $69,000 | $64 | 54 |
| 146 Lynn Creek Dr | 0.71mi | 3/2.0 (+1) | 1,120 (+11%) | 14mo | $349,999 | $312 | 32 |
Match score weights: distance 35% · size 25% · config 20% · recency 20%. Top-matched comps best support the ARV.
Projected returns pro-forma
-3.0% appreciation · 0.0% rent growth · sell at horizon
- IRR
- -5.1%
- Equity multiple
- 0.81×
- Total profit
- $-7,288
- Equity at exit
- $20,860
- IRR
- 1.0%
- Equity multiple
- 1.06×
- Total profit
- $2,311
- Equity at exit
- $12,096
Cash invested: $39,172 (down + closing). Projections, not guarantees.
Landlord ↔ Tenant lean methodology
- Overall (STATE)
- 87 Strongly Landlord-Friendly
- State Texas
- 87 Strongly Landlord-Friendly · R+5
- County
- — inherits STATE
- City
- — inherits STATE
ZIP-level market 75156
- Rents YoY
- -5.8%
- Active inventory
- 699
- Price-to-rent
- 8.0×
Monthly cashflow live
- Estimated rent
- $1,456 medium interval (Pro) →
- Mortgage (P&I)
- −$734
- Tax from tax record
- −$30 /mo · $359/yr
- Insurance
- −$58
- HOA
- −$19
- Vacancy / Maint / Mgmt
- −$306
- Net cashflow
- $309
Break-even live
Sensitivity live
| Price | -10% $389 | -5% $349 | +0% $309 | +5% $270 | +10% $230 |
|---|---|---|---|---|---|
| Rent | -10% $194 | -5% $252 | +0% $309 | +5% $367 | +10% $424 |
| Rate | -1.0pp $380 | -0.5pp $345 | base $309 | +0.5pp $273 | +1.0pp $236 |
UW: 25.0% down · 7.5% · 30yr · 1.5% tax · 5.0% vac · 8.0% maint · 8.0% mgmt
Financing live
Cash to close
- Down payment
- $34,975
- Closing costs
- $4,197
- Reserves months
- —
- Total cash needed
- —
Loan-product check · same deal, 3 products live
Conventional
25% down · 7.5% · 30yr
- Down + closing
- —
- Monthly P&I
- —
- Monthly cashflow
- —
- DSCR
- —
- Eligible?
- —
Personal DTI + credit; lowest rate.
DSCR
20% down · 8.5% · 30yr
- Down + closing
- —
- Monthly P&I
- —
- Monthly cashflow
- —
- DSCR
- —
- Eligible?
- —
No personal income docs; deal must DSCR.
Hard money
10% down · 12.0% · 12mo
- Down + closing
- —
- Monthly P&I
- —
- Monthly cashflow
- —
- DSCR
- —
- Eligible?
- —
Short-term bridge; refi at stabilization.
Rent comps 3 comps
| Address | Beds | Baths | Sqft | Rent | $/sqft | DOM | Units | Dist |
|---|---|---|---|---|---|---|---|---|
| 102 Lynn Creek Dr Mabank, TX | 3.0 | 1.0 | 1400 | $995 | $0.71 | 45d | 1 | 0.78mi |
| 110 Bowie St Mabank, TX | 3.0 | 2.0 | 1200 | $1,550 | $1.29 | 45d | 1 | 1.04mi |
| 120 Trails End St Mabank, TX | 2.0 | 2.0 | 1176 | $1,895 | $1.61 | 45d | 1 | 1.15mi |
HOA detail
- Monthly dues
- $19 · $228/yr
- Likely covers
- water
Listing history 22 events
-
2026-06-19days on market $139,900 Active 31 DOM
-
2026-06-18days on market $139,900 Active 30 DOM
-
2026-06-17days on market $139,900 Active 29 DOM
-
2026-06-16days on market $139,900 Active 28 DOM
-
2026-06-15days on market $139,900 Active 27 DOM
-
2026-06-14days on market $139,900 Active 25 DOM
-
2026-06-12days on market $139,900 Active 24 DOM
-
2026-06-09days on market $139,900 Active 21 DOM
-
2026-06-08days on market $139,900 Active 20 DOM
-
2026-06-07days on market $139,900 Active 19 DOM
-
2026-06-05days on market $139,900 Active 16 DOM
-
2026-06-02days on market $139,900 Active 14 DOM
-
2026-06-01days on market $139,900 Active 13 DOM
-
2026-05-31days on market $139,900 Active 12 DOM
-
2026-05-30days on market $139,900 Active 11 DOM
-
2026-05-19$139,900 Active
-
2026-03-16historical
-
2026-02-13price $139,900
-
2025-12-06price $149,900
-
2025-09-16$159,900 Active
-
2012-01-16soldstatus 94-char remark
Show marketing remark (94 chars)
NICE INVESTMENT OR STARTER HOME. THIS HOME SITS ON 4 NICE SIZE LOTS AND HAS A GREAT WATERVIEW.
-
2011-11-29$20,000 94-char remark
Show marketing remark (94 chars)
NICE INVESTMENT OR STARTER HOME. THIS HOME SITS ON 4 NICE SIZE LOTS AND HAS A GREAT WATERVIEW.
ⓘ Source: listings_history table (triggers on properties + properties_extension) + one-shot
backfill from property_details.listing_events for pre-trigger history.
Tax reassessment forecast TX · Resets to sale price
- Current annual tax
- $359 · $30/mo
- Projected year-2 tax
- $2,560 · $213/mo
- Expected delta
- +$2,202/yr (+$183/mo · 614.1%)
ⓘ Screening estimate from a state-policy table — verify with the county assessor before closing.
Climate risk First Street
- Flood 1/10 Low FEMA zone X (unshaded) · 0% chance over 30 yrs
- Wildfire 3/10 Moderate
- Heat 7/10 Severe 7 d/yr ≥110°F today · 26 d/yr by 30 yrs out
- Wind 6/10 Major 64% chance of damaging wind over 30 yrs
- Air quality 2/10 Low 0 unhealthy d/yr today · 1 by 30 yrs out
Nearby sold comps map
Loading sold comps map…
Walkable amenities ~0.75 mi
Loading nearby amenities…
Taxation est. · year 1
- Rental income
- $17,471
- − Mortgage interest
- −$7,837
- − Property taxes
- −$359
- − Insurance
- −$700
- − Repairs & maintenance
- −$1,398
- − Management
- −$1,398
- − HOA
- −$228
- − Depreciation
- −$4,070
- Taxable income
- $1,483
- Est. tax owed @ 24.0%
- −$356
- After-tax cash flow
- $3,356/yr
For passive investors: Depreciation is non-cash, so a rental often shows a tax loss while cash-flowing — sheltering income. Rental losses are passive: they offset passive income freely, and up to $25,000/yr can offset ordinary (W-2) income if you actively participate and your MAGI is under $100k (phasing out to $0 by $150k); unused losses carry forward. On sale, claimed depreciation is recaptured at up to 25%, and gains may owe capital-gains tax (a 1031 exchange can defer both). Figures are a year-1 estimate at your 24.0% rate — not tax advice; consult a CPA.
Schools (NCES district)
- District
- Eustace ISD
- NCES district ID
- 4818720
- Math proficiency
- 32% ▼ -18.00%
- Reading proficiency
- 45% ▼ -7.00%
- Median HH income
- $42,425
- Composite
- 32.48/100
- National rank
- #5711
- State rank
- #455 of 826 in TX
Livability — Payne Springs
- Score
- 61/100
- State rank
- #985
- US rank
- #17539
Category grades
Schools grade is shown separately in the Schools card above.
Census & demographics
- County
- Henderson County · 34,977 people
- City population
- 16,333
- Metro
- Athens, TX
- Population (ZIP)
- 16,333
- Household income
- $60,867
- Rent vs Own
- Severe rent burden
- 400.0
Population outlook (Henderson County) Hauer SSP2
- Today (2025)
- 80,471 people
- By 2030
- 80,608 · +0.2%
- By 2040
- 80,087 · -0.5%
- By 2050
- 78,208 · -2.8%
- By 2075
- 72,423 · -10.0%
- By 2100
- 61,012 · -24.2%
Race, ethnicity, and origin ACS 2023
- Neighborhood character
- Predominantly White (85%)
- Race & ethnicity
- White 85% Hispanic / Latino 7% Two or more races 7% Black 1%
- Hispanic origin (detail)
- Mexican 5%
- Common ancestry
- Slovak 3% Serbian 2% European 2%
- Foreign-born
- 4% · Canada, Jamaica
- Languages at home
- 94% English-only · Spanish 4% Other Indo-European 1%
Political lean MEDSL · Henderson
- 2024 margin
- Solid R (+63.5) · D 18.0% · R 81.4%
- 2008→2024 swing
- -18.8pp toward R · 2008: -44.6pp · 2024: -63.5pp
- All cycles
- 2024: R+63.5 2020: R+60.2 2016: R+60.0 2012: R+54.8 2008: R+44.6
Not yet ingested
- Civics
- —
Market trends
- HPI YoY
- ▼ -216.77%
- Current HPI
- 199.8108
- Rent YoY
- ▼ -5.76%
- Metro
- Athens, TX
- State GDP YoY
- ▲ 3.95%
- F500 in state
- 110
Industry mix (Fortune 500 HQ in TX)
| Industry | F500 HQs | Revenue |
|---|---|---|
| Energy | 16 | $1,198B |
|
||
| Technology | 5 | $198B |
|
||
| Engineering / Construction | 4 | $72B |
|
||
| Energy Services | 3 | $60B |
|
||
| Utilities | 3 | $41B |
|
||
| Healthcare | 2 | $330B |
|
||
Price history
+599.5% since first listed7 events — show timeline
- 2026-05-19 Listed $139,900 NTREIS
- 2026-03-16 Listing Removed — NTREIS
- 2026-02-13 Price Changed $139,900 NTREIS
- 2025-12-06 Price Changed $149,900 NTREIS
- 2025-09-16 Listed $159,900 NTREIS
- 2012-01-16 Sold (MLS) — HCBOR
- 2011-11-29 Listed $20,000 HCBOR
Property tax history
+1.8%/yrLatest (2025): $359 · +3.2% YoY. Source: county tax records.
Cash-flow waterfall
monthlySold comps — $/sqft
last 12 mo · ≤1 miLoading sold comps…