 🌊 Lakefront
7774 Gardner Dr #202 · Pelican Marsh, FL
Flood risk 1/10 · Minimal
- FEMA flood zone
- X (unshaded)
- Chance of flooding over 30 yrs
- 0.0%
- Est. flood insurance / yr
- $507 – $1,088
Fire risk 1/10 · Minimal
- Est. fire insurance / yr
- $947 – $1,759
Heat risk 10/10 · Severe
- Hot days now (above 107°F)
- 7 days/yr
- Hot days in 30 yrs
- 26 days/yr
Wind risk 10/10 · Severe
- Chance of severe wind over 30 yrs
- 99.0%
Air-quality risk 2/10 · Minimal
- Unhealthy air days now
- 2 days/yr
- Unhealthy air days in 30 yrs
- 2 days/yr
Risk factors via First Street. Map © Google.
Why this score? — see what drove the B- grade
The composite is a weighted blend of 9 inputs, each scored 0–100. Each bar is that input's sub-score; the figure is the points it added to the 100-point composite (weight × sub-score).
- Cash flow +26.2/30.0
- 1% rule +9.1/10.0
- DSCR +8.9/10.0
- ARV discount +7.5/15.0
- Appreciation +5.1/10.0
- Schools +5.0/10.0
- Rent growth +2.7/5.0
- Livability +2.5/5.0
- Condition / age +2.5/5.0
$379,900
🖨 Deal sheet 📄 Offer letter ✓ Due diligence
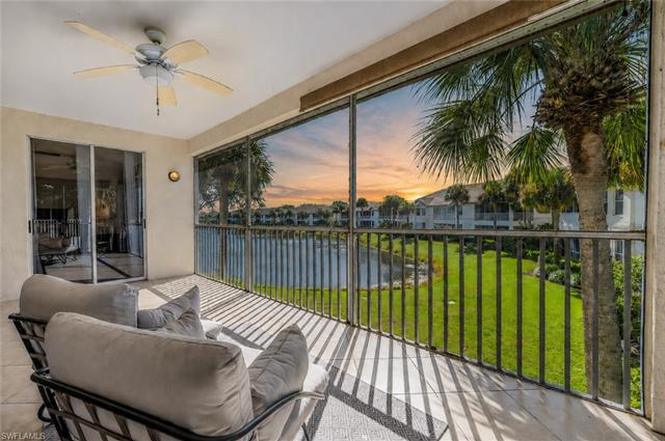
Listing remarks
Welcome to this beautifully updated second-floor coach home in the desirable gated community of The Orchards in North Naples. Offering three bedrooms, two full baths, and a private attached garage, this light-filled residence with soaring high ceilings features an inviting open floor plan with serene lake views. The interior was freshly painted in October 2025, including all walls and ceilings, creating a crisp, move-in-ready atmosphere. Major updates include the replacement of all polybutylene plumbing, a brand new water heater (October 2025), and 5 year young roof provide peace of mind for years to come. The spacious great room and adjacent kitchen dining area flow seamlessly to the scree
Key facts
- Gated community
- Spa hot tub
- Lake views
Tags
Property features AI
Finance
- Financial info: Condo and master association fees are assessed (fees listed by management)
- HOA & community: Mandatory HOA (professional management); Quarterly master HOA fee; Quarterly condo fee; HOA maintenance covers cable, insurance, internet/Wi-Fi, irrigation water, lawn/land maintenance, legal/accounting, manager, exterior pest control, recreation facilities, reserves, security, sewer, street maintenance, trash removal and water; Community amenities include clubhouse, community pool and spa/hot tub, exercise room, basketball, bocce, pickleball, tennis, BBQ/picnic areas, play area, community room, streetlights and underground utilities; Total annual recurring HOA/association fees listed
Exterior
- Parking: Paved driveway; Attached garage with 1 garage space
- Security: Gated community; Entry keypad, entry phone, and entry TV
- Utilities: Central water; Central sewer; Cable available
- Home design: Residential property in a low-rise (1-3) building; 2-story carriage/coach style, corner unit; Rear exposure facing south; Located in the ORCHARDS development
- Construction: Concrete block construction; Built in 1995
- Exterior features: Lakefront setting with pond and water view; Water display; Stucco exterior; Single-hung and sliding windows; Tile roof; Irrigation from lake/canal
Interior
- Kitchen: Pantry; Dishwasher; Disposal; Microwave; Range; Refrigerator/Icemaker; Self-cleaning oven
- Bedrooms: 3 bedrooms with a split-bedroom floor plan
- Flooring: Carpet; Vinyl
- Bathrooms: 2 full bathrooms; Master bath with dual sinks and separate tub and shower
- Heating & cooling: Central electric heat; Central electric air conditioning; Ceiling fans
- Interior features: Cable prewire; French doors; High-speed internet available; Pantry; Smoke detectors; Volume ceiling; Walk-in closet; Window coverings; Screened lanai/porch; Guest room; Guest bath; Dining options include breakfast bar, eat-in kitchen, formal dining, and dining in living area
- Laundry & utility: Washer and dryer in residence; Auto garage door
Neighborhood map
What this means for you Summary
Snapshot
- This is a 3-bed/2.0-bath condo listed at $380k.
Deal economics
- At list price, monthly cash flow is $969 ($12k/yr) — positive.
- The deal already cash-flows at list — no discount required.
- Meets the 1% rule at list price ($5k rent vs $380k).
- Recommended offer: $334k (12.0% below list) — sets the bar for market timing.
Location & tenants
- Location reads: area grade B — affects rentability + tenant quality, not the cash-flow math above.
- Collier (suburban): math 60% / reading 56% proficiency, ranked #16 of 73 in FL (top 22%) — acceptable for families but not a draw, mixed tenant base, ~2y average lease.
- Zoned schools: Pelican Marsh Elementary School (math 87% / reading 83%, grade A+, #35 of 2,144 statewide, top 2%, 709 students, 29% FRL); Barron Collier High School (math 62% / reading 68%, grade B, #76 of 667 statewide, top 11%, 1,650 students, 26% FRL) — zoned schools average 28% FRL vs 55% district-wide (27 pts lower); this property's tenant base skews higher-income than the district average.
- Zoned-school proficiency averages 75% at this address vs 58% district-wide (+17 pts) — the actual schools serving this property are materially stronger than the Collier average implies; a family-tenant draw the district grade alone would hide.
- Market conditions: Rents flat; 424 active listings in the ZIP; 40 comparable units currently listed for rent nearby; rentals at typical pace (median 24d on market — plan ~3-4 weeks tenant-placement turnaround); solid renter incomes; 3,520 units permitted in Collier County in 2024 (959 in 5+ unit buildings).
Forward outlook
- In year one you build about $4k of equity ($3k loan paydown + $1k appreciation (0.3% local appreciation)).
- Collier County population projected at +30% by 2050 — long-run rental-demand tailwind backs the buy-and-hold thesis.
- At projected returns (0.3% appreciation + 0.9% rent growth), your $106k cash investment doubles in ~7 years — after that, you're playing with house money.
- By year 8, paydown + projected appreciation supports a ~$34k cash-out refi (75% LTV) — recoverable capital for the next deal without selling this one.
Negotiation context
- It's been on market 214 days — a 12% lower offer ($334k) is reasonable based on typical stale-listing flexibility.
- 5 sale attempts since 16y ago; this cycle's ask has dropped $35k (8%) from the opening price — seller is motivated, your offer sets the floor, not the list.
- Current owner paid $175k; list at $380k implies a 117% gain — meaningful room to come down on a strong offer.
Risks & watch-outs
- Climate carrying-cost: severe wind risk, 99% chance of damaging wind over 30y; extreme-heat days projected 7→26/yr by 2055 (HVAC capex compounding) — expect insurance premiums to compound above CPI over the hold.
Questions for the listing agent
- It's been on market 214 days. Have you received any prior offers? Is the seller open to a 12% concession, seller financing, or rate buy-down credit?
- What does the HOA fee cover, when was the last increase, and are there any pending special assessments or reserve-fund shortfalls?
- Any open or pending special assessments — roof, HVAC, plumbing, elevator, façade? What's the per-unit balance and payoff schedule, and is the seller paying it off at close or rolling it to the buyer?
- Why hasn't it sold? Are there any deal-killer items the seller is aware of (foundation, flood, title, zoning, code violations)?
- Is there a deadline driving the sale (1031 exchange, divorce, estate, relocation)? That informs how much negotiation room exists.
- This sits on a lake — are riparian / water-frontage rights deeded with the parcel? Any dock permits, shoreline easements, or HOA water-use restrictions?
- What's the documented flood / surge / shoreline-erosion history here (FEMA AND non-FEMA — e.g., storm surge, creek backup, septic-field saturation)?
- Any water-quality or seasonal algae-bloom issues that affect tenant satisfaction or short-term-rental demand?
- What's the average days-on-market for RENTAL listings here right now (not sales)? A rising rental-DOM trend means longer vacancies and softer asking-rent achievability than the comps imply.
- What's the recent tenant-quality profile in this submarket — average credit score on applications, eviction rate, late-payment / NSF rate, and stable-employment percentage? A property-management company in the area should have these aggregated.
- How much new apartment / multifamily construction is in the pipeline within 1–3 miles? Heavy new supply (>2% of stock underway) typically softens rents 12–24 months out; light construction supports rent growth.
Investment metrics
- 1% rule
- 1.41% ✓
- Cap rate
- 9.35%
- Cash-on-cash
- 10.93%
- DSCR
- 1.49
- GRM
- 5.9
CMA / ARV
No comps found within radius.
Projected returns pro-forma
0.29% appreciation · 0.92% rent growth · sell at horizon
- IRR
- 8.9%
- Equity multiple
- 1.43×
- Total profit
- $45,382
- Equity at exit
- $115,946
- IRR
- 11.9%
- Equity multiple
- 2.26×
- Total profit
- $133,535
- Equity at exit
- $143,952
Cash invested: $106,372 (down + closing). Projections, not guarantees.
Landlord ↔ Tenant lean methodology
- Overall (STATE)
- 87 Strongly Landlord-Friendly
- State Florida
- 87 Strongly Landlord-Friendly · R+3
- County
- — inherits STATE
- City
- — inherits STATE
ZIP-level market 34109
- Home prices YoY
- 0.1%
- Rents YoY
- 0.9%
- Active inventory
- 424
- Price-to-rent
- 5.9×
Monthly cashflow live
- Estimated rent
- $5,366 high interval (Pro) →
- Mortgage (P&I)
- −$1,992
- Tax from tax record
- −$287 /mo · $3,447/yr
- Insurance
- −$158
- HOA
- −$832
- Vacancy / Maint / Mgmt
- −$1,127
- Net cashflow
- $969
Break-even live
UW: 25.0% down · 7.5% · 30yr · 1.5% tax · 5.0% vac · 8.0% maint · 8.0% mgmt
Financing live
Cash to close
- Down payment
- $94,975
- Closing costs
- $11,397
- Reserves months
- —
- Total cash needed
- —
Loan-product check · same deal, 3 products live
Conventional
25% down · 7.5% · 30yr
- Down + closing
- —
- Monthly P&I
- —
- Monthly cashflow
- —
- DSCR
- —
- Eligible?
- —
Personal DTI + credit; lowest rate.
DSCR
20% down · 8.5% · 30yr
- Down + closing
- —
- Monthly P&I
- —
- Monthly cashflow
- —
- DSCR
- —
- Eligible?
- —
No personal income docs; deal must DSCR.
Hard money
10% down · 12.0% · 12mo
- Down + closing
- —
- Monthly P&I
- —
- Monthly cashflow
- —
- DSCR
- —
- Eligible?
- —
Short-term bridge; refi at stabilization.
Rent comps 40 comps
| Address | Beds | Baths | Sqft | Rent | $/sqft | DOM | Units | Dist |
|---|---|---|---|---|---|---|---|---|
| 7762 Gardner Dr #102 Naples, FL | 2.0 | 2.0 | 1607 | $6,000 | $3.73 | 23d | 1 | 0.04mi |
| 7720 Gardner Dr #201 Naples, FL | 3.0 | 3.0 | 1960 | $5,500 | $2.81 | 23d | 1 | 0.13mi |
| 2585 Old Groves Rd Unit L203 Naples, FL | 2.0 | 2.0 | 1448 | $5,500 | $3.80 | 14d | 1 | 0.15mi |
| 7822 Gardner Dr Unit 6-101 Naples, FL | 2.0 | 2.0 | 1607 | $2,500 | $1.56 | 23d | 1 | 0.17mi |
| 7828 Gardner Dr Unit 5-202 Naples, FL | 3.0 | 2.0 | 1960 | $5,750 | $2.93 | 23d | 1 | 0.19mi |
| 7699 Groves Rd Naples, FL | 3.0 | 2.0 | 2259 | $10,000 | $4.43 | 23d | 1 | 0.21mi |
| 7518 Silver Trumpet Ln Unit Q102 Naples, FL | 2.0 | 2.0 | 1300 | $2,600 | $2.00 | 14d | 1 | 0.23mi |
| 2516 Orchid Bay Dr #203 Naples, FL | 2.0 | 2.0 | 1360 | $4,750 | $3.49 | 23d | 1 | 0.25mi |
| 2729 Branch Ln Naples, FL | 3.0 | 2.0 | 1800 | $3,650 | $2.03 | 23d | 1 | 0.29mi |
| 2476 Orchid Bay Dr Unit W201 Naples, FL | 3.0 | 2.0 | 1928 | $2,600 | $1.35 | 14d | 1 | 0.33mi |
| 2835 Mizzen Way Naples, FL | 3.0 | 2.0 | 1641 | $2,900 | $1.77 | 23d | 1 | 0.36mi |
| 2864 Mizzen Way Unit Y106 Naples, FL | 2.0 | 2.0 | 1350 | $5,200 | $3.85 | 14d | 1 | 0.38mi |
| 2730 Sailors Way Naples, FL | 3.0 | 3.0 | 1700 | $9,000 | $5.29 | 23d | 1 | 0.41mi |
| 2460 Old Groves Rd Unit E102 Naples, FL | 2.0 | 2.0 | 1226 | $2,400 | $1.96 | 14d | 1 | 0.42mi |
| 7710 Ahoy Ave Naples, FL | 3.0 | 2.0 | 1580 | $2,950 | $1.87 | 23d | 1 | 0.44mi |
| 2885 Citrus Lake Dr Unit N103 Naples, FL | 2.0 | 2.0 | 1249 | $5,250 | $4.20 | 14d | 1 | 0.44mi |
| 3296 Twilight Ln #6202 Naples, FL | 3.0 | 2.5 | 2133 | $6,500 | $3.05 | 14d | 1 | 0.49mi |
| 3320 Bermuda Isle Cir Naples, FL | 1.0–3.0 | 1.0–2.0 | 1134 | $3,270 | $2.88 | 14d | 45 | 0.49mi |
| 2662 Bolero Dr Unit 10 Naples, FL | 2.0 | 2.0 | 1768 | $15,000 | $8.48 | 23d | 1 | 0.54mi |
| 3048 Horizon Ln #1104 Naples, FL | 3.0 | 2.5 | 1818 | $5,150 | $2.83 | 23d | 1 | 0.54mi |
| 2608 Sailors Way #122 Naples, FL | 2.0 | 2.0 | 1387 | $5,500 | $3.97 | 23d | 1 | 0.54mi |
| 3062 Driftwood Way #4301 Naples, FL | 3.0 | 2.0 | 1573 | $6,500 | $4.13 | 23d | 1 | 0.55mi |
| 2630 Bolero Dr Unit 2-3 Naples, FL | 3.0 | 2.0 | 2256 | $24,000 | $10.64 | 23d | 1 | 0.55mi |
| 2630 Bolero Dr Unit 2-2 Naples, FL | 3.0 | 2.0 | 2256 | $25,000 | $11.08 | 23d | 1 | 0.55mi |
| 2880 Citrus Lake Dr Unit Q201 Naples, FL | 3.0 | 2.0 | 1590 | $2,495 | $1.57 | 14d | 1 | 0.56mi |
| 2860 Citrus Lake Dr Unit R-202 Naples, FL | 3.0 | 2.0 | 1590 | $5,000 | $3.14 | 14d | 1 | 0.56mi |
| 2860 Citrus Lake Dr Unit R202 Naples, FL | 3.0 | 2.0 | 1590 | $5,000 | $3.14 | 23d | 1 | 0.56mi |
| 2625 Estrella Dr Unit 15-1 Naples, FL | 3.0 | 2.0 | 1768 | $18,000 | $10.18 | 23d | 1 | 0.56mi |
| 2654 Bolero Dr Unit 8-1 Naples, FL | 3.0 | 2.0 | 1768 | $20,000 | $11.31 | 23d | 1 | 0.57mi |
| 3051 Horizon Ln #1803 Naples, FL | 2.0 | 2.0 | 1482 | $5,100 | $3.44 | 23d | 1 | 0.57mi |
| 2662 Bolero Dr #1002 Naples, FL | 3.0 | 2.0 | 2256 | $13,000 | $5.76 | 14d | 1 | 0.59mi |
| 3015 Horizon Ln #2702 Naples, FL | 3.0 | 2.0 | 1399 | $1,790 | $1.28 | 23d | 1 | 0.60mi |
| 2659 Bolero Dr #3 Naples, FL | 3.0 | 2.0 | 2341 | $24,000 | $10.25 | 23d | 1 | 0.60mi |
| 3057 Driftwood Way #4004 Naples, FL | 3.0 | 2.5 | 1818 | $6,400 | $3.52 | 23d | 1 | 0.60mi |
| 2731 Citrus Lake Dr #202 Naples, FL | 2.0 | 2.0 | 1260 | $2,500 | $1.98 | 14d | 1 | 0.60mi |
| 2738 Tiburon Blvd E Unit B405 Naples, FL | 2.0 | 2.5 | 1865 | $12,000 | $6.43 | 14d | 1 | 0.61mi |
| 3009 Driftwood Way #2802 Naples, FL | 3.0 | 2.0 | 1399 | $2,000 | $1.43 | 23d | 1 | 0.61mi |
| 2711 Citrus Lake Dr Unit F302 Naples, FL | 2.0 | 2.0 | 1272 | $4,500 | $3.54 | 14d | 1 | 0.61mi |
| 2711 Citrus Lake Dr Unit F305 Naples, FL | 3.0 | 2.0 | 1480 | $5,500 | $3.72 | 14d | 1 | 0.61mi |
| 2609 Estrella Ct #1902 Naples, FL | 3.0 | 2.0 | 2340 | $14,000 | $5.98 | 14d | 1 | 0.62mi |
HOA detail condo
- Monthly dues
- $832 · $9,984/yr
- Likely covers
- watersecurity
- Assessments
- None detected in remarks — confirm with the listing agent.
Listing history 27 events
-
2026-06-18days on market $379,900 Active 214 DOM
-
2026-06-17days on market $379,900 Active 213 DOM
-
2026-06-16days on market $379,900 Active 212 DOM
-
2026-06-15days on market $379,900 Active 211 DOM
-
2026-06-10days on market $379,900 Active 206 DOM
-
2026-06-09days on market $379,900 Active 205 DOM
-
2026-06-08days on market $379,900 Active 204 DOM
-
2026-06-07days on market $379,900 Active 203 DOM
-
2026-06-03days on market $379,900 Active 199 DOM
-
2026-06-02days on market $379,900 Active 198 DOM
-
2026-06-01days on market $379,900 Active 197 DOM
-
2026-05-31days on market $379,900 Active 196 DOM
-
2026-05-30days on market $379,900 Active 195 DOM
-
2026-04-15price $379,900
-
2026-02-23price $399,900
-
2025-11-16$415,000 Active
-
2025-08-31historical
-
2025-01-27$415,000 Active
-
2024-11-30historical
-
2024-09-17price $425,000
-
2024-06-09$450,000 Active
-
2011-02-25soldstatus $175,250
-
2011-01-12$174,900
-
2010-11-03historical
-
2010-09-14$179,900
-
2000-06-27soldstatus $159,000
-
1995-10-19soldstatus $133,000
ⓘ Source: listings_history table (triggers on properties + properties_extension) + one-shot
backfill from property_details.listing_events for pre-trigger history.
Tax reassessment forecast FL · Resets to sale price
- Current annual tax
- $3,447 · $287/mo
- Projected year-2 tax
- $3,447 · $287/mo
- Expected delta
- $0/yr ($0/mo · 0.0%)
ⓘ Screening estimate from a state-policy table — verify with the county assessor before closing.
Climate risk First Street
- Flood 1/10 Low FEMA zone X (unshaded) · 0% chance over 30 yrs
- Wildfire 1/10 Low
- Heat 10/10 Extreme 7 d/yr ≥107°F today · 26 d/yr by 30 yrs out
- Wind 10/10 Extreme 99% chance of damaging wind over 30 yrs
- Air quality 2/10 Low 2 unhealthy d/yr today · 2 by 30 yrs out
Nearby sold comps map
Loading sold comps map…
Walkable amenities ~0.75 mi
Loading nearby amenities…
Taxation est. · year 1
- Rental income
- $64,388
- − Mortgage interest
- −$21,280
- − Property taxes
- −$3,447
- − Insurance
- −$1,900
- − Repairs & maintenance
- −$5,151
- − Management
- −$5,151
- − HOA
- −$9,984
- − Depreciation
- −$11,052
- Taxable income
- $6,424
- Est. tax owed @ 24.0%
- −$1,542
- After-tax cash flow
- $10,088/yr
For passive investors: Depreciation is non-cash, so a rental often shows a tax loss while cash-flowing — sheltering income. Rental losses are passive: they offset passive income freely, and up to $25,000/yr can offset ordinary (W-2) income if you actively participate and your MAGI is under $100k (phasing out to $0 by $150k); unused losses carry forward. On sale, claimed depreciation is recaptured at up to 25%, and gains may owe capital-gains tax (a 1031 exchange can defer both). Figures are a year-1 estimate at your 24.0% rate — not tax advice; consult a CPA.
Schools (NCES district)
- District
- Collier
- NCES district ID
- 1200330
- Math proficiency
- 60% ▼ -4.00%
- Reading proficiency
- 56% ▼ -2.00%
- Median HH income
- $58,275
- Composite
- 50.23/100
- National rank
- #1892
- State rank
- #16 of 73 in FL
Livability — Pelican Marsh
No livability data for this city. (Only ~50 U.S. cities are tracked.)
Census & demographics
- County
- Collier County · 396,295 people
- Metro
- Naples-Marco Island, FL
- Population (ZIP)
- 27,273
- Household income
- $92,259
- Rent vs Own
- Severe rent burden
- 1712.0
Population outlook (Collier County) Hauer SSP2
- Today (2025)
- 420,858 people
- By 2030
- 450,054 · +6.9%
- By 2040
- 502,232 · +19.3%
- By 2050
- 544,932 · +29.5%
- By 2075
- 627,203 · +49.0%
- By 2100
- 659,015 · +56.6%
Race, ethnicity, and origin ACS 2023
- Neighborhood character
- Predominantly White (78%)
- Race & ethnicity
- White 78% Hispanic / Latino 11% Two or more races 9% Black 4% Asian 4%
- Hispanic origin (detail)
- Mexican 1% Puerto Rican 1% Cuban 3%
- Common ancestry
- Romanian 5% Scotch-Irish 3% Lithuanian 2%
- Foreign-born
- 20% · Canada, Jamaica, Vietnam
- Languages at home
- 77% English-only · Spanish 10% Other Indo-European 5% Russian/Polish/Slavic 3%
Political lean MEDSL · Collier
- 2024 margin
- Solid R (+33.1) · D 33.1% · R 66.2%
- 2008→2024 swing
- -10.6pp toward R · 2008: -22.5pp · 2024: -33.1pp
- All cycles
- 2024: R+33.1 2020: R+24.7 2016: R+26.0 2012: R+30.1 2008: R+22.5
Not yet ingested
- Civics
- —
Market trends
- HPI YoY
- ▲ 0.29%
- Current HPI
- 279.357
- Rent YoY
- ▲ 0.92%
- Metro
- Naples-Marco Island, FL
- State GDP YoY
- ▲ 3.28%
- F500 in state
- 36
Industry mix (Fortune 500 HQ in FL)
| Industry | F500 HQs | Revenue |
|---|---|---|
| Industrial Technology | 2 | $29B |
|
||
| Insurance | 2 | $17B |
|
||
| Retail | 1 | $60B |
|
||
| Technology Distribution | 1 | $58B |
|
||
| Homebuilding | 1 | $35B |
|
||
| Technology Manufacturing | 1 | $35B |
|
||
Price history
+185.6% since first listed14 events — show timeline
- 2026-04-15 Price Changed $379,900 NAPLESMLS
- 2026-02-23 Price Changed $399,900 NAPLESMLS
- 2025-11-16 Listed $415,000 NAPLESMLS
- 2025-08-31 Listing Removed — NAPLESMLS
- 2025-01-27 Listed $415,000 NAPLESMLS
- 2024-11-30 Listing Removed — NAPLESMLS
- 2024-09-17 Price Changed $425,000 NAPLESMLS
- 2024-06-09 Listed $450,000 NAPLESMLS
- 2011-02-25 Sold (MLS) $175,250 NAPLESMLS
- 2011-01-12 Listed $174,900 NAPLESMLS
- 2010-11-03 Listing Removed — NAPLESMLS
- 2010-09-14 Listed $179,900 NAPLESMLS
- 2000-06-27 Sold (Public Records) $159,000 Public Records
- 1995-10-19 Sold (Public Records) $133,000 Public Records
Property tax history
+4.9%/yrLatest (2025): $3,447 · +1.6% YoY. Source: county tax records.
Cash-flow waterfall
monthlySold comps — $/sqft
last 12 mo · ≤1 miLoading sold comps…