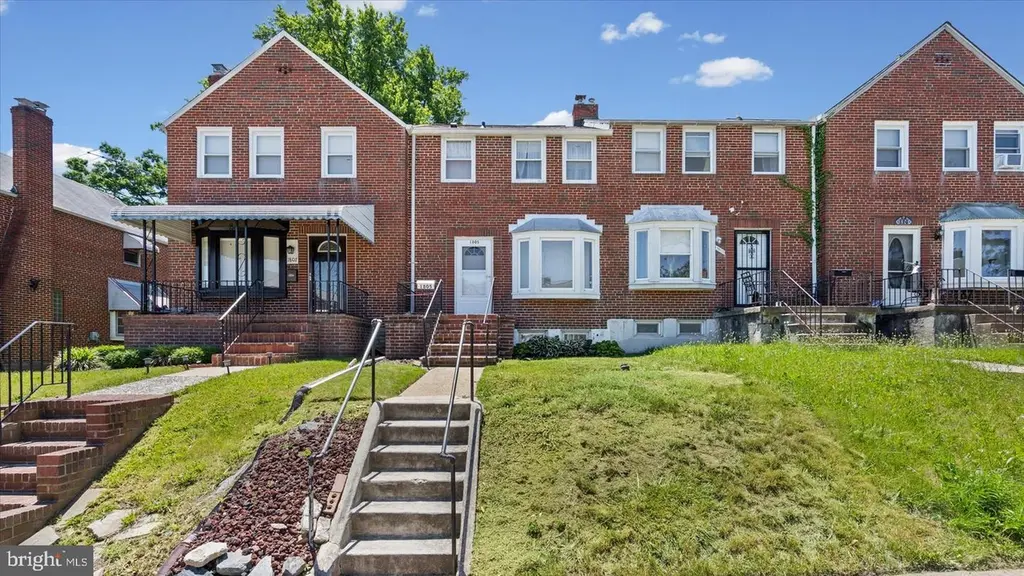
1805 Crestview Rd · Baltimore, MD
Flood risk 1/10 · Minimal
- FEMA flood zone
- X (unshaded)
- Chance of flooding over 30 yrs
- 0.0%
- Est. flood insurance / yr
- $473 – $860
Fire risk 1/10 · Minimal
- Est. fire insurance / yr
- $755 – $1,403
Heat risk 7/10 · Major
- Hot days now (above 103°F)
- 7 days/yr
- Hot days in 30 yrs
- 15 days/yr
Wind risk 6/10 · Moderate
- Chance of severe wind over 30 yrs
- 27.0%
Air-quality risk 4/10 · Minor
- Unhealthy air days now
- 3 days/yr
- Unhealthy air days in 30 yrs
- 6 days/yr
Risk factors via First Street. Map © Google.
Why this score? — see what drove the D+ grade
The composite is a weighted blend of 9 inputs, each scored 0–100. Each bar is that input's sub-score; the figure is the points it added to the 100-point composite (weight × sub-score).
- Cash flow +15.8/30.0
- ARV discount +12.5/15.0
- DSCR +4.9/10.0
- 1% rule +4.3/10.0
- Livability +3.8/5.0
- Rent growth +3.2/5.0
- Condition / age +2.5/5.0
- Schools +1.0/10.0
- Appreciation +0.0/10.0
$195,000
🖨 Deal sheet (PDF) 📄 Offer letter ✓ Due diligence
Listing remarks
Welcome to this charming 3-bedroom, 1.5-bath home located in the highly desirable Loch Raven neighborhood. Filled with character and potential, this property is the perfect opportunity for a first-time homebuyer looking to build equity, a homeowner eager to customize a space to their own taste, or an investor seeking to add a promising property to their portfolio. NEW ROOF March 2026 Inside, you’ll find hardwood floors throughout, abundant natural sunlight, and a functional layout ready for your personal touches. The lower level features a basement with exterior access, offering additional storage, workspace, or future living space possibilities. Step outside to enjoy the gorgeous bac
Key facts
- New roof
- Hardwood floors
- Gorgeous backyard
Tags
Property features AI
Finance
- Other: Total below-grade area estimated at 579; Above-grade finished area estimated at 956; Below-grade finished area estimated at 288 and unfinished 291; Land assessed value listed; Improvement assessed value listed
- Financial info: Ground rent $96 paid semi-annually; Annual ground rent listed in income/expense items
Exterior
- Parking: On-street parking
- Utilities: Public water; Public sewer
- Home design: Interior townhouse/rowhouse design; Year built per assessor
- Construction: Brick exterior; Foundation: Other
- Exterior features: Brick construction; Interior townhouse/rowhouse; Above-grade and below-grade structures; Ground rent applies (semi-annual payment)
Interior
- Bedrooms: Three bedrooms on the upper level
- Bathrooms: One full bathroom; One half bathroom
- Heating & cooling: Baseboard electric heating; Ceiling fans for cooling; Electric hot water; Oil heating fuel
- Interior features: Estimated living area; Basement with outside/rear entrance; Partially finished basement; Basement includes sump pump and shelving; Grab bars installed (accessibility)
Neighborhood map
What this means for you Summary
Snapshot
- This is a 3-bed/1.0-bath townhouse listed at $195k.
Deal economics
- At list price, monthly cash flow is $89 ($1k/yr) — positive.
- The deal already cash-flows at list — no discount required.
- To meet the 1% rule (rent ≥ 1% of price), the offer needs to be $182k (6.7% below list).
- Recommended offer: $182k (6.7% below list) — sets the bar for 1% rule.
Location & tenants
- Location reads 76/100 on livability (#90 in MD, #3,396 nationally) — a middle-class / working-renter tenant base. Strengths: amenities A+, commute A+, housing A+; Watch: crime F.
- Baltimore City Public Schools (urban): math 7% / reading 16% proficiency, ranked #24 of 24 in MD (top 100%) — low school quality limits family demand, transient renter base, plan for 1-2y turnover; 79% free/reduced lunch — lower-income household profile, screen leases tightly.
- Zoned schools: Elmer A. Henderson: A Johns Hopkins Partnership (math 2% / reading 16%, grade F, #650 of 860 statewide, top 77%, 642 students, 80% FRL); Vanguard Collegiate Middle (math 3% / reading 15%, grade F, #212 of 225 statewide, top 95%, 343 students, 84% FRL); Baltimore Polytechnic Institute (math 71% / reading 84%, grade A-, #22 of 222 statewide, top 10%, 1,555 students, 43% FRL).
- Zoned-school proficiency averages 32% at this address vs 12% district-wide (+20 pts) — the actual schools serving this property are materially stronger than the Baltimore City Public Schools average implies; a family-tenant draw the district grade alone would hide.
- Market conditions: Rents rising (+2.9%/yr); 72 active listings in the ZIP; 40 comparable units currently listed for rent nearby; rentals at typical pace (median 26d on market — plan ~3-4 weeks tenant-placement turnaround); 45% of comp listings sitting > 30 days — soft ceiling on asking rent; 1,273 units permitted in Baltimore city in 2024 (1,104 in 5+ unit buildings).
- This rent runs 35% of the median local income ($63k/yr) — at the standard rent-burdened threshold; future hikes will face affordability resistance.
Forward outlook
- Local home prices are declining (-3.0%/yr); year-one equity from $1k of loan paydown is wiped out by about $6k of value loss. Plan a longer hold.
- Baltimore County population projected to shrink 4% by 2050 — rents likely to lag national; underwrite the cash flow, not the appreciation.
Negotiation context
- It's been on market 16 days — a 2% lower offer ($192k) is reasonable based on typical stale-listing flexibility.
- Current owner paid $22k; list at $195k implies a 786% gain — meaningful room to come down on a strong offer.
Risks & watch-outs
- Watch-outs: built in 1950 — expect roof / HVAC / electrical / plumbing capex.
- Climate carrying-cost: major wind risk, 27% chance of damaging wind over 30y; extreme-heat days projected 7→15/yr by 2055 (HVAC capex compounding) — expect insurance premiums to compound above CPI over the hold.
Questions for the listing agent
- Built in 1950 — when were the roof, HVAC, electrical panel, plumbing, and water heater last replaced?
- Is there a deadline driving the sale (1031 exchange, divorce, estate, relocation)? That informs how much negotiation room exists.
- Schools are D-rated, which usually means shorter tenancies and higher turnover. Who's the typical renter profile here, and what's been the actual vacancy rate?
- Crime grade is F in this area — have there been break-ins, vandalism, or insurance claims at this property in the last 3 years? What carrier currently insures it and at what premium?
- The area grade is low — what's the realistic commute time and amenity access for the typical tenant pool here? Any planned neighborhood developments (good or bad) we should know about?
- What's the average days-on-market for RENTAL listings here right now (not sales)? A rising rental-DOM trend means longer vacancies and softer asking-rent achievability than the comps imply.
- What's the recent tenant-quality profile in this submarket — average credit score on applications, eviction rate, late-payment / NSF rate, and stable-employment percentage? A property-management company in the area should have these aggregated.
- How much new for-sale + rental construction is in the pipeline within 1–3 miles? Heavy new supply typically softens prices + rents 12–24 months out; constrained supply supports both.
Investment metrics
- 1% rule
- 0.93% ✗
- Cap rate
- 6.84%
- Cash-on-cash
- 1.96%
- DSCR
- 1.09
- GRM
- 8.9
CMA / ARV
- ARV (on-the-fly)
- $219,240
- Comps found
- 12
Show comp detail 12 sales within ~0.75 mi
| Address | Dist | Beds/Ba | Sqft | Sold | Price | $/sf | Match |
|---|---|---|---|---|---|---|---|
| 1649 Gleneagle Rd | 0.23mi | 3/1.0 | 1,064 (-2%) | 9mo | $200,000 | $188 | 79 |
| 1720 Wadsworth Way | 0.20mi | 3/1.0 | 1,064 (-2%) | 11mo | $160,100 | $150 | 78 |
| 1930 Swansea Rd | 0.15mi | 3/2.0 | 1,178 (+9%) | 10mo | $285,000 | $242 | 66 |
| 5749 Edgepark Rd | 0.25mi | 3/1.5 | 1,140 (+6%) | 15mo | $190,000 | $167 | 64 |
| 2046 E Belvedere Ave | 0.24mi | 4/2.0 (+1) | 1,140 (+6%) | 9mo | $289,000 | $254 | 63 |
| 2210 Cloville Ave NE | 0.59mi | 3/1.5 | 1,024 (-5%) | 3mo | $226,650 | $221 | 59 |
| 1703 Swansea Rd | 0.12mi | 2/2.0 (-1) | 1,190 (+10%) | 12mo | $170,000 | $143 | 59 |
| 6331 Pioneer Dr | 0.65mi | 3/1.5 | 1,050 (-3%) | 6mo | $185,000 | $176 | 58 |
| 5102 Hillen Rd | 0.54mi | 3/2.0 | 1,008 (-7%) | 7mo | $149,900 | $149 | 54 |
| 1534 Wadsworth Way | 0.48mi | 4/2.0 (+1) | 1,216 (+13%) | 7mo | $282,000 | $232 | 42 |
| 5603 Purdue Ave | 0.70mi | 3/2.0 | 1,160 (+7%) | 12mo | $236,000 | $203 | 42 |
| 1607 Stonewood Rd | 0.73mi | 3/2.0 | 1,216 (+13%) | 1mo | $273,000 | $225 | 40 |
Match score weights: distance 35% · size 25% · config 20% · recency 20%. Top-matched comps best support the ARV.
Projected returns pro-forma
-3.0% appreciation · 2.86% rent growth · sell at horizon
- IRR
- -13.3%
- Equity multiple
- 0.52×
- Total profit
- $-26,139
- Equity at exit
- $29,075
- IRR
- -4.6%
- Equity multiple
- 0.70×
- Total profit
- $-16,373
- Equity at exit
- $16,860
Cash invested: $54,600 (down + closing). Projections, not guarantees.
Landlord ↔ Tenant lean methodology
- Overall (CITY)
- 12 Strongly Tenant-Friendly
- State Maryland
- 27 Tenant-Leaning · D+14
- County
- — inherits STATE
- City Baltimore
- 12 Strongly Tenant-Friendly · D+58
ZIP-level market 21239
- Rents YoY
- 2.9%
- Active inventory
- 72
- Price-to-rent
- 8.9×
Monthly cashflow live
- Estimated rent
- $1,819 high interval (Pro) →
- Mortgage (P&I)
- −$1,023
- Tax est. 1.5%
- −$244 /mo · $2,925/yr
- Insurance
- −$81
- HOA
- −$0
- Vacancy / Maint / Mgmt
- −$382
- Net cashflow
- $89
Break-even live
Sensitivity live
| Price | -10% $224 | -5% $157 | +0% $89 | +5% $22 | +10% $-45 |
|---|---|---|---|---|---|
| Rent | -10% $-54 | -5% $17 | +0% $89 | +5% $161 | +10% $233 |
| Rate | -1.0pp $188 | -0.5pp $139 | base $89 | +0.5pp $39 | +1.0pp $-13 |
UW: 25.0% down · 7.5% · 30yr · 1.5% tax · 5.0% vac · 8.0% maint · 8.0% mgmt
Financing live
Cash to close
- Down payment
- $48,750
- Closing costs
- $5,850
- Reserves months
- —
- Total cash needed
- —
Loan-product check · same deal, 3 products live
Conventional
25% down · 7.5% · 30yr
- Down + closing
- —
- Monthly P&I
- —
- Monthly cashflow
- —
- DSCR
- —
- Eligible?
- —
Personal DTI + credit; lowest rate.
DSCR
20% down · 8.5% · 30yr
- Down + closing
- —
- Monthly P&I
- —
- Monthly cashflow
- —
- DSCR
- —
- Eligible?
- —
No personal income docs; deal must DSCR.
Hard money
10% down · 12.0% · 12mo
- Down + closing
- —
- Monthly P&I
- —
- Monthly cashflow
- —
- DSCR
- —
- Eligible?
- —
Short-term bridge; refi at stabilization.
Rent comps 40 comps
| Address | Beds | Baths | Sqft | Rent | $/sqft | DOM | Units | Dist |
|---|---|---|---|---|---|---|---|---|
| 1900 Ramblewood Rd Apt A Baltimore, MD | 2.0 | 2.0 | 903 | $1,847 | $2.05 | 45d | 1 | 0.06mi |
| 1726 E Belvedere Ave Baltimore, MD | 3.0 | 2.0 | 1140 | $1,895 | $1.66 | 23d | 1 | 0.07mi |
| 1908 E Belvedere Ave Baltimore, MD | 4.0 | 2.0 | 1425 | $1,950 | $1.37 | 21d | 1 | 0.08mi |
| 1806 Ramblewood Rd Apt A Baltimore, MD | 2.0 | 2.0 | 903 | $1,847 | $2.05 | 45d | 1 | 0.19mi |
| 2077 Woodbourne Ave Baltimore, MD | 1.0–2.0 | 1.0 | 830 | $1,419 | $1.71 | 3d | 5 | 0.30mi |
| 2106 Cloville Ave Baltimore, MD | 3.0 | 1.5 | 1080 | $1,700 | $1.57 | 45d | 1 | 0.53mi |
| 4902 Gilray Dr Baltimore, MD | 3.0 | 2.0 | 776 | $2,400 | $3.09 | 25d | 1 | 0.59mi |
| 1712 Waverly Way Baltimore, MD | 1.0–2.0 | 1.0 | 675 | $1,520 | $2.25 | 0d | 4 | 0.60mi |
| 5664 Woodmont Ave Baltimore, MD | 1.0–2.0 | 1.0 | 710 | $1,165 | $1.64 | 0d | 8 | 0.63mi |
| 5307 Leith Rd Baltimore, MD | 2.0 | 1.0 | 630 | $1,350 | $2.14 | 14d | 1 | 0.63mi |
| 6624 Pioneer Dr Baltimore, MD | 1.0–3.0 | 1.0 | 706 | $1,647 | $2.33 | 45d | 1 | 0.74mi |
| 6101 Loch Raven Blvd Baltimore, MD | 1.0–2.0 | 1.0–2.0 | 1138 | $2,378 | $2.09 | 0d | 8 | 0.78mi |
| 1575 Stonewood Rd Baltimore, MD | 3.0 | 1.5 | 1216 | $2,200 | $1.81 | 0d | 1 | 0.78mi |
| 5600 Birchwood Ave Unit 2 Baltimore, MD | 2.0 | 1.0 | 850 | $1,600 | $1.88 | 45d | 1 | 0.80mi |
| 6212 Laurelton Ave Baltimore, MD | 2.0 | 1.0 | 960 | $1,325 | $1.38 | 45d | 1 | 0.81mi |
| 2604 Hamilton Ave Apt 2 Baltimore, MD | 2.0 | 1.0 | 850 | $1,195 | $1.41 | 45d | 1 | 0.84mi |
| 1408 Cedarcroft Rd Baltimore, MD | 3.0 | 2.0 | 912 | $1,957 | $2.15 | 45d | 1 | 0.85mi |
| 6502 McClean Blvd Unit 2211-B3 Baltimore, MD | 2.0 | 1.0 | 925 | $1,495 | $1.62 | 23d | 1 | 0.85mi |
| 1129 Gleneagle Rd Unit B Baltimore, MD | 2.0 | 1.0 | 700 | $1,200 | $1.71 | 45d | 1 | 0.89mi |
| 1652 E Cold Spring Ln Unit 2 Baltimore, MD | 2.0 | 1.0 | 700 | $1,500 | $2.14 | 25d | 1 | 0.89mi |
| 6502 McClean Blvd Baltimore, MD | 2.0 | 1.0 | 925 | $1,537 | $1.66 | 45d | 1 | 0.90mi |
| 2805 Hamilton Ave Baltimore, MD | 4.0 | 2.0 | 1416 | $2,300 | $1.62 | 45d | 1 | 0.92mi |
| 1111 Gleneagle Rd Unit 2 Baltimore, MD | 2.0 | 1.0 | 1452 | $1,050 | $0.72 | 45d | 1 | 0.93mi |
| 1116 Gleneagle Rd Unit 1 Baltimore, MD | 2.0 | 1.0 | 726 | $1,695 | $2.33 | 6d | 1 | 0.93mi |
| 1116 Gleneagle Rd Unit 2 Baltimore, MD | 2.0 | 1.0 | 726 | $1,750 | $2.41 | 25d | 1 | 0.93mi |
| 1116 Gleneagle Rd Unit 2 Baltimore, MD | 2.0 | 1.0 | 876 | $1,750 | $2.00 | 45d | 1 | 0.93mi |
| 1090 Cameron Rd Baltimore, MD | 2.0 | 1.0 | 832 | $1,675 | $2.01 | 5d | 1 | 0.94mi |
| 2807 Shirey Ave Baltimore, MD | 4.0 | 3.0 | 1190 | $2,500 | $2.10 | 16d | 1 | 0.95mi |
| 1106 Gleneagle Rd Unit 2 Baltimore, MD | 2.0 | 1.0 | 1100 | $1,450 | $1.32 | 45d | 1 | 0.95mi |
| 2900 Ailsa Ave Apt 2 Baltimore, MD | 3.0 | 1.0 | 1300 | $1,750 | $1.35 | 6d | 1 | 0.98mi |
| 1545 E Cold Spring Ln Baltimore, MD | 4.0 | 2.0 | 1240 | $2,000 | $1.61 | 45d | 1 | 0.99mi |
| 6405 Loch Crest Rd Idlewylde, MD | 3.0 | 2.5 | 1440 | $2,257 | $1.57 | 45d | 1 | 1.00mi |
| 1221 Glenwood Ave Baltimore, MD | 3.0 | 2.0 | 1390 | $2,595 | $1.87 | 45d | 1 | 1.02mi |
| 2804 Christopher Ave Baltimore, MD | 3.0 | 2.5 | 1280 | $2,200 | $1.72 | 25d | 1 | 1.04mi |
| 1275 Kitmore Rd Unit 1267K-T Baltimore, MD | 2.0 | 1.0 | 827 | $1,585 | $1.92 | 45d | 1 | 1.05mi |
| 1275 Kitmore Rd Unit 1248B-A Baltimore, MD | 2.0 | 1.0 | 812 | $1,360 | $1.67 | 6d | 1 | 1.05mi |
| 1275 Kitmore Rd Unit 1262B-A Baltimore, MD | 2.0 | 1.0 | 923 | $1,320 | $1.43 | 3d | 1 | 1.05mi |
| 1275 Kitmore Rd Unit 1260K-T Baltimore, MD | 2.0 | 1.0 | 811 | $1,410 | $1.74 | 6d | 1 | 1.05mi |
| 1275 Kitmore Rd Unit 1215B-T Baltimore, MD | 2.0 | 1.0 | 811 | $1,435 | $1.77 | 6d | 1 | 1.05mi |
| 1275 Kitmore Rd Unit 1245K-T Baltimore, MD | 3.0 | 1.0 | 935 | $1,895 | $2.03 | 6d | 1 | 1.05mi |
Listing history 10 events
-
2026-06-21days on market $195,000 Active 16 DOM
-
2026-06-18days on market $195,000 Active 13 DOM
-
2026-06-17days on market $195,000 Active 12 DOM
-
2026-06-16days on market $195,000 Active 11 DOM
-
2026-06-15days on market $195,000 Active 10 DOM
-
2026-06-13days on market $195,000 Active 8 DOM
-
2026-06-09days on market $195,000 Active 4 DOM
-
2026-06-08days on market $195,000 Active 3 DOM
-
2026-06-07remarks 693-char remark
-
2026-06-07$195,000 Active 2 DOM
ⓘ Source: listings_history table (triggers on properties + properties_extension) + one-shot
backfill from property_details.listing_events for pre-trigger history.
Climate risk First Street
- Flood 1/10 Low FEMA zone X (unshaded) · 0% chance over 30 yrs
- Wildfire 1/10 Low
- Heat 7/10 Severe 7 d/yr ≥103°F today · 15 d/yr by 30 yrs out
- Wind 6/10 Major 27% chance of damaging wind over 30 yrs
- Air quality 4/10 Moderate 3 unhealthy d/yr today · 6 by 30 yrs out
Nearby sold comps map
Loading sold comps map…
Walkable amenities ~0.75 mi
Loading nearby amenities…
Taxation est. · year 1
- Rental income
- $21,826
- − Mortgage interest
- −$10,923
- − Property taxes
- −$2,925
- − Insurance
- −$975
- − Repairs & maintenance
- −$1,746
- − Management
- −$1,746
- − Depreciation
- −$5,673
- Taxable loss
- −$2,162
- Est. tax savings @ 24.0%
- +$519
- After-tax cash flow
- $1,590/yr
For passive investors: Depreciation is non-cash, so a rental often shows a tax loss while cash-flowing — sheltering income. Rental losses are passive: they offset passive income freely, and up to $25,000/yr can offset ordinary (W-2) income if you actively participate and your MAGI is under $100k (phasing out to $0 by $150k); unused losses carry forward. On sale, claimed depreciation is recaptured at up to 25%, and gains may owe capital-gains tax (a 1031 exchange can defer both). Figures are a year-1 estimate at your 24.0% rate — not tax advice; consult a CPA.
Schools (NCES district)
- District
- Baltimore City Public Schools
- NCES district ID
- 2400090
- Math proficiency
- 7% ▼ -9.00%
- Reading proficiency
- 16% ▼ -5.00%
- Median HH income
- $42,108
- Composite
- 10.08/100
- National rank
- #9805
- State rank
- #24 of 24 in MD
Livability — Baltimore
- Score
- 76/100
- State rank
- #90
- US rank
- #3396
Category grades
Schools grade is shown separately in the Schools card above.
Census & demographics
- Census place
- Baltimore, MD
- County
- Baltimore City · 558,601 people
- City population
- 588,727
- Metro
- Baltimore-Columbia-Towson, MD
- Population (ZIP)
- 27,346
- Household income
- $62,650
- Rent vs Own
- Severe rent burden
- 1103.0
Population outlook (Baltimore County) Hauer SSP2
- Today (2025)
- 624,249 people
- By 2030
- 621,541 · -0.4%
- By 2040
- 609,756 · -2.3%
- By 2050
- 597,249 · -4.3%
- By 2075
- 552,236 · -11.5%
- By 2100
- 513,934 · -17.7%
Race, ethnicity, and origin ACS 2023
- Neighborhood character
- Predominantly Black (76%)
- Race & ethnicity
- Black 76% White 12% Asian 4% Hispanic / Latino 4% Two or more races 4%
- Common ancestry
- Lithuanian 1% Romanian 1% Russian 1%
- Foreign-born
- 10% · Canada, United Kingdom, China
- Languages at home
- 88% English-only · Other Indo-European 3% Spanish 2% French/Haitian/Cajun 2%
Political lean MEDSL · Baltimore
- 2024 margin
- Solid D (+73.0) · D 85.2% · R 12.2% · Other 2.6%
- 2008→2024 swing
- -2.5pp toward R · 2008: 75.5pp · 2024: 73.0pp
- All cycles
- 2024: D+73.0 2020: D+76.6 2016: D+74.6 2012: D+76.4 2008: D+75.5
Not yet ingested
- Civics
- —
Market trends
- HPI YoY
- ▼ -164.48%
- Current HPI
- 258.094
- Rent YoY
- ▲ 2.86%
- Metro
- Baltimore-Columbia-Towson, MD
- State GDP YoY
- ▲ 2.97%
- F500 in state
- 12
Industry mix (Fortune 500 HQ in MD)
| Industry | F500 HQs | Revenue |
|---|---|---|
| Aerospace / Defense | 1 | $71B |
|
||
| Utilities | 1 | $25B |
|
||
| Hotels | 1 | $24B |
|
||
| Consumer Goods | 1 | $7B |
|
||
| Real Estate | 1 | $6B |
|
||
| Chemicals | 1 | $2B |
|
||
Price history
+786.4% since first listed2 events — show timeline
- 2026-06-05 Listed $195,000 BRIGHT MLS
- 2019-02-21 Sold (Public Records) $22,000 Public Records
Property tax history
-68.0%/yrLatest (2021): $0 · -100.0% YoY. Source: county tax records.
Cash-flow waterfall
monthlySold comps — $/sqft
last 12 mo · ≤1 miLoading sold comps…