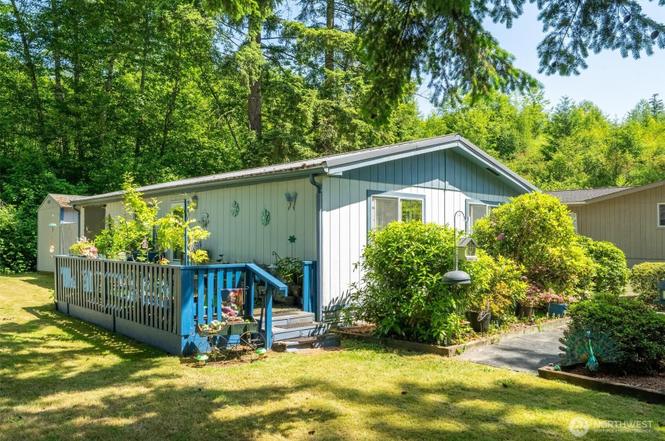
17340 Sargent Rd SW #47 · Rochester, WA
Flood risk 5/10 · Moderate
- FEMA flood zone
- X (unshaded)
- Chance of flooding over 30 yrs
- 0.53%
- Est. flood insurance / yr
- $507 – $1,088
Fire risk 4/10 · Minor
- Est. fire insurance / yr
- $604 – $1,122
Heat risk 2/10 · Minimal
- Hot days now (above 89°F)
- 7 days/yr
- Hot days in 30 yrs
- 14 days/yr
Wind risk 1/10 · Minimal
- Chance of severe wind over 30 yrs
- —
Air-quality risk 6/10 · Moderate
- Unhealthy air days now
- 8 days/yr
- Unhealthy air days in 30 yrs
- 8 days/yr
Risk factors via First Street. Map © Google.
Why this score? — see what drove the C+ grade
The composite is a weighted blend of 9 inputs, each scored 0–100. Each bar is that input's sub-score; the figure is the points it added to the 100-point composite (weight × sub-score).
- Cash flow +27.7/30.0
- DSCR +9.7/10.0
- ARV discount +7.5/15.0
- 1% rule +6.6/10.0
- Schools +4.9/10.0
- Livability +3.3/5.0
- Rent growth +2.5/5.0
- Condition / age +2.5/5.0
- Appreciation +0.0/10.0
$163,000
🖨 Deal sheet (PDF) 📄 Offer letter ✓ Due diligence
Listing remarks
Welcome to this spacious 2-bedroom, 1-bath double-wide manufactured home offering 960 sq. ft. of comfortable living space, plus a versatile den/office—perfect for working from home or guests. Located in a well-kept park, this home features cozy carpeting throughout, easy-care vinyl flooring in the kitchen, a forced air furnace for heating, and a covered one-car carport for convenient parking. Enjoy the patio and front porch for relaxing outdoors. Bonus storage includes an 8x8 unit off the carport and a separate 10x20 storage shed—ideal for tools, hobbies, or seasonal items. A great opportunity for affordable, functional living with extra space inside and out!
Key facts
- Covered carport
- Front porch
- Storage shed
Tags
Property features AI
Finance
- Other: Manufactured home built after 06/15/1976; Style: Manuf-Double Wide; Structure type: Manufactured house; Green feature: Double pane windows
- Financial info: Listing terms: Cash or Conventional
- HOA & community: Located in Whispering Woods park (park approved for sale); Park amenities include common area; Approximately 72 homes in the park; Pets allowed (see remarks); Monthly land lease
Exterior
- Parking: Carport
- Utilities: Community water; Community septic (park maintained); PSE power; Comcast/Xfinity cable and internet
- Home design: Manufactured home (double wide); One level; Model: 1987 Moduline/Ardmore 40/24; Make: Moduline; Average condition; Skirted with metal
- Construction: Wood construction; Metal roof; Tie-down foundation
- Exterior features: Wood exterior; Patio/porch/deck; Paved lot; Has view
Interior
- Kitchen: Dishwasher; Refrigerator; Stove/Range; Kitchen with eating space
- Bedrooms: 2 bedrooms
- Flooring: Vinyl; Carpet
- Bathrooms: 1 full bathroom
- Heating & cooling: Forced air heating; Electric energy source
- Interior features: Water heater (electric) located in bedroom closet; Skylights; Vaulted ceilings; Double pane windows
- Laundry & utility: Utility room
Neighborhood map
What this means for you Summary
Snapshot
- This is a 2-bed/1.0-bath manufactured listed at $163k.
Deal economics
- At list price, monthly cash flow is $491 ($6k/yr) — positive.
- The deal already cash-flows at list — no discount required.
- Meets the 1% rule at list price ($2k rent vs $163k).
- Recommended offer: $148k (9.0% below list) — sets the bar for market timing.
- Cap rate 9.9% vs local median 2.1% in Rochester — top-decile yield for the area; either an underpriced asset or a hidden risk that comps aren't pricing in. Stress-test before assuming the spread holds.
Location & tenants
- Location reads 66/100 on livability (#327 in WA) — a middle-class / working-renter tenant base. Strengths: employment A+, housing A+, crime B; Watch: health & safety C-, amenities F, commute F.
- Rochester School District (rural): math 53% / reading 57% proficiency, ranked #97 of 291 in WA (top 33%) — acceptable for families but not a draw, mixed tenant base, ~2y average lease.
- Market conditions: 108 active listings in the ZIP; 1,222 units permitted in Thurston County in 2024 (508 in 5+ unit buildings).
Forward outlook
- Local home prices are declining (-3.0%/yr); year-one equity from $1k of loan paydown is wiped out by about $5k of value loss. Plan a longer hold.
- Thurston County population projected at +27% by 2050 — long-run rental-demand tailwind backs the buy-and-hold thesis.
- At projected returns (-3.0% appreciation + 3.0% rent growth), your $46k cash investment doubles in ~9 years — after that, you're playing with house money.
Negotiation context
- It's been on market 112 days — a 9% lower offer ($148k) is reasonable based on typical stale-listing flexibility.
Risks & watch-outs
- Climate carrying-cost: moderate flood risk — expect insurance premiums to compound above CPI over the hold.
Questions for the listing agent
- It's been on market 112 days. Have you received any prior offers? Is the seller open to a 9% concession, seller financing, or rate buy-down credit?
- Why hasn't it sold? Are there any deal-killer items the seller is aware of (foundation, flood, title, zoning, code violations)?
- Is there a deadline driving the sale (1031 exchange, divorce, estate, relocation)? That informs how much negotiation room exists.
- What's the average days-on-market for RENTAL listings here right now (not sales)? A rising rental-DOM trend means longer vacancies and softer asking-rent achievability than the comps imply.
- What's the recent tenant-quality profile in this submarket — average credit score on applications, eviction rate, late-payment / NSF rate, and stable-employment percentage? A property-management company in the area should have these aggregated.
- How much new for-sale + rental construction is in the pipeline within 1–3 miles? Heavy new supply typically softens prices + rents 12–24 months out; constrained supply supports both.
Investment metrics
- 1% rule
- 1.16% ✓
- Cap rate
- 9.91%
- Cash-on-cash
- 12.91%
- DSCR
- 1.57
- GRM
- 7.2
CMA / ARV
- ARV (on-the-fly)
- $100,800
- Comps found
- 4
Show comp detail 4 sales within ~0.75 mi
| Address | Dist | Beds/Ba | Sqft | Sold | Price | $/sf | Match |
|---|---|---|---|---|---|---|---|
| 17340 Sargent Rd SW #66 | 0.16mi | 2/2.0 | 932 (-3%) | 1mo | $82,000 | $88 | 83 |
| 17340 Sargent Rd SW #57 | 0.06mi | 2/1.0 | 924 (-4%) | 12mo | $92,500 | $100 | 81 |
| 7608 SW Scatter View Ln | 0.32mi | 2/1.0 | 840 (-12%) | 15mo | $335,000 | $399 | 52 |
| 18042 Sargent Rd SW #4 | 0.70mi | 2/1.0 | 910 (-5%) | 13mo | $96,000 | $105 | 48 |
Match score weights: distance 35% · size 25% · config 20% · recency 20%. Top-matched comps best support the ARV.
Projected returns pro-forma
-3.0% appreciation · 3.0% rent growth · sell at horizon
- IRR
- 2.7%
- Equity multiple
- 1.11×
- Total profit
- $4,816
- Equity at exit
- $24,304
- IRR
- 12.3%
- Equity multiple
- 1.97×
- Total profit
- $44,264
- Equity at exit
- $14,093
Cash invested: $45,640 (down + closing). Projections, not guarantees.
Landlord ↔ Tenant lean methodology
- Overall (STATE)
- 28 Tenant-Leaning
- State Washington
- 28 Tenant-Leaning · D+8
- County
- — inherits STATE
- City
- — inherits STATE
ZIP-level market 98579
- Home prices YoY
- -34.1%
- Active inventory
- 108
- Price-to-rent
- 7.2×
Monthly cashflow live
- Estimated rent
- $1,883 medium interval (Pro) →
- Mortgage (P&I)
- −$855
- Tax from tax record
- −$74 /mo · $882/yr
- Insurance
- −$68
- HOA
- −$0
- Vacancy / Maint / Mgmt
- −$395
- Net cashflow
- $491
Break-even live
Sensitivity live
| Price | -10% $583 | -5% $537 | +0% $491 | +5% $445 | +10% $399 |
|---|---|---|---|---|---|
| Rent | -10% $342 | -5% $417 | +0% $491 | +5% $566 | +10% $640 |
| Rate | -1.0pp $573 | -0.5pp $533 | base $491 | +0.5pp $449 | +1.0pp $406 |
UW: 25.0% down · 7.5% · 30yr · 1.5% tax · 5.0% vac · 8.0% maint · 8.0% mgmt
Financing live
Cash to close
- Down payment
- $40,750
- Closing costs
- $4,890
- Reserves months
- —
- Total cash needed
- —
Loan-product check · same deal, 3 products live
Conventional
25% down · 7.5% · 30yr
- Down + closing
- —
- Monthly P&I
- —
- Monthly cashflow
- —
- DSCR
- —
- Eligible?
- —
Personal DTI + credit; lowest rate.
DSCR
20% down · 8.5% · 30yr
- Down + closing
- —
- Monthly P&I
- —
- Monthly cashflow
- —
- DSCR
- —
- Eligible?
- —
No personal income docs; deal must DSCR.
Hard money
10% down · 12.0% · 12mo
- Down + closing
- —
- Monthly P&I
- —
- Monthly cashflow
- —
- DSCR
- —
- Eligible?
- —
Short-term bridge; refi at stabilization.
Listing history 18 events
-
2026-06-21days on market $163,000 Active 112 DOM
-
2026-06-18days on market $163,000 Active 109 DOM
-
2026-06-17days on market $163,000 Active 108 DOM
-
2026-06-16days on market $163,000 Active 107 DOM
-
2026-06-15days on market $163,000 Active 106 DOM
-
2026-06-14days on market $163,000 Active 104 DOM
-
2026-06-13days on market $163,000 Active 103 DOM
-
2026-06-10days on market $163,000 Active 101 DOM
-
2026-06-09days on market $163,000 Active 100 DOM
-
2026-06-08days on market $163,000 Active 99 DOM
-
2026-06-07days on market $163,000 Active 98 DOM
-
2026-06-05days on market $163,000 Active 95 DOM
-
2026-06-02days on market $163,000 Active 93 DOM
-
2026-06-01days on market $163,000 Active 92 DOM
-
2026-05-31days on market $163,000 Active 91 DOM
-
2026-05-30days on market $163,000 Active 90 DOM
-
2026-05-20price $163,000
-
2026-03-01$169,000 Active
ⓘ Source: listings_history table (triggers on properties + properties_extension) + one-shot
backfill from property_details.listing_events for pre-trigger history.
Tax reassessment forecast WA · Resets to sale price
- Current annual tax
- $882 · $74/mo
- Projected year-2 tax
- $1,597 · $133/mo
- Expected delta
- +$715/yr (+$60/mo · 81.0%)
ⓘ Screening estimate from a state-policy table — verify with the county assessor before closing.
Climate risk First Street
- Flood 5/10 Major FEMA zone X (unshaded) · 53% chance over 30 yrs
- Wildfire 4/10 Moderate
- Heat 2/10 Low 7 d/yr ≥89°F today · 14 d/yr by 30 yrs out
- Wind 1/10 Low
- Air quality 6/10 Major 8 unhealthy d/yr today · 8 by 30 yrs out
Nearby sold comps map
Loading sold comps map…
Walkable amenities ~0.75 mi
Loading nearby amenities…
Taxation est. · year 1
- Rental income
- $22,593
- − Mortgage interest
- −$9,131
- − Property taxes
- −$882
- − Insurance
- −$815
- − Repairs & maintenance
- −$1,807
- − Management
- −$1,807
- − Depreciation
- −$4,742
- Taxable income
- $3,408
- Est. tax owed @ 24.0%
- −$818
- After-tax cash flow
- $5,076/yr
For passive investors: Depreciation is non-cash, so a rental often shows a tax loss while cash-flowing — sheltering income. Rental losses are passive: they offset passive income freely, and up to $25,000/yr can offset ordinary (W-2) income if you actively participate and your MAGI is under $100k (phasing out to $0 by $150k); unused losses carry forward. On sale, claimed depreciation is recaptured at up to 25%, and gains may owe capital-gains tax (a 1031 exchange can defer both). Figures are a year-1 estimate at your 24.0% rate — not tax advice; consult a CPA.
Schools (NCES district)
- District
- Rochester School District
- NCES district ID
- 5307470
- Math proficiency
- 53% ▲ 5.00%
- Reading proficiency
- 57% ▲ 1.00%
- Median HH income
- $56,231
- Composite
- 49.33/100
- National rank
- #4348
- State rank
- #97 of 291 in WA
Livability — Rochester
- Score
- 66/100
- State rank
- #327
- US rank
- #12271
Category grades
Schools grade is shown separately in the Schools card above.
Census & demographics
- Population (ZIP)
- 13,907
Population outlook (Thurston County) Hauer SSP2
- Today (2025)
- 308,239 people
- By 2030
- 326,483 · +5.9%
- By 2040
- 359,890 · +16.8%
- By 2050
- 391,800 · +27.1%
- By 2075
- 468,024 · +51.8%
- By 2100
- 519,890 · +68.7%
Race, ethnicity, and origin ACS 2023
- Neighborhood character
- Predominantly White (81%)
- Race & ethnicity
- White 81% Hispanic / Latino 10% Two or more races 10% Native American 1%
- Hispanic origin (detail)
- Mexican 9%
- Common ancestry
- Portuguese 4% Slovak 4% Italian 3%
- Foreign-born
- 5% · Canada
- Languages at home
- 93% English-only · Spanish 7%
Political lean MEDSL · Thurston
- 2024 margin
- Strong D (+20.4) · D 58.5% · R 38.1% · Other 3.5%
- 2008→2024 swing
- -1.3pp toward R · 2008: 21.7pp · 2024: 20.4pp
- All cycles
- 2024: D+20.4 2020: D+18.6 2016: D+15.4 2012: D+19.0 2008: D+21.7
Not yet ingested
- Civics
- —
Market trends
- HPI YoY
- ▼ -197.25%
- Current HPI
- 381.8969
- Rent YoY
- —
- Metro
- —
- State GDP YoY
- ▲ 4.65%
- F500 in state
- 22
Industry mix (Fortune 500 HQ in WA)
| Industry | F500 HQs | Revenue |
|---|---|---|
| Retail | 2 | $269B |
|
||
| Technology / Retail | 1 | $638B |
|
||
| Technology | 1 | $245B |
|
||
| Telecommunications | 1 | $38B |
|
||
| Food / Beverage | 1 | $36B |
|
||
| Automotive / Trucks | 1 | $34B |
|
||
Price history
-3.6% since first listed2 events — show timeline
- 2026-05-20 Price Changed $163,000 NWMLS as Distributed by MLS Grid
- 2026-03-01 Listed $169,000 NWMLS as Distributed by MLS Grid
Property tax history
+5.5%/yrLatest (2026): $882 · -3.1% YoY. Source: county tax records.
Cash-flow waterfall
monthlySold comps — $/sqft
last 12 mo · ≤1 miLoading sold comps…