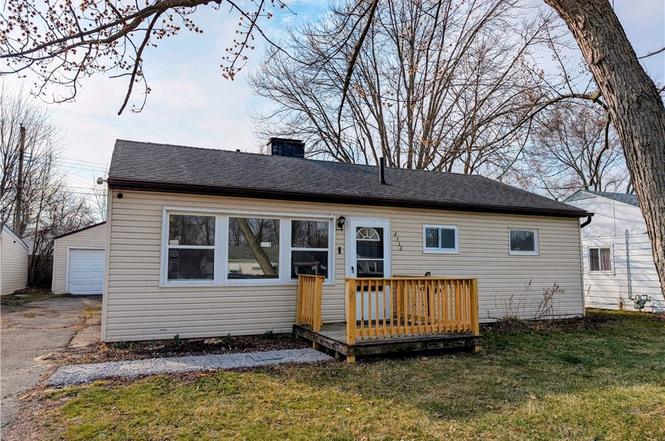
4510 Riverside Dr · Lorain, OH
Flood risk 1/10 · Minimal
- FEMA flood zone
- X (unshaded)
- Chance of flooding over 30 yrs
- 0.0%
- Est. flood insurance / yr
- $473 – $860
Fire risk 1/10 · Minimal
- Est. fire insurance / yr
- $713 – $1,323
Heat risk 3/10 · Minor
- Hot days now (above 99°F)
- 7 days/yr
- Hot days in 30 yrs
- 16 days/yr
Wind risk 1/10 · Minimal
- Chance of severe wind over 30 yrs
- —
Air-quality risk 3/10 · Minor
- Unhealthy air days now
- 2 days/yr
- Unhealthy air days in 30 yrs
- 4 days/yr
Risk factors via First Street. Map © Google.
Why this score? — see what drove the D+ grade
The composite is a weighted blend of 9 inputs, each scored 0–100. Each bar is that input's sub-score; the figure is the points it added to the 100-point composite (weight × sub-score).
- Cash flow +16.7/30.0
- ARV discount +10.8/15.0
- DSCR +5.2/10.0
- 1% rule +4.0/10.0
- Livability +3.4/5.0
- Rent growth +2.5/5.0
- Condition / age +2.5/5.0
- Schools +1.6/10.0
- Appreciation +0.0/10.0
$134,900
🖨 Deal sheet (PDF) 📄 Offer letter ✓ Due diligence
Listing remarks MLS
Bank Owned * 3 Bedroom Ranch With More Than 950 sq ft * Great Potential * Buyer Will Assume Any/All Expenses For Inspections *
Key facts
- Solid wood cabinetry
- Covered patio
- Updated countertops
Tags
Neighborhood map
What this means for you Summary
Snapshot
- This is a 3-bed/1.0-bath single-family listed at $135k.
Deal economics
- At list price, monthly cash flow is $85 ($1k/yr) — positive.
- The deal already cash-flows at list — no discount required.
- To meet the 1% rule (rent ≥ 1% of price), the offer needs to be $121k (10.2% below list).
- Recommended offer: $121k (10.2% below list) — sets the bar for 1% rule.
- Cap rate 7.0% vs local median 5.7% in Lorain — meaningfully above typical; check what's discounted (condition, days-on-market, listing class) to confirm the premium yield is real.
Location & tenants
- Location reads 67/100 on livability (#595 in OH) — a middle-class / working-renter tenant base. Strengths: cost of living A+, housing A+; Watch: amenities D, health & safety D, crime F.
- Lorain City (suburban): math 13% / reading 26% proficiency, ranked #633 of 656 in OH (top 96%) — low school quality limits family demand, transient renter base, plan for 1-2y turnover; 80% free/reduced lunch — lower-income household profile, screen leases tightly.
- Zoned schools: New Beginnings (reading 24%, 120 students, 0% FRL) — zoned schools average 0% FRL vs 80% district-wide (80 pts lower); this property's tenant base skews higher-income than the district average.
- Market conditions: 84 active listings in the ZIP; 8 comparable units currently listed for rent nearby; rentals at typical pace (median 24d on market — plan ~3-4 weeks tenant-placement turnaround); lower-income renter base — watch delinquency; 1,098 units permitted in Lorain County in 2024 (20 in 5+ unit buildings).
- This rent runs 36% of the median local income ($41k/yr) — at the standard rent-burdened threshold; future hikes will face affordability resistance.
Forward outlook
- Local home prices are declining (-3.0%/yr); year-one equity from $933 of loan paydown is wiped out by about $4k of value loss. Plan a longer hold.
Negotiation context
- It's been on market 30 days — a 2% lower offer ($133k) is reasonable based on typical stale-listing flexibility.
- 3 sale attempts since 17y ago with the ask held roughly flat each time — persistent listings suggest the price (not the market) is what's stuck; bring a comps-based counter.
- Current owner paid $21k; list at $135k implies a 542% gain — meaningful room to come down on a strong offer.
Risks & watch-outs
- Watch-outs: built in 1956 — expect roof / HVAC / electrical / plumbing capex.
Questions for the listing agent
- Built in 1956 — when were the roof, HVAC, electrical panel, plumbing, and water heater last replaced?
- Is there a deadline driving the sale (1031 exchange, divorce, estate, relocation)? That informs how much negotiation room exists.
- Crime grade is F in this area — have there been break-ins, vandalism, or insurance claims at this property in the last 3 years? What carrier currently insures it and at what premium?
- The area grade is low — what's the realistic commute time and amenity access for the typical tenant pool here? Any planned neighborhood developments (good or bad) we should know about?
- What's the average days-on-market for RENTAL listings here right now (not sales)? A rising rental-DOM trend means longer vacancies and softer asking-rent achievability than the comps imply.
- What's the recent tenant-quality profile in this submarket — average credit score on applications, eviction rate, late-payment / NSF rate, and stable-employment percentage? A property-management company in the area should have these aggregated.
- How much new for-sale + rental construction is in the pipeline within 1–3 miles? Heavy new supply typically softens prices + rents 12–24 months out; constrained supply supports both.
Investment metrics
- 1% rule
- 0.90% ✗
- Cap rate
- 7.05%
- Cash-on-cash
- 2.70%
- DSCR
- 1.12
- GRM
- 9.3
CMA / ARV
- ARV (on-the-fly)
- $145,416
- Comps found
- 12
Show comp detail 12 sales within ~0.75 mi
| Address | Dist | Beds/Ba | Sqft | Sold | Price | $/sf | Match |
|---|---|---|---|---|---|---|---|
| 4429 Norfolk Ave | 0.04mi | 3/1.0 | 1,104 (+11%) | 3mo | $171,000 | $155 | 78 |
| 4217 Camden Ave | 0.24mi | 3/1.0 | 1,068 (+7%) | 2mo | $100,000 | $94 | 75 |
| 4651 Camden Ave | 0.18mi | 3/1.0 | 912 (-8%) | 6mo | $133,000 | $146 | 72 |
| 4223 Palm Ave | 0.42mi | 3/1.0 | 960 (-4%) | 3mo | $108,000 | $113 | 72 |
| 4314 Talbot Ln | 0.17mi | 3/1.0 | 864 (-13%) | 1mo | $169,900 | $197 | 69 |
| 3896 Meadow Ln | 0.67mi | 3/1.0 | 992 (-0%) | 4mo | $150,000 | $151 | 64 |
| 4608 Gary Ave | 0.52mi | 3/1.0 | 930 (-7%) | 2mo | $110,000 | $118 | 63 |
| 4215 Meadow Ln | 0.47mi | 3/2.0 | 960 (-4%) | 8mo | $166,000 | $173 | 61 |
| 5115 Bond Ave | 0.55mi | 3/1.0 | 1,063 (+7%) | 4mo | $64,500 | $61 | 60 |
| 4216 Camden Ave | 0.25mi | 3/1.0 | 1,136 (+14%) | 7mo | $135,000 | $119 | 59 |
| 2456 E 37th St | 0.66mi | 3/1.0 | 1,113 (+12%) | 1mo | $130,000 | $117 | 49 |
| 3641 Tacoma Ave | 0.61mi | 3/1.0 | 864 (-13%) | 3mo | $139,000 | $161 | 47 |
Match score weights: distance 35% · size 25% · config 20% · recency 20%. Top-matched comps best support the ARV.
Projected returns pro-forma
-3.0% appreciation · 3.0% rent growth · sell at horizon
- IRR
- -12.0%
- Equity multiple
- 0.56×
- Total profit
- $-16,461
- Equity at exit
- $20,114
- IRR
- -2.9%
- Equity multiple
- 0.80×
- Total profit
- $-7,434
- Equity at exit
- $11,664
Cash invested: $37,772 (down + closing). Projections, not guarantees.
Landlord ↔ Tenant lean methodology
- Overall (STATE)
- 73 Landlord-Friendly
- State Ohio
- 73 Landlord-Friendly · R+6
- County
- — inherits STATE
- City
- — inherits STATE
ZIP-level market 44055
- Home prices YoY
- -30.5%
- Active inventory
- 84
- Price-to-rent
- 9.3×
Monthly cashflow live
- Estimated rent
- $1,211 high interval (Pro) →
- Mortgage (P&I)
- −$707
- Tax from tax record
- −$108 /mo · $1,299/yr
- Insurance
- −$56
- HOA
- −$0
- Vacancy / Maint / Mgmt
- −$254
- Net cashflow
- $85
Break-even live
Sensitivity live
| Price | -10% $161 | -5% $123 | +0% $85 | +5% $47 | +10% $9 |
|---|---|---|---|---|---|
| Rent | -10% $-11 | -5% $37 | +0% $85 | +5% $133 | +10% $181 |
| Rate | -1.0pp $153 | -0.5pp $119 | base $85 | +0.5pp $50 | +1.0pp $15 |
UW: 25.0% down · 7.5% · 30yr · 1.5% tax · 5.0% vac · 8.0% maint · 8.0% mgmt
Financing live
Cash to close
- Down payment
- $33,725
- Closing costs
- $4,047
- Reserves months
- —
- Total cash needed
- —
Loan-product check · same deal, 3 products live
Conventional
25% down · 7.5% · 30yr
- Down + closing
- —
- Monthly P&I
- —
- Monthly cashflow
- —
- DSCR
- —
- Eligible?
- —
Personal DTI + credit; lowest rate.
DSCR
20% down · 8.5% · 30yr
- Down + closing
- —
- Monthly P&I
- —
- Monthly cashflow
- —
- DSCR
- —
- Eligible?
- —
No personal income docs; deal must DSCR.
Hard money
10% down · 12.0% · 12mo
- Down + closing
- —
- Monthly P&I
- —
- Monthly cashflow
- —
- DSCR
- —
- Eligible?
- —
Short-term bridge; refi at stabilization.
Rent comps 8 comps
| Address | Beds | Baths | Sqft | Rent | $/sqft | DOM | Units | Dist |
|---|---|---|---|---|---|---|---|---|
| 2484 E 38th St Lorain, OH | 3.0 | 1.5 | 1101 | $1,295 | $1.18 | 46d | 1 | 0.56mi |
| 3979 Gary Ave Unit 3979 2 Lorain, OH | 2.0 | 1.0 | 896 | $1,025 | $1.14 | 46d | 1 | 0.65mi |
| 3251 Camden Ave Lorain, OH | 3.0 | 1.0 | 1090 | $995 | $0.91 | 46d | 1 | 0.83mi |
| 3235 Grove Ave Unit 3235 Lorain, OH | 3.0 | 1.0 | 1080 | $950 | $0.88 | 23d | 1 | 1.05mi |
| 3237 Grove Ave Unit 3235 Lorain, OH | 3.0 | 1.0 | 1080 | $950 | $0.88 | 23d | 1 | 1.05mi |
| 2056 McKinley Ave Lorain, OH | 2.0 | 1.0 | 768 | $1,195 | $1.56 | 0d | 1 | 1.09mi |
| 1885 E 42nd St Lorain, OH | 2.0 | 1.0 | 680 | $895 | $1.32 | 0d | 1 | 1.37mi |
| 1911 E 34th St Lorain, OH | 2.0 | 1.0 | 900 | $1,100 | $1.22 | 0d | 1 | 1.44mi |
Listing history 10 events
-
2026-05-31status $134,900 Pending 30 DOM
-
2026-03-14status Pending
-
2026-02-13$134,900 Active
-
2009-06-30soldstatus $21,000 129-char remark
Show marketing remark (129 chars)
Bank Owned * 3 Bedroom Ranch With More Than 950 sq ft * Great Potential * Buyer Will Assume Any/All Expenses For Inspections *
-
2009-06-09historical 129-char remark
Show marketing remark (129 chars)
Bank Owned * 3 Bedroom Ranch With More Than 950 sq ft * Great Potential * Buyer Will Assume Any/All Expenses For Inspections *
-
2009-03-31historical
-
2009-03-09$25,000 129-char remark
Show marketing remark (129 chars)
Bank Owned * 3 Bedroom Ranch With More Than 950 sq ft * Great Potential * Buyer Will Assume Any/All Expenses For Inspections *
-
2009-01-06$29,900
-
1995-05-10soldstatus $43,500
-
1988-06-28soldstatus $22,000
ⓘ Source: listings_history table (triggers on properties + properties_extension) + one-shot
backfill from property_details.listing_events for pre-trigger history.
Tax reassessment forecast OH · Partial reset (capped growth)
- Current annual tax
- $1,299 · $108/mo
- Projected year-2 tax
- $1,702 · $142/mo
- Expected delta
- +$403/yr (+$34/mo · 31.0%)
ⓘ Screening estimate from a state-policy table — verify with the county assessor before closing.
Climate risk First Street
- Flood 1/10 Low FEMA zone X (unshaded) · 0% chance over 30 yrs
- Wildfire 1/10 Low
- Heat 3/10 Moderate 7 d/yr ≥99°F today · 16 d/yr by 30 yrs out
- Wind 1/10 Low
- Air quality 3/10 Moderate 2 unhealthy d/yr today · 4 by 30 yrs out
Nearby sold comps map
Loading sold comps map…
Walkable amenities ~0.75 mi
Loading nearby amenities…
Taxation est. · year 1
- Rental income
- $14,536
- − Mortgage interest
- −$7,556
- − Property taxes
- −$1,299
- − Insurance
- −$674
- − Repairs & maintenance
- −$1,163
- − Management
- −$1,163
- − Depreciation
- −$3,924
- Taxable loss
- −$1,244
- Est. tax savings @ 24.0%
- +$299
- After-tax cash flow
- $1,319/yr
For passive investors: Depreciation is non-cash, so a rental often shows a tax loss while cash-flowing — sheltering income. Rental losses are passive: they offset passive income freely, and up to $25,000/yr can offset ordinary (W-2) income if you actively participate and your MAGI is under $100k (phasing out to $0 by $150k); unused losses carry forward. On sale, claimed depreciation is recaptured at up to 25%, and gains may owe capital-gains tax (a 1031 exchange can defer both). Figures are a year-1 estimate at your 24.0% rate — not tax advice; consult a CPA.
Schools (NCES district)
- District
- Lorain City
- NCES district ID
- 3904426
- Math proficiency
- 13% ▼ -24.00%
- Reading proficiency
- 26% ▼ -10.00%
- Median HH income
- $32,823
- Composite
- 15.81/100
- National rank
- #9266
- State rank
- #633 of 656 in OH
Livability — Lorain
- Score
- 67/100
- State rank
- #595
- US rank
- #10183
Category grades
Schools grade is shown separately in the Schools card above.
Census & demographics
- Census place
- Lorain, OH
- County
- Lorain County · 219,437 people
- City population
- 69,409
- Metro
- Cleveland-Elyria, OH
- Population (ZIP)
- 20,043
- Household income
- $40,636
- Rent vs Own
- Severe rent burden
- 1140.0
Population outlook (Lorain County) Hauer SSP2
- Today (2025)
- 314,924 people
- By 2030
- 317,546 · +0.8%
- By 2040
- 317,962 · +1.0%
- By 2050
- 312,872 · -0.7%
- By 2075
- 301,806 · -4.2%
- By 2100
- 278,271 · -11.6%
Race, ethnicity, and origin ACS 2023
- Neighborhood character
- Diverse neighborhood (Simpson 0.68)
- Race & ethnicity
- White 41% Hispanic / Latino 37% Two or more races 24% Black 14%
- Hispanic origin (detail)
- Mexican 7% Puerto Rican 27%
- Common ancestry
- Romanian 5% Slovak 1%
- Foreign-born
- 4% · Canada, Guatemala
- Languages at home
- 75% English-only · Spanish 23%
Political lean MEDSL · Lorain
- 2024 margin
- Lean R (+5.7) · D 46.7% · R 52.4%
- 2008→2024 swing
- -23.6pp toward R · 2008: 17.9pp · 2024: -5.7pp
- All cycles
- 2024: R+5.7 2020: R+2.5 2016: R+0.3 2012: D+14.4 2008: D+17.9
Not yet ingested
- Civics
- —
Market trends
- HPI YoY
- ▼ -79.26%
- Current HPI
- 180.9309
- Rent YoY
- —
- Metro
- Cleveland-Elyria, OH
- State GDP YoY
- ▲ 1.98%
- F500 in state
- 48
Industry mix (Fortune 500 HQ in OH)
| Industry | F500 HQs | Revenue |
|---|---|---|
| Insurance | 3 | $145B |
|
||
| Industrial Machinery | 3 | $49B |
|
||
| Financial Services | 3 | $24B |
|
||
| Consumer Goods | 2 | $93B |
|
||
| Aerospace / Defense | 2 | $47B |
|
||
| Utilities | 2 | $33B |
|
||
Price history
+513.2% since first listed9 events — show timeline
- 2026-03-14 Pending — MLSNOW
- 2026-02-13 Listed $134,900 MLSNOW
- 2009-06-30 Sold (MLS) $21,000 MLSNOW
- 2009-06-09 Listing Removed — MLSNOW
- 2009-03-31 Listing Removed — MLSNOW
- 2009-03-09 Listed $25,000 MLSNOW
- 2009-01-06 Listed $29,900 MLSNOW
- 1995-05-10 Sold (Public Records) $43,500 Public Records
- 1988-06-28 Sold (Public Records) $22,000 Public Records
Property tax history
+2.8%/yrLatest (2025): $1,299 · -4.9% YoY. Source: county tax records.
Cash-flow waterfall
monthlySold comps — $/sqft
last 12 mo · ≤1 miLoading sold comps…