 🏷️ Likely Rental
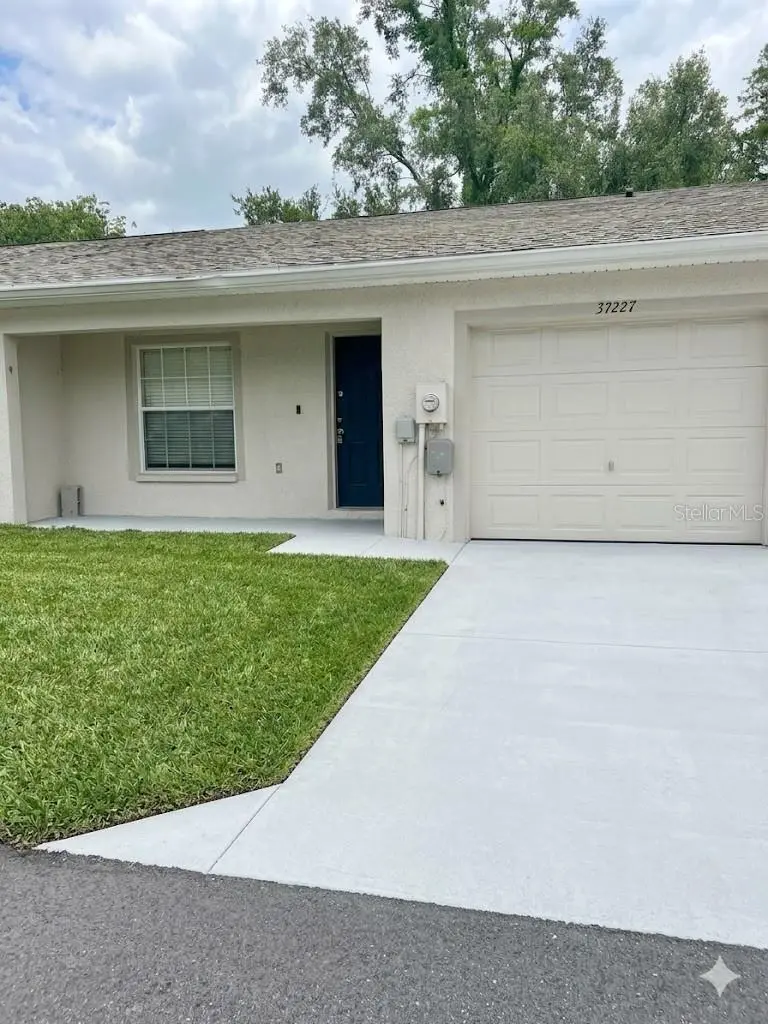
37227 Grassy Hill Ln · Dade City, FL
Flood risk 5/10 · Moderate
- FEMA flood zone
- AE
- Chance of flooding over 30 yrs
- 0.33%
- Est. flood insurance / yr
- $1,737 – $8,500
Fire risk 5/10 · Moderate
- Est. fire insurance / yr
- $947 – $1,759
Heat risk 9/10 · Severe
- Hot days now (above 109°F)
- 7 days/yr
- Hot days in 30 yrs
- 24 days/yr
Wind risk 9/10 · Severe
- Chance of severe wind over 30 yrs
- 99.0%
Air-quality risk 1/10 · Minimal
- Unhealthy air days now
- 0 days/yr
- Unhealthy air days in 30 yrs
- 0 days/yr
Risk factors via First Street. Map © Google.
Why this score? — see what drove the B+ grade
The composite is a weighted blend of 9 inputs, each scored 0–100. Each bar is that input's sub-score; the figure is the points it added to the 100-point composite (weight × sub-score).
- Cash flow +30.0/30.0
- ARV discount +15.0/15.0
- 1% rule +10.0/10.0
- DSCR +10.0/10.0
- Schools +4.3/10.0
- Livability +3.7/5.0
- Rent growth +3.3/5.0
- Condition / age +2.5/5.0
- Appreciation +0.0/10.0
$169,900
🖨 Deal sheet 📄 Offer letter ✓ Due diligence
Listing remarks
Under contract-accepting backup offers. With a 620 credit score, this property qualifies for a zero-down USDA loan. The roof and water heater have been replaced within the past 3 years. No rental restrictions, gives you the option to buy your next rental or your next home to live in! The charming and inviting 3-bedroom, 2-bathroom home with a 1-car garage. This cozy 1212 sq ft home boasts a spacious open floor plan with vaulted ceilings, perfect for entertaining or relaxing with loved ones. The well-appointed kitchen features newer cabinets and granite counters with modern appliances and ample storage space, making meal preparation a breeze. The bright, airy bedrooms offer plenty of natural
Key facts
- 1,586 sq ft lot
- Garage
- Built 2005
Property features AI
Finance
- Other: Total lot size about 0.04 acres; No waterfront; Property type: Residential (Single Family Residence); Zoned RES
- HOA & community: Monthly HOA fee of $119 (Vanguard Management/Alice Kuhn); Association fee required; Pets allowed with possible breed restrictions; cats and dogs OK; No community amenities listed
Exterior
- Parking: Attached garage (1 car)
- Utilities: Public water; Public sewer; Electricity connected; Cable available; Water connected; Sewer connected
- Home design: Single family residence; One story; Faces north
- Construction: Block construction; Shingle roof; Slab foundation; Built area approximately 1,212 square feet
- Exterior features: Other exterior features; Asphalt/paved road access
Interior
- Kitchen: Dishwasher; Microwave; Range; Refrigerator
- Bedrooms: 3 bedrooms
- Bathrooms: 2 full bathrooms
- Heating & cooling: Central heating; Central air conditioning
- Interior features: Ceiling fans
- Laundry & utility: Inside laundry
Neighborhood map
What this means for you Summary
Snapshot
- This is a 3-bed/2.0-bath single-family listed at $170k.
Deal economics
- At list price, monthly cash flow is $353 ($4k/yr) — positive.
- The deal already cash-flows at list — no discount required.
- Meets the 1% rule at list price ($3k rent vs $170k).
- Recommended offer: $165k (3.0% below list) — sets the bar for market timing.
- Cap rate 11.8% vs local median 4.6% in Dade City — top-decile yield for the area; either an underpriced asset or a hidden risk that comps aren't pricing in. Stress-test before assuming the spread holds.
Location & tenants
- Location reads 73/100 on livability (#307 in FL) — a middle-class / working-renter tenant base. Strengths: cost of living A+, housing A+, health & safety A+; Watch: employment C-, amenities F, commute F.
- Pasco (suburban): math 50% / reading 52% proficiency, ranked #32 of 73 in FL (top 44%) — acceptable for families but not a draw, mixed tenant base, ~2y average lease.
- Zoned schools: Pasco Elementary School (math 29% / reading 30%, grade F, #1,896 of 2,144 statewide, top 90%, 586 students, 89% FRL); Pasco High School (math 40% / reading 40%, grade F, #296 of 667 statewide, top 45%, 1,639 students, 66% FRL) — zoned schools average 77% FRL vs 48% district-wide (29 pts higher); higher-poverty schools than district average — tighter screening recommended.
- Zoned-school proficiency averages 35% at this address vs 51% district-wide (-16 pts) — the specific schools serving this property underperform the Pasco average; the district grade overstates school quality for this exact location.
- Market conditions: Rents rising (+3.0%/yr); 667 active listings in the ZIP; 25 comparable units currently listed for rent nearby; rentals at typical pace (median 18d on market — plan ~3-4 weeks tenant-placement turnaround); 6,765 units permitted in Pasco County in 2024 (1,250 in 5+ unit buildings).
Forward outlook
- Local home prices are declining (-3.0%/yr); year-one equity from $1k of loan paydown is wiped out by about $5k of value loss. Plan a longer hold.
- Pasco County population projected at +29% by 2050 — long-run rental-demand tailwind backs the buy-and-hold thesis.
Negotiation context
- It's been on market 36 days — a 3% lower offer ($165k) is reasonable based on typical stale-listing flexibility.
- 12 sale attempts since 19y ago with the ask held roughly flat each time — persistent listings suggest the price (not the market) is what's stuck; bring a comps-based counter.
- Current owner paid $48k; list at $170k implies a 251% gain — meaningful room to come down on a strong offer.
Risks & watch-outs
- Watch-outs: flood insurance adds $427/mo.
- Climate carrying-cost: in FEMA flood zone AE (mandatory federal flood insurance); severe wind risk, 99% chance of damaging wind over 30y; moderate wildfire risk; extreme-heat days projected 7→24/yr by 2055 (HVAC capex compounding) — expect insurance premiums to compound above CPI over the hold.
Questions for the listing agent
- It's been on market 36 days. Have you received any prior offers? Is the seller open to a 3% concession, seller financing, or rate buy-down credit?
- What's the actual annual flood-insurance premium (NFIP or private), and is the property in a SFHA with mandatory coverage?
- What does the HOA fee cover, when was the last increase, and are there any pending special assessments or reserve-fund shortfalls?
- Is there a deadline driving the sale (1031 exchange, divorce, estate, relocation)? That informs how much negotiation room exists.
- Schools are D-rated, which usually means shorter tenancies and higher turnover. Who's the typical renter profile here, and what's been the actual vacancy rate?
- What's the average days-on-market for RENTAL listings here right now (not sales)? A rising rental-DOM trend means longer vacancies and softer asking-rent achievability than the comps imply.
- What's the recent tenant-quality profile in this submarket — average credit score on applications, eviction rate, late-payment / NSF rate, and stable-employment percentage? A property-management company in the area should have these aggregated.
- How much new for-sale + rental construction is in the pipeline within 1–3 miles? Heavy new supply typically softens prices + rents 12–24 months out; constrained supply supports both.
Investment metrics
- 1% rule
- 1.57% ✓
- Cap rate
- 11.80%
- Cash-on-cash
- 19.67%
- DSCR
- 1.88
- GRM
- 5.3
CMA / ARV
- ARV (on-the-fly)
- $248,460
- Comps found
- 5
Show comp detail 5 sales within ~0.75 mi
| Address | Dist | Beds/Ba | Sqft | Sold | Price | $/sf | Match |
|---|---|---|---|---|---|---|---|
| 37146 Grassy Hill Ln | 0.07mi | 2/2.0 (-1) | 1,212 (0%) | 21mo | $160,000 | $132 | 74 |
| 37236 Poinsettia Ave | 0.31mi | 3/2.0 | 1,304 (+8%) | 5mo | $135,000 | $104 | 69 |
| 37722 Granada Ave | 0.48mi | 3/2.0 | 1,144 (-6%) | 9mo | $260,000 | $227 | 61 |
| 36547 Jackson Ave | 0.69mi | 3/2.0 | 1,102 (-9%) | 3mo | $232,000 | $211 | 51 |
| 37023 Florida Ave | 0.69mi | 3/2.0 | 1,292 (+7%) | 22mo | $265,000 | $205 | 39 |
Match score weights: distance 35% · size 25% · config 20% · recency 20%. Top-matched comps best support the ARV.
Projected returns pro-forma
-3.0% appreciation · 3.02% rent growth · sell at horizon
- IRR
- -2.5%
- Equity multiple
- 0.90×
- Total profit
- $-4,578
- Equity at exit
- $25,333
- IRR
- 7.4%
- Equity multiple
- 1.56×
- Total profit
- $26,811
- Equity at exit
- $14,690
Cash invested: $47,572 (down + closing). Projections, not guarantees.
Landlord ↔ Tenant lean methodology
- Overall (STATE)
- 87 Strongly Landlord-Friendly
- State Florida
- 87 Strongly Landlord-Friendly · R+3
- County
- — inherits STATE
- City
- — inherits STATE
ZIP-level market 33525
- Home prices YoY
- -15.4%
- Rents YoY
- 3.0%
- Active inventory
- 667
- Price-to-rent
- 5.3×
Monthly cashflow live
- Estimated rent
- $2,661 high interval (Pro) →
- Mortgage (P&I)
- −$891
- Tax from tax record
- −$242 /mo · $2,900/yr
- Insurance
- −$71
- Flood insurance flood zone
- −$427 /mo · $5,118/yr
- HOA
- −$119
- Vacancy / Maint / Mgmt
- −$559
- Net cashflow
- $353
Break-even live
UW: 25.0% down · 7.5% · 30yr · 1.5% tax · 5.0% vac · 8.0% maint · 8.0% mgmt
Financing live
Cash to close
- Down payment
- $42,475
- Closing costs
- $5,097
- Reserves months
- —
- Total cash needed
- —
Loan-product check · same deal, 3 products live
Conventional
25% down · 7.5% · 30yr
- Down + closing
- —
- Monthly P&I
- —
- Monthly cashflow
- —
- DSCR
- —
- Eligible?
- —
Personal DTI + credit; lowest rate.
DSCR
20% down · 8.5% · 30yr
- Down + closing
- —
- Monthly P&I
- —
- Monthly cashflow
- —
- DSCR
- —
- Eligible?
- —
No personal income docs; deal must DSCR.
Hard money
10% down · 12.0% · 12mo
- Down + closing
- —
- Monthly P&I
- —
- Monthly cashflow
- —
- DSCR
- —
- Eligible?
- —
Short-term bridge; refi at stabilization.
Rent comps 25 comps
| Address | Beds | Baths | Sqft | Rent | $/sqft | DOM | Units | Dist |
|---|---|---|---|---|---|---|---|---|
| 37228 Grassy Hill Ln Unit 1 Dade City, FL | 3.0 | 2.0 | 1212 | $1,750 | $1.44 | 3d | 1 | 0.03mi |
| 37215 Grassy Hill Ln Dade City, FL | 3.0 | 2.0 | 1212 | $1,495 | $1.23 | 24d | 1 | 0.03mi |
| 37132 Grassy Hill Ln Unit 1 Dade City, FL | 3.0 | 2.0 | 1212 | $3,500 | $2.89 | 24d | 1 | 0.09mi |
| 37132 Grassy Hill Ln Unit 1234477P Dade City, FL | 3.0 | 2.0 | 1205 | $3,594 | $2.98 | 2d | 1 | 0.09mi |
| 37135 Grassy Hill Ln Unit 1 Dade City, FL | 3.0 | 2.0 | 1212 | $3,500 | $2.89 | 24d | 1 | 0.09mi |
| 37135 Grassy Hill Ln Unit 1234475P Dade City, FL | 3.0 | 2.0 | 1205 | $3,535 | $2.93 | 2d | 1 | 0.09mi |
| 13921 19th St Unit 1234474P Dade City, FL | 2.0 | 1.0 | 936 | $2,013 | $2.15 | 16d | 1 | 0.73mi |
| 37011 Bear Branch Dr Dade City, FL | 3.0–4.0 | 2.0–3.0 | 1730 | $1,837 | $1.06 | 1d | 16 | 0.86mi |
| 13650 5th St Dade City, FL | 2.0 | 1.0 | 900 | $1,350 | $1.50 | 12d | 1 | 0.92mi |
| 37015 Waldo Dr Dade City, FL | 4.0 | 2.0 | 1480 | $3,750 | $2.53 | 24d | 1 | 0.99mi |
| 37329 Magnolia Ave Unit 1234471P Dade City, FL | 3.0 | 2.0 | 1216 | $3,391 | $2.79 | 4d | 1 | 1.09mi |
| 13917 2nd St Dade City, FL | 3.0 | 1.0 | 1312 | $1,950 | $1.49 | 24d | 1 | 1.17mi |
| 13253 Waterford Castle Dr Dade City, FL | 3.0 | 2.0 | 1189 | $1,749 | $1.47 | 2d | 1 | 1.22mi |
| 37540 Martin Luther King Blvd Unit A Dade City, FL | 2.0 | 1.0 | 784 | $1,200 | $1.53 | 24d | 1 | 1.31mi |
| 37850 Wdcf Dr Dade City, FL | 2.0 | 1.0 | 775 | $1,375 | $1.77 | 4d | 1 | 1.32mi |
| 37850 Wdcf Dr Dade City, FL | 2.0 | 1.0 | 775 | $1,375 | $1.77 | 14d | 1 | 1.32mi |
| 38210 Williams Aire St Dade City, FL | 2.0 | 2.0 | 912 | $1,600 | $1.75 | 24d | 1 | 1.36mi |
| 11916 Sylvia St Dade City, FL | 3.0 | 2.5 | 1386 | $1,369 | $0.99 | 4d | 1 | 1.38mi |
| 11908 Sylvia St Dade City, FL | 3.0 | 2.5 | 1386 | $1,520 | $1.10 | 24d | 1 | 1.39mi |
| 11908 Sylvia St Dade City, FL | 3.0 | 2.5 | 1386 | $1,520 | $1.10 | 17d | 1 | 1.39mi |
| 11898 Sylvia St Dade City, FL | 3.0 | 2.5 | 1386 | $1,369 | $0.99 | 14d | 1 | 1.40mi |
| 11890 Sylvia St Dade City, FL | 3.0 | 2.5 | 1386 | $1,695 | $1.22 | 17d | 1 | 1.41mi |
| 11890 Sylvia St Dade City, FL | 3.0 | 2.5 | 1386 | $1,695 | $1.22 | 24d | 1 | 1.41mi |
| 14635 State St Dade City, FL | 3.0 | 1.5 | 1040 | $1,761 | $1.69 | 21d | 1 | 1.46mi |
| 38714 Island Ave Dade City, FL | 3.0 | 2.0 | 864 | $1,695 | $1.96 | 24d | 1 | 1.50mi |
HOA detail
- Monthly dues
- $119 · $1,428/yr
- Likely covers
- water
Listing history 30 events
-
2026-04-20$169,900 Active
-
2025-12-31status Pending
-
2025-12-31historical
-
2025-12-16price $169,900
-
2025-11-10price $179,900
-
2025-11-07status Active
-
2025-11-07price $184,900
-
2025-11-06$185,000 Active
-
2025-10-01price $185,000
-
2025-07-11price $190,000
-
2025-07-07$195,000 Active
-
2025-05-14historical $1,625
-
2025-05-14$1,625
-
2024-02-27historical $1,750
-
2024-01-27$1,750
-
2017-07-06historical
-
2017-06-06status Active
-
2017-05-16status Pending
-
2017-05-10historical
-
2017-04-30status Active
-
2017-04-25status Pending
-
2017-04-21$65,000 Active
-
2014-09-02soldstatus $48,403 Sold
-
2014-08-27status Pending
-
2014-08-05price $49,900
-
2014-07-14$55,000 Active
-
2012-01-26soldstatus $26,500
-
2010-09-28$35,500
-
2007-10-24$155,000
-
2005-12-13soldstatus $134,900
ⓘ Source: listings_history table (triggers on properties + properties_extension) + one-shot
backfill from property_details.listing_events for pre-trigger history.
Tax reassessment forecast FL · Resets to sale price
- Current annual tax
- $2,900 · $242/mo
- Projected year-2 tax
- $2,900 · $242/mo
- Expected delta
- $0/yr ($0/mo · 0.0%)
ⓘ Screening estimate from a state-policy table — verify with the county assessor before closing.
Climate risk First Street
- Flood 5/10 Major FEMA zone AE · 33% chance over 30 yrs
- Wildfire 5/10 Major
- Heat 9/10 Extreme 7 d/yr ≥109°F today · 24 d/yr by 30 yrs out
- Wind 9/10 Extreme 99% chance of damaging wind over 30 yrs
- Air quality 1/10 Low 0 unhealthy d/yr today · 0 by 30 yrs out
Nearby sold comps map
Loading sold comps map…
Walkable amenities ~0.75 mi
Loading nearby amenities…
Taxation est. · year 1
- Rental income
- $31,934
- − Mortgage interest
- −$9,517
- − Property taxes
- −$2,900
- − Insurance
- −$5,968
- − Repairs & maintenance
- −$2,555
- − Management
- −$2,555
- − HOA
- −$1,428
- − Depreciation
- −$4,943
- Taxable income
- $2,069
- Est. tax owed @ 24.0%
- −$497
- After-tax cash flow
- $3,744/yr
For passive investors: Depreciation is non-cash, so a rental often shows a tax loss while cash-flowing — sheltering income. Rental losses are passive: they offset passive income freely, and up to $25,000/yr can offset ordinary (W-2) income if you actively participate and your MAGI is under $100k (phasing out to $0 by $150k); unused losses carry forward. On sale, claimed depreciation is recaptured at up to 25%, and gains may owe capital-gains tax (a 1031 exchange can defer both). Figures are a year-1 estimate at your 24.0% rate — not tax advice; consult a CPA.
Schools (NCES district)
- District
- Pasco
- NCES district ID
- 1201530
- Math proficiency
- 50% ▼ -10.00%
- Reading proficiency
- 52% ▼ -5.00%
- Median HH income
- $45,039
- Composite
- 43.14/100
- National rank
- #3074
- State rank
- #32 of 73 in FL
Livability — Dade City
- Score
- 73/100
- State rank
- #307
- US rank
- #5215
Category grades
Schools grade is shown separately in the Schools card above.
Census & demographics
- Census place
- Dade City, FL
- County
- Pasco County · 524,098 people
- Metro
- Tampa-St. Petersburg-Clearwater, FL
- Population (ZIP)
- 21,077
- Household income
- $69,068
- Rent vs Own
- Severe rent burden
- 322.0
Population outlook (Pasco County) Hauer SSP2
- Today (2025)
- 570,045 people
- By 2030
- 605,844 · +6.3%
- By 2040
- 674,806 · +18.4%
- By 2050
- 736,022 · +29.1%
- By 2075
- 862,900 · +51.4%
- By 2100
- 906,364 · +59.0%
Race, ethnicity, and origin ACS 2023
- Neighborhood character
- Predominantly White (76%)
- Race & ethnicity
- White 76% Hispanic / Latino 16% Two or more races 7% Black 3%
- Hispanic origin (detail)
- Mexican 9% Puerto Rican 3%
- Common ancestry
- Lithuanian 2% Romanian 2% Serbian 2%
- Foreign-born
- 6% · Canada, Jamaica
- Languages at home
- 87% English-only · Spanish 11% Other Asian/Pacific 1% Other Indo-European 1%
Political lean MEDSL · Pasco
- 2024 margin
- Strong R (+25.2) · D 36.9% · R 62.1% · Other 1.0%
- 2008→2024 swing
- -21.6pp toward R · 2008: -3.6pp · 2024: -25.2pp
- All cycles
- 2024: R+25.2 2020: R+20.1 2016: R+21.6 2012: R+6.7 2008: R+3.6
Not yet ingested
- Civics
- —
Market trends
- HPI YoY
- ▼ -65.48%
- Current HPI
- 358.2149
- Rent YoY
- ▲ 3.02%
- Metro
- Tampa-St. Petersburg-Clearwater, FL
- State GDP YoY
- ▲ 3.28%
- F500 in state
- 36
Industry mix (Fortune 500 HQ in FL)
| Industry | F500 HQs | Revenue |
|---|---|---|
| Industrial Technology | 2 | $29B |
|
||
| Insurance | 2 | $17B |
|
||
| Retail | 1 | $60B |
|
||
| Technology Distribution | 1 | $58B |
|
||
| Homebuilding | 1 | $35B |
|
||
| Technology Manufacturing | 1 | $35B |
|
||
Price history
+25.9% since first listed30 events — show timeline
- 2026-04-20 Listed $169,900 Stellar MLS as Distributed by MLS Grid
- 2025-12-31 Pending — Stellar MLS as Distributed by MLS Grid
- 2025-12-31 Listing Removed — Stellar MLS as Distributed by MLS Grid
- 2025-12-16 Price Changed $169,900 Stellar MLS as Distributed by MLS Grid
- 2025-11-10 Price Changed $179,900 Stellar MLS as Distributed by MLS Grid
- 2025-11-07 Relisted — Stellar MLS as Distributed by MLS Grid
- 2025-11-07 Price Changed $184,900 Stellar MLS as Distributed by MLS Grid
- 2025-11-06 Listed $185,000 Stellar MLS as Distributed by MLS Grid
- 2025-10-01 Price Changed $185,000 Stellar MLS as Distributed by MLS Grid
- 2025-07-11 Price Changed $190,000 Stellar MLS as Distributed by MLS Grid
- 2025-07-07 Listed $195,000 Stellar MLS as Distributed by MLS Grid
- 2025-05-14 Rental Removed $1,625 STELLARMLS
- 2025-05-14 Listed for Rent $1,625 STELLARMLS
- 2024-02-27 Rental Removed $1,750 STELLARMLS
- 2024-01-27 Listed for Rent $1,750 STELLARMLS
- 2017-07-06 Listing Removed — Stellar MLS as Distributed by MLS Grid
- 2017-06-06 Relisted — Stellar MLS as Distributed by MLS Grid
- 2017-05-16 Pending — Stellar MLS as Distributed by MLS Grid
- 2017-05-10 Listing Removed — Stellar MLS as Distributed by MLS Grid
- 2017-04-30 Relisted — Stellar MLS as Distributed by MLS Grid
- 2017-04-25 Pending — Stellar MLS as Distributed by MLS Grid
- 2017-04-21 Listed $65,000 Stellar MLS as Distributed by MLS Grid
- 2014-09-02 Sold (MLS) $48,403 Stellar MLS as Distributed by MLS Grid
- 2014-08-27 Pending — Stellar MLS as Distributed by MLS Grid
- 2014-08-05 Price Changed $49,900 Stellar MLS as Distributed by MLS Grid
- 2014-07-14 Listed $55,000 Stellar MLS as Distributed by MLS Grid
- 2012-01-26 Sold (MLS) $26,500 Stellar MLS as Distributed by MLS Grid
- 2010-09-28 Listed $35,500 Stellar MLS as Distributed by MLS Grid
- 2007-10-24 Listed $155,000 Stellar MLS as Distributed by MLS Grid
- 2005-12-13 Sold (Public Records) $134,900 Public Records
Property tax history
+11.4%/yrLatest (2025): $2,900 · +6.4% YoY. Source: county tax records.
Cash-flow waterfall
monthlySold comps — $/sqft
last 12 mo · ≤1 miLoading sold comps…