 🏷️ Likely Rental
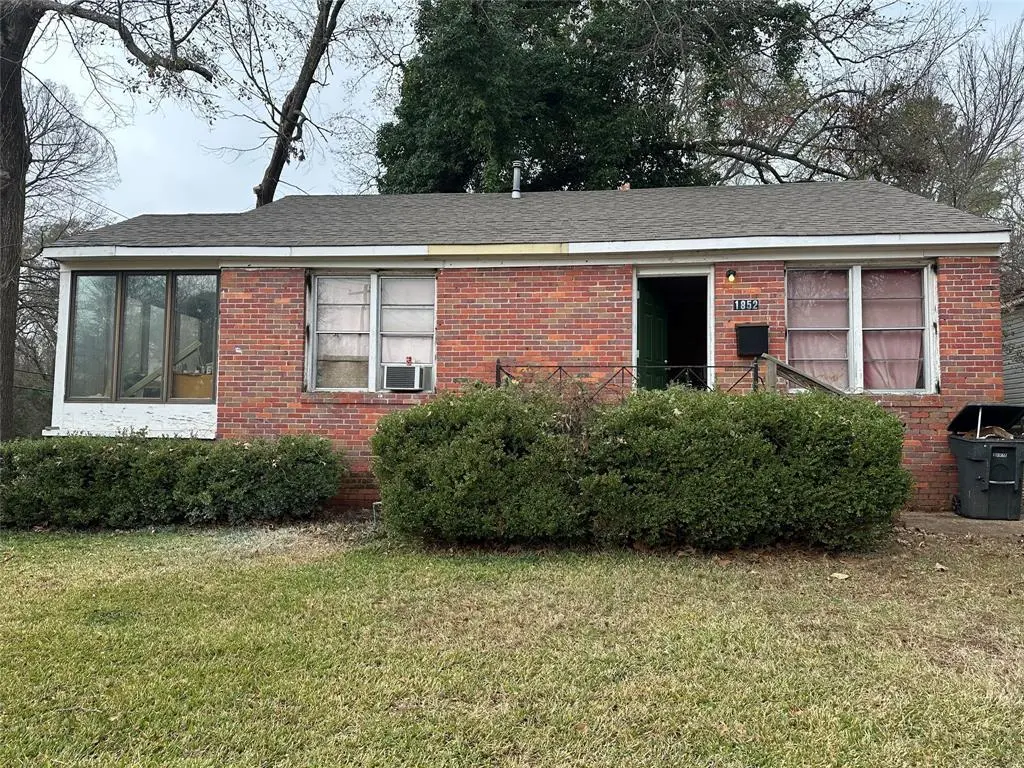
1852 Jenkins Ave · Shreveport, LA
Flood risk 1/10 · Minimal
- FEMA flood zone
- X (unshaded)
- Chance of flooding over 30 yrs
- 0.0%
- Est. flood insurance / yr
- $507 – $1,088
Fire risk 1/10 · Minimal
- Est. fire insurance / yr
- $1,269 – $2,357
Heat risk 7/10 · Major
- Hot days now (above 110°F)
- 7 days/yr
- Hot days in 30 yrs
- 21 days/yr
Wind risk 6/10 · Moderate
- Chance of severe wind over 30 yrs
- 68.0%
Air-quality risk 2/10 · Minimal
- Unhealthy air days now
- 1 days/yr
- Unhealthy air days in 30 yrs
- 2 days/yr
Risk factors via First Street. Map © Google.
Why this score? — see what drove the A- grade
The composite is a weighted blend of 9 inputs, each scored 0–100. Each bar is that input's sub-score; the figure is the points it added to the 100-point composite (weight × sub-score).
- Cash flow +30.0/30.0
- ARV discount +15.0/15.0
- 1% rule +10.0/10.0
- DSCR +10.0/10.0
- Appreciation +4.8/10.0
- Livability +3.0/5.0
- Rent growth +2.5/5.0
- Condition / age +2.5/5.0
- Schools +2.2/10.0
$40,000
🖨 Deal sheet 📄 Offer letter ✓ Due diligence
Listing remarks
Great investment opportunity! This 2 bedroom, 1 bath home comes with a long-term tenant of 14 years currently paying $700 per month on a month-to-month lease, offering immediate income potential. The home features an eat-in kitchen with electric range and refrigerator, central AC and heat plus a 6 month old gas hot water heater. Whether you're looking to add to your rental portfolio or purchase your first investment property, this property offers steady rental history and solid potential. Do not disturb tenants.
Key facts
- Gas hot water heater
- Electric range
- Eat-in kitchen
Tags
Property features AI
Finance
- Other: Standard listing; possession at closing/funding
- Financial info: Listing accepts cash, fixed, or other financing
- HOA & community: No association
Exterior
- Parking: Driveway parking
- Utilities: City water; City sewer; Not in a municipal utility district
- Home design: Single-family residence; Residential property; Built in 1955
- Construction: Brick and siding exterior; Composition roof; Slab foundation
- Exterior features: Back yard with chain link fencing
Interior
- Kitchen: Built-in cabinets; Eat-in kitchen; Solid-surface (non-natural) countertops; Electric range; Refrigerator; Utility area in kitchen
- Bedrooms: 2 bedrooms (both on main level)
- Flooring: Carpet; Laminate
- Bathrooms: 1 full bathroom with garden tub and medicine cabinet
- Heating & cooling: Central heating (natural gas); Central air; Wall unit(s)
- Interior features: Eat-in kitchen; Paneling; 5 total rooms; One-level layout
- Laundry & utility: Laundry located in kitchen; Gas water heater
Neighborhood map
What this means for you Summary
Snapshot
- This is a 2-bed/1.0-bath single-family listed at $40k.
Deal economics
- At list price, monthly cash flow is $350 ($4k/yr) — positive.
- The deal already cash-flows at list — no discount required.
- Meets the 1% rule at list price ($793 rent vs $40k).
- Recommended offer: $39k (1.5% below list) — sets the bar for market timing.
- Cap rate 16.8% vs local median 5.7% in Shreveport — top-decile yield for the area; either an underpriced asset or a hidden risk that comps aren't pricing in. Stress-test before assuming the spread holds.
Location & tenants
- Location reads 59/100 on livability (#270 in LA) — a working-class tenant base; expect higher turnover. Strengths: cost of living A+, housing A; Watch: schools D+, crime F, amenities F.
- Caddo Parish (urban): math 21% / reading 32% proficiency, ranked #53 of 98 in LA (top 54%) — low school quality limits family demand, transient renter base, plan for 1-2y turnover; 64% free/reduced lunch — lower-income household profile, screen leases tightly.
- Market conditions: 61 active listings in the ZIP; 40 comparable units currently listed for rent nearby; rentals at typical pace (median 21d on market — plan ~3-4 weeks tenant-placement turnaround); 40% of comp listings sitting > 30 days — soft ceiling on asking rent; lower-income renter base — watch delinquency; 221 units permitted in Caddo Parish in 2024 (0 in 5+ unit buildings).
- At $793/mo this rent would consume 49% of the median local household income ($19k/yr) (locally 702% of renters already pay >50% of income on rent) — very limited rent-growth headroom before tenants either downsize or default.
Forward outlook
- In year one you build about $157 of equity ($277 loan paydown + $-120 appreciation (-0.3% local appreciation)).
- Caddo County population projected at -15% by 2050 — secular population decline; favor cash flow + early exit over multi-decade hold.
- At projected returns (-0.3% appreciation + 3.0% rent growth), your $11k cash investment doubles in ~3 years — after that, you're playing with house money.
Negotiation context
- It's been on market 21 days — a 2% lower offer ($39k) is reasonable based on typical stale-listing flexibility.
- Current owner paid $18k; list at $40k implies a 122% gain — meaningful room to come down on a strong offer.
Risks & watch-outs
- Watch-outs: built in 1955 — expect roof / HVAC / electrical / plumbing capex.
- Climate carrying-cost: major wind risk, 68% chance of damaging wind over 30y; extreme-heat days projected 7→21/yr by 2055 (HVAC capex compounding) — expect insurance premiums to compound above CPI over the hold.
Questions for the listing agent
- Built in 1955 — when were the roof, HVAC, electrical panel, plumbing, and water heater last replaced?
- Is there a deadline driving the sale (1031 exchange, divorce, estate, relocation)? That informs how much negotiation room exists.
- Schools are D-rated, which usually means shorter tenancies and higher turnover. Who's the typical renter profile here, and what's been the actual vacancy rate?
- Crime grade is F in this area — have there been break-ins, vandalism, or insurance claims at this property in the last 3 years? What carrier currently insures it and at what premium?
- What's the average days-on-market for RENTAL listings here right now (not sales)? A rising rental-DOM trend means longer vacancies and softer asking-rent achievability than the comps imply.
- What's the recent tenant-quality profile in this submarket — average credit score on applications, eviction rate, late-payment / NSF rate, and stable-employment percentage? A property-management company in the area should have these aggregated.
- How much new for-sale + rental construction is in the pipeline within 1–3 miles? Heavy new supply typically softens prices + rents 12–24 months out; constrained supply supports both.
Investment metrics
- 1% rule
- 1.98% ✓
- Cap rate
- 16.79%
- Cash-on-cash
- 37.50%
- DSCR
- 2.67
- GRM
- 4.2
CMA / ARV
- ARV (on-the-fly)
- $60,634
- Comps found
- 12
Show comp detail 12 sales within ~0.75 mi
| Address | Dist | Beds/Ba | Sqft | Sold | Price | $/sf | Match |
|---|---|---|---|---|---|---|---|
| 147 E Herndon St | 0.25mi | 2/1.0 | 1,018 (+2%) | 13mo | $45,000 | $44 | 74 |
| 204 Boulevard St | 0.40mi | 2/1.0 | 1,028 (+3%) | 6mo | $38,000 | $37 | 70 |
| 140 E College | 0.18mi | 3/1.0 (+1) | 1,100 (+11%) | 0mo | $10,000 | $9 | 69 |
| 1821 Jenkins Ave | 0.06mi | 2/1.0 | 858 (-14%) | 11mo | $17,000 | $20 | 65 |
| 123 Lister St | 0.39mi | 2/1.0 | 1,059 (+6%) | 12mo | $65,000 | $61 | 61 |
| 257 E Egan St | 0.42mi | 2/1.0 | 931 (-6%) | 13mo | $45,000 | $48 | 60 |
| 230 E Lister St | 0.32mi | 3/1.0 (+1) | 1,068 (+7%) | 14mo | $74,950 | $70 | 56 |
| 2618 Roosevelt Ave | 0.53mi | 3/1.0 (+1) | 845 (-15%) | 1mo | $45,000 | $53 | 44 |
| 2530 Captain Sawyer Dr | 0.70mi | 3/1.0 (+1) | 1,056 (+6%) | 10mo | $134,999 | $128 | 44 |
| 140 E Rutherford St | 0.68mi | 2/1.0 | 1,130 (+14%) | 9mo | $138,999 | $123 | 38 |
| 2612 W Cavett Dr | 0.71mi | 3/1.0 (+1) | 1,121 (+13%) | 4mo | $130,000 | $116 | 37 |
| 316 Dalzell St | 0.60mi | 3/2.0 (+1) | 1,142 (+15%) | 11mo | $148,000 | $130 | 29 |
Match score weights: distance 35% · size 25% · config 20% · recency 20%. Top-matched comps best support the ARV.
Projected returns pro-forma
-0.3% appreciation · 3.0% rent growth · sell at horizon
- IRR
- 37.9%
- Equity multiple
- 2.84×
- Total profit
- $20,573
- Equity at exit
- $11,016
- IRR
- 41.5%
- Equity multiple
- 5.58×
- Total profit
- $51,291
- Equity at exit
- $12,774
Cash invested: $11,200 (down + closing). Projections, not guarantees.
Landlord ↔ Tenant lean methodology
- Overall (STATE)
- 90 Strongly Landlord-Friendly
- State Louisiana
- 90 Strongly Landlord-Friendly · R+12
- County
- — inherits STATE
- City
- — inherits STATE
ZIP-level market 71101
- Home prices YoY
- -0.4%
- Active inventory
- 61
- Price-to-rent
- 4.2×
Monthly cashflow live
- Estimated rent
- $793 high interval (Pro) →
- Mortgage (P&I)
- −$210
- Tax from tax record
- −$50 /mo · $602/yr
- Insurance
- −$17
- HOA
- −$0
- Vacancy / Maint / Mgmt
- −$167
- Net cashflow
- $350
Break-even live
UW: 25.0% down · 7.5% · 30yr · 1.5% tax · 5.0% vac · 8.0% maint · 8.0% mgmt
Financing live
Cash to close
- Down payment
- $10,000
- Closing costs
- $1,200
- Reserves months
- —
- Total cash needed
- —
Loan-product check · same deal, 3 products live
Conventional
25% down · 7.5% · 30yr
- Down + closing
- —
- Monthly P&I
- —
- Monthly cashflow
- —
- DSCR
- —
- Eligible?
- —
Personal DTI + credit; lowest rate.
DSCR
20% down · 8.5% · 30yr
- Down + closing
- —
- Monthly P&I
- —
- Monthly cashflow
- —
- DSCR
- —
- Eligible?
- —
No personal income docs; deal must DSCR.
Hard money
10% down · 12.0% · 12mo
- Down + closing
- —
- Monthly P&I
- —
- Monthly cashflow
- —
- DSCR
- —
- Eligible?
- —
Short-term bridge; refi at stabilization.
Rent comps 40 comps
| Address | Beds | Baths | Sqft | Rent | $/sqft | DOM | Units | Dist |
|---|---|---|---|---|---|---|---|---|
| 336 E Olive St Shreveport, LA | 2.0 | 1.0 | 600 | $595 | $0.99 | 43d | 1 | 0.16mi |
| 253 E Jordan St Unit 251 Shreveport, LA | 2.0 | 1.0 | 784 | $900 | $1.15 | 43d | 1 | 0.34mi |
| 202 E College St Apt 2 Shreveport, LA | 1.0 | 1.0 | 800 | $600 | $0.75 | 43d | 1 | 0.34mi |
| 139 Lister St Shreveport, LA | 1.0 | 1.0 | 650 | $600 | $0.92 | 13d | 1 | 0.37mi |
| 204 Boulevard St Shreveport, LA | 2.0 | 1.0 | 1028 | $1,195 | $1.16 | 43d | 1 | 0.39mi |
| 2317 Freewater St Shreveport, LA | 2.0 | 1.0 | 695 | $750 | $1.08 | 13d | 1 | 0.45mi |
| 114 Egan St Shreveport, LA | 1.0 | 1.0 | 800 | $550 | $0.69 | 43d | 1 | 0.48mi |
| 320 College St Unit A Shreveport, LA | 1.0 | 1.0 | 800 | $650 | $0.81 | 21d | 1 | 0.48mi |
| 140 Wilkinson St Unit 140 Shreveport, LA | 2.0 | 1.0 | 1000 | $1,200 | $1.20 | 21d | 1 | 0.54mi |
| 2618 Roosevelt Ave Shreveport, LA | 3.0 | 1.0 | 845 | $1,000 | $1.18 | 21d | 1 | 0.56mi |
| 1225 Pecan St Unit B Shreveport, LA | 3.0 | 2.0 | 1070 | $900 | $0.84 | 21d | 1 | 0.57mi |
| 431 College St Shreveport, LA | 2.0 | 2.0 | 1100 | $850 | $0.77 | 13d | 1 | 0.64mi |
| 342 Prospect St Shreveport, LA | 1.0 | 1.0 | 800 | $650 | $0.81 | 21d | 1 | 0.64mi |
| 409 Egan St Shreveport, LA | 2.0 | 1.0 | 1000 | $725 | $0.72 | 43d | 1 | 0.70mi |
| 402 Egan St Unit Gilbert, 1320 Shreveport, LA | 2.0 | 1.0 | 600 | $565 | $0.94 | 21d | 1 | 0.71mi |
| 523 Wichita St Shreveport, LA | 1.0 | 1.0 | 800 | $650 | $0.81 | 21d | 1 | 0.73mi |
| 533 Merrick St Unit C Shreveport, LA | 1.0 | 1.0 | 825 | $595 | $0.72 | 21d | 1 | 0.75mi |
| 455 Egan St Shreveport, LA | 1.0 | 1.0 | 650 | $650 | $1.00 | 43d | 1 | 0.78mi |
| 1535 River Parkway Blvd Shreveport, LA | 1.0–3.0 | 1.0–2.0 | 928 | $1,740 | $1.88 | 13d | 10 | 0.79mi |
| 557 Merrick St Shreveport, LA | 1.0 | 1.0 | 950 | $725 | $0.76 | 43d | 1 | 0.80mi |
| 546 Dalzell St Shreveport, LA | 2.0 | 1.0 | 1000 | $875 | $0.88 | 21d | 1 | 0.82mi |
| 517 Stoner Ave Shreveport, LA | 2.0 | 1.0 | 1100 | $625 | $0.57 | 43d | 1 | 0.86mi |
| 818 E Washington St Shreveport, LA | 3.0 | 1.0 | 1100 | $1,300 | $1.18 | 21d | 1 | 0.86mi |
| 649 Merrick St Shreveport, LA | 1.0 | 1.0 | 700 | $650 | $0.93 | 13d | 1 | 0.91mi |
| 336 Atkins Ave Shreveport, LA | 2.0 | 1.0 | 912 | $900 | $0.99 | 43d | 1 | 0.98mi |
| 1301 Coates Bluff Dr Shreveport, LA | 1.0–2.0 | 1.0–2.0 | 1004 | $2,300 | $2.29 | 13d | 11 | 0.99mi |
| 640 Kirby Pl Unit 640 Shreveport, LA | 1.0 | 1.0 | 850 | $600 | $0.71 | 21d | 1 | 1.05mi |
| 1844 Line Ave Unit 2 Shreveport, LA | 1.0 | 1.0 | 750 | $850 | $1.13 | 43d | 1 | 1.10mi |
| 1844 Line Ave Unit 2 Shreveport, LA | 1.0 | 1.0 | 750 | $850 | $1.13 | 21d | 1 | 1.10mi |
| 654 Columbia St Shreveport, LA | 1.0 | 1.0 | 600 | $850 | $1.42 | 21d | 1 | 1.10mi |
| 820 College St Apt 2 (Upstairs Front) Shreveport, LA | 1.0 | 1.0 | 750 | $575 | $0.77 | 13d | 1 | 1.11mi |
| 819 Boulevard St Shreveport, LA | 2.0 | 1.0 | 900 | $800 | $0.89 | 21d | 1 | 1.13mi |
| 3307 Creswell Ave Shreveport, LA | 1.0 | 1.0 | 700 | $850 | $1.21 | 43d | 1 | 1.21mi |
| 3307 Creswell Ave Shreveport, LA | 1.0 | 1.0 | 525 | $800 | $1.52 | 21d | 1 | 1.21mi |
| 2903 Weyman St Shreveport, LA | 1.0–2.0 | 1.0 | 800 | $950 | $1.19 | 13d | 6 | 1.21mi |
| 553 Gladstone Blvd Unit A Shreveport, LA | 1.0 | 1.0 | 850 | $700 | $0.82 | 43d | 1 | 1.25mi |
| 810 Rutherford St Unit A Shreveport, LA | 1.0 | 1.0 | 700 | $800 | $1.14 | 13d | 1 | 1.29mi |
| 2201 Naples St Bossier City, LA | 2.0 | 1.0 | 759 | $775 | $1.02 | 43d | 1 | 1.37mi |
| 1027 Boulevard St Unit B Shreveport, LA | 1.0 | 1.0 | 750 | $700 | $0.93 | 43d | 1 | 1.39mi |
| 1019 Sheridan Ave Unit C Shreveport, LA | 1.0 | 1.0 | 650 | $650 | $1.00 | 43d | 1 | 1.39mi |
Listing history 16 events
-
2026-06-16days on market $40,000 Active 21 DOM
-
2026-06-15days on market $40,000 Active 20 DOM
-
2026-06-14days on market $40,000 Active 18 DOM
-
2026-06-13days on market $40,000 Active 17 DOM
-
2026-06-10days on market $40,000 Active 15 DOM
-
2026-06-09days on market $40,000 Active 14 DOM
-
2026-06-08days on market $40,000 Active 13 DOM
-
2026-06-07days on market $40,000 Active 12 DOM
-
2026-06-05days on market $40,000 Active 9 DOM
-
2026-06-03days on market $40,000 Active 8 DOM
-
2026-06-02days on market $40,000 Active 7 DOM
-
2026-06-01days on market $40,000 Active 6 DOM
-
2026-05-31days on market $40,000 Active 5 DOM
-
2026-05-30days on market $40,000 Active 4 DOM
-
2026-05-26$40,000 Active
-
2008-10-20soldstatus $18,000
ⓘ Source: listings_history table (triggers on properties + properties_extension) + one-shot
backfill from property_details.listing_events for pre-trigger history.
Tax reassessment forecast LA · Resets to sale price
- Current annual tax
- $602 · $50/mo
- Projected year-2 tax
- $602 · $50/mo
- Expected delta
- $0/yr ($0/mo · 0.0%)
ⓘ Screening estimate from a state-policy table — verify with the county assessor before closing.
Climate risk First Street
- Flood 1/10 Low FEMA zone X (unshaded) · 0% chance over 30 yrs
- Wildfire 1/10 Low
- Heat 7/10 Severe 7 d/yr ≥110°F today · 21 d/yr by 30 yrs out
- Wind 6/10 Major 68% chance of damaging wind over 30 yrs
- Air quality 2/10 Low 1 unhealthy d/yr today · 2 by 30 yrs out
Nearby sold comps map
Loading sold comps map…
Walkable amenities ~0.75 mi
Loading nearby amenities…
Taxation est. · year 1
- Rental income
- $9,518
- − Mortgage interest
- −$2,241
- − Property taxes
- −$602
- − Insurance
- −$200
- − Repairs & maintenance
- −$761
- − Management
- −$761
- − Depreciation
- −$1,164
- Taxable income
- $3,789
- Est. tax owed @ 24.0%
- −$909
- After-tax cash flow
- $3,291/yr
For passive investors: Depreciation is non-cash, so a rental often shows a tax loss while cash-flowing — sheltering income. Rental losses are passive: they offset passive income freely, and up to $25,000/yr can offset ordinary (W-2) income if you actively participate and your MAGI is under $100k (phasing out to $0 by $150k); unused losses carry forward. On sale, claimed depreciation is recaptured at up to 25%, and gains may owe capital-gains tax (a 1031 exchange can defer both). Figures are a year-1 estimate at your 24.0% rate — not tax advice; consult a CPA.
Schools (NCES district)
- District
- Caddo Parish
- NCES district ID
- 2200300
- Math proficiency
- 21% ▼ -33.00%
- Reading proficiency
- 32% ▼ -30.00%
- Median HH income
- $39,227
- Composite
- 22.23/100
- National rank
- #8148
- State rank
- #53 of 98 in LA
Livability — Shreveport
- Score
- 59/100
- State rank
- #270
- US rank
- #19730
Category grades
Schools grade is shown separately in the Schools card above.
Census & demographics
- Census place
- Shreveport, LA
- County
- Caddo Parish · 178,536 people
- City population
- 164,123
- Metro
- Shreveport-Bossier City, LA
- Population (ZIP)
- 6,415
- Household income
- $19,351
- Rent vs Own
- Severe rent burden
- 702.0
Population outlook (Caddo County) Hauer SSP2
- Today (2025)
- 243,190 people
- By 2030
- 237,231 · -2.5%
- By 2040
- 222,502 · -8.5%
- By 2050
- 206,516 · -15.1%
- By 2075
- 165,706 · -31.9%
- By 2100
- 122,262 · -49.7%
Race, ethnicity, and origin ACS 2023
- Neighborhood character
- Majority Black (63%)
- Race & ethnicity
- Black 63% White 29% Hispanic / Latino 5% Two or more races 2%
- Common ancestry
- Lithuanian 1% Slovak 1%
- Foreign-born
- 2% · China
- Languages at home
- 98% English-only · Tagalog/Filipino 0%
Political lean MEDSL · Caddo
- 2024 margin
- Toss-up / Even · D 51.6% · R 47.0% · Other 1.4%
- 2008→2024 swing
- +1.6pp toward D · 2008: 3.0pp · 2024: 4.6pp
- All cycles
- 2024: D+4.6 2020: D+6.8 2016: D+4.2 2012: D+4.9 2008: D+3.0
Not yet ingested
- Civics
- —
Market trends
- HPI YoY
- ▼ -0.30%
- Current HPI
- 74.2131
- Rent YoY
- —
- Metro
- Shreveport-Bossier City, LA
- State GDP YoY
- ▲ 3.29%
- F500 in state
- 10
Industry mix (Fortune 500 HQ in LA)
| Industry | F500 HQs | Revenue |
|---|---|---|
| Telecommunications | 2 | $23B |
|
||
| Utilities | 1 | $12B |
|
||
| Wholesale / Distribution | 1 | $5B |
|
||
| Advertising | 1 | $2B |
|
||
Price history
+122.2% since first listed2 events — show timeline
- 2026-05-26 Listed $40,000 NTREIS
- 2008-10-20 Sold (Public Records) $18,000 Public Records
Property tax history
-1.7%/yrLatest (2025): $602 · +0.4% YoY. Source: county tax records.
Cash-flow waterfall
monthlySold comps — $/sqft
last 12 mo · ≤1 miLoading sold comps…