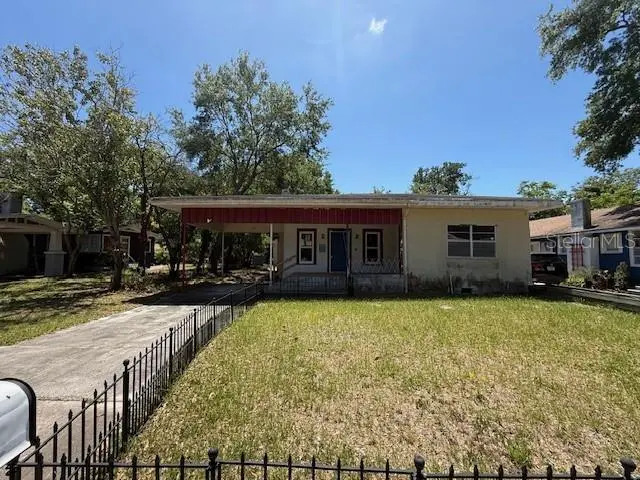
522 W Park St · Lakeland, FL
Flood risk 1/10 · Minimal
- FEMA flood zone
- X (unshaded)
- Chance of flooding over 30 yrs
- 0.0%
- Est. flood insurance / yr
- $507 – $1,088
Fire risk 1/10 · Minimal
- Est. fire insurance / yr
- $947 – $1,759
Heat risk 8/10 · Major
- Hot days now (above 108°F)
- 5 days/yr
- Hot days in 30 yrs
- 15 days/yr
Wind risk 9/10 · Severe
- Chance of severe wind over 30 yrs
- 99.0%
Air-quality risk 2/10 · Minimal
- Unhealthy air days now
- 1 days/yr
- Unhealthy air days in 30 yrs
- 2 days/yr
Risk factors via First Street. Map © Google.
Why this score? — see what drove the B- grade
The composite is a weighted blend of 9 inputs, each scored 0–100. Each bar is that input's sub-score; the figure is the points it added to the 100-point composite (weight × sub-score).
- Cash flow +30.0/30.0
- 1% rule +10.0/10.0
- DSCR +10.0/10.0
- ARV discount +7.5/15.0
- Livability +3.9/5.0
- Schools +3.5/10.0
- Rent growth +2.5/5.0
- Condition / age +2.5/5.0
- Appreciation +0.0/10.0
$130,000
🖨 Deal sheet (PDF) 📄 Offer letter ✓ Due diligence
Listing remarks MLS
Great home in historic Dixieland. This bungalow home was built in 1925 and has only had 3 owners! Large living room and dining room combo Large kitchen with an eat in kitchen. Vaulted ceilings, fireplace, lots in built ins. Sliding glass doors take you from the kitchen to the dining room take you to the screened lanai.
Key facts
- 7,248 sq ft lot
- Parking
- Built 1925
Neighborhood map
What this means for you Summary
Snapshot
- This is a 3-bed/1.0-bath single-family listed at $130k.
Deal economics
- At list price, monthly cash flow is $722 ($9k/yr) — positive.
- The deal already cash-flows at list — no discount required.
- Meets the 1% rule at list price ($2k rent vs $130k).
Location & tenants
- Location reads 77/100 on livability (#206 in FL, #3,179 nationally) — a middle-class / working-renter tenant base. Strengths: cost of living A+, housing A+, health & safety A+; Watch: employment D+, amenities F, commute F.
- Polk (suburban): math 39% / reading 43% proficiency, ranked #62 of 73 in FL (top 85%) — families likely to look elsewhere, expect single-tenant / working-renter base with shorter leases.
- Zoned schools: Highlands Grove Elementary School (math 69% / reading 59%, grade B, #552 of 2,144 statewide, top 26%, 731 students, 36% FRL); George W. Jenkins Senior High (math 25% / reading 49%, grade F, #340 of 667 statewide, top 52%, 2,451 students, 37% FRL) — zoned schools average 36% FRL vs 60% district-wide (23 pts lower); this property's tenant base skews higher-income than the district average.
- Market conditions: Rents soft (-0.1%/yr); 223 active listings in the ZIP; 8 comparable units currently listed for rent nearby; rentals at typical pace (median 24d on market — plan ~3-4 weeks tenant-placement turnaround); 10,384 units permitted in Polk County in 2024 (1,716 in 5+ unit buildings).
- This rent runs 38% of the median local income ($66k/yr) — at the standard rent-burdened threshold; future hikes will face affordability resistance.
Forward outlook
- Local home prices are declining (-3.0%/yr); year-one equity from $899 of loan paydown is wiped out by about $4k of value loss. Plan a longer hold.
- Polk County population projected at +33% by 2050 — long-run rental-demand tailwind backs the buy-and-hold thesis.
- At projected returns (-3.0% appreciation + 0.0% rent growth), your $36k cash investment doubles in ~7 years — after that, you're playing with house money.
Negotiation context
- Only 7 days on market — expect competitive offers; lowballing is unlikely to land.
- 7 sale attempts since 14y ago with the ask held roughly flat each time — persistent listings suggest the price (not the market) is what's stuck; bring a comps-based counter.
Risks & watch-outs
- Watch-outs: built in 1925 — expect roof / HVAC / electrical / plumbing capex.
- Climate carrying-cost: severe wind risk, 99% chance of damaging wind over 30y; extreme-heat days projected 5→15/yr by 2055 (HVAC capex compounding) — expect insurance premiums to compound above CPI over the hold.
Questions for the listing agent
- Built in 1925 — when were the roof, HVAC, electrical panel, plumbing, and water heater last replaced?
- Is there a deadline driving the sale (1031 exchange, divorce, estate, relocation)? That informs how much negotiation room exists.
- What's the average days-on-market for RENTAL listings here right now (not sales)? A rising rental-DOM trend means longer vacancies and softer asking-rent achievability than the comps imply.
- What's the recent tenant-quality profile in this submarket — average credit score on applications, eviction rate, late-payment / NSF rate, and stable-employment percentage? A property-management company in the area should have these aggregated.
- How much new for-sale + rental construction is in the pipeline within 1–3 miles? Heavy new supply typically softens prices + rents 12–24 months out; constrained supply supports both.
Investment metrics
- 1% rule
- 1.61% ✓
- Cap rate
- 12.96%
- Cash-on-cash
- 23.80%
- DSCR
- 2.06
- GRM
- 5.2
CMA / ARV
No comps found within radius.
Projected returns pro-forma
-3.0% appreciation · 0.0% rent growth · sell at horizon
- IRR
- 13.5%
- Equity multiple
- 1.52×
- Total profit
- $18,824
- Equity at exit
- $19,383
- IRR
- 19.8%
- Equity multiple
- 2.43×
- Total profit
- $52,059
- Equity at exit
- $11,240
Cash invested: $36,400 (down + closing). Projections, not guarantees.
Landlord ↔ Tenant lean methodology
- Overall (STATE)
- 87 Strongly Landlord-Friendly
- State Florida
- 87 Strongly Landlord-Friendly · R+3
- County
- — inherits STATE
- City
- — inherits STATE
ZIP-level market 33803
- Home prices YoY
- -26.4%
- Rents YoY
- -0.1%
- Active inventory
- 223
- Price-to-rent
- 5.2×
Monthly cashflow live
- Estimated rent
- $2,099 high interval (Pro) →
- Mortgage (P&I)
- −$682
- Tax from tax record
- −$200 /mo · $2,400/yr
- Insurance
- −$54
- HOA
- −$0
- Vacancy / Maint / Mgmt
- −$441
- Net cashflow
- $722
Break-even live
Sensitivity live
| Price | -10% $796 | -5% $759 | +0% $722 | +5% $685 | +10% $648 |
|---|---|---|---|---|---|
| Rent | -10% $556 | -5% $639 | +0% $722 | +5% $805 | +10% $888 |
| Rate | -1.0pp $787 | -0.5pp $755 | base $722 | +0.5pp $688 | +1.0pp $654 |
UW: 25.0% down · 7.5% · 30yr · 1.5% tax · 5.0% vac · 8.0% maint · 8.0% mgmt
Financing live
Cash to close
- Down payment
- $32,500
- Closing costs
- $3,900
- Reserves months
- —
- Total cash needed
- —
Loan-product check · same deal, 3 products live
Conventional
25% down · 7.5% · 30yr
- Down + closing
- —
- Monthly P&I
- —
- Monthly cashflow
- —
- DSCR
- —
- Eligible?
- —
Personal DTI + credit; lowest rate.
DSCR
20% down · 8.5% · 30yr
- Down + closing
- —
- Monthly P&I
- —
- Monthly cashflow
- —
- DSCR
- —
- Eligible?
- —
No personal income docs; deal must DSCR.
Hard money
10% down · 12.0% · 12mo
- Down + closing
- —
- Monthly P&I
- —
- Monthly cashflow
- —
- DSCR
- —
- Eligible?
- —
Short-term bridge; refi at stabilization.
Rent comps 8 comps
| Address | Beds | Baths | Sqft | Rent | $/sqft | DOM | Units | Dist |
|---|---|---|---|---|---|---|---|---|
| 312 W Park St Lakeland, FL | 3.0 | 3.0 | 2000 | $2,100 | $1.05 | 24d | 1 | 0.15mi |
| 1 Lake Hollingsworth Dr Lakeland, FL | 3.0 | 2.0 | 1492 | $2,095 | $1.40 | 3d | 2 | 0.57mi |
| 1246 Dorothy St Lakeland, FL | 3.0 | 2.0 | 1484 | $2,300 | $1.55 | 24d | 1 | 0.89mi |
| 301 Allamanda Dr Lakeland, FL | 3.0 | 2.0 | 1985 | $2,850 | $1.44 | 24d | 1 | 1.00mi |
| 1335 W Walnut St Lakeland, FL | 3.0 | 2.0 | 1626 | $1,800 | $1.11 | 3d | 1 | 1.16mi |
| 158 Lake Hollingsworth Dr Lakeland, FL | 3.0 | 2.0 | 1900 | $2,750 | $1.45 | 24d | 1 | 1.37mi |
| 446 Francis Blvd Lakeland, FL | 2.0 | 1.0 | 1499 | $1,150 | $0.77 | 3d | 1 | 1.39mi |
| 1806 Dorothy St Lakeland, FL | 3.0 | 2.0 | 2046 | $1,695 | $0.83 | 3d | 1 | 1.40mi |
Listing history 20 events
-
2026-04-23status Pending
-
2026-04-15$130,000 Active
-
2025-07-31status Pending
-
2025-07-31historical
-
2025-07-03price $250,000
-
2025-02-25status Active
-
2025-02-20status Pending
-
2025-02-03status Active
-
2025-01-31historical
-
2025-01-09status Active
-
2025-01-03status Pending
-
2024-09-27price $275,000
-
2024-09-06$299,000 Active
-
2017-05-24soldstatus $150,000
-
2017-05-17soldstatus $150,000 Sold 321-char remark
Show marketing remark (321 chars)
Great home in historic Dixieland. This bungalow home was built in 1925 and has only had 3 owners! Large living room and dining room combo Large kitchen with an eat in kitchen. Vaulted ceilings, fireplace, lots in built ins. Sliding glass doors take you from the kitchen to the dining room take you to the screened lanai.
-
2017-04-07historical 321-char remark
Show marketing remark (321 chars)
Great home in historic Dixieland. This bungalow home was built in 1925 and has only had 3 owners! Large living room and dining room combo Large kitchen with an eat in kitchen. Vaulted ceilings, fireplace, lots in built ins. Sliding glass doors take you from the kitchen to the dining room take you to the screened lanai.
-
2017-04-05$144,900 321-char remark
Show marketing remark (321 chars)
Great home in historic Dixieland. This bungalow home was built in 1925 and has only had 3 owners! Large living room and dining room combo Large kitchen with an eat in kitchen. Vaulted ceilings, fireplace, lots in built ins. Sliding glass doors take you from the kitchen to the dining room take you to the screened lanai.
-
2012-11-16soldstatus $79,000
-
2012-11-07soldstatus $79,000
-
2012-04-06$89,500
ⓘ Source: listings_history table (triggers on properties + properties_extension) + one-shot
backfill from property_details.listing_events for pre-trigger history.
Tax reassessment forecast FL · Resets to sale price
- Current annual tax
- $2,400 · $200/mo
- Projected year-2 tax
- $2,400 · $200/mo
- Expected delta
- $0/yr ($0/mo · 0.0%)
ⓘ Screening estimate from a state-policy table — verify with the county assessor before closing.
Climate risk First Street
- Flood 1/10 Low FEMA zone X (unshaded) · 0% chance over 30 yrs
- Wildfire 1/10 Low
- Heat 8/10 Severe 5 d/yr ≥108°F today · 15 d/yr by 30 yrs out
- Wind 9/10 Extreme 99% chance of damaging wind over 30 yrs
- Air quality 2/10 Low 1 unhealthy d/yr today · 2 by 30 yrs out
Nearby sold comps map
Loading sold comps map…
Walkable amenities ~0.75 mi
Loading nearby amenities…
Taxation est. · year 1
- Rental income
- $25,183
- − Mortgage interest
- −$7,282
- − Property taxes
- −$2,400
- − Insurance
- −$650
- − Repairs & maintenance
- −$2,015
- − Management
- −$2,015
- − Depreciation
- −$3,782
- Taxable income
- $7,040
- Est. tax owed @ 24.0%
- −$1,690
- After-tax cash flow
- $6,974/yr
For passive investors: Depreciation is non-cash, so a rental often shows a tax loss while cash-flowing — sheltering income. Rental losses are passive: they offset passive income freely, and up to $25,000/yr can offset ordinary (W-2) income if you actively participate and your MAGI is under $100k (phasing out to $0 by $150k); unused losses carry forward. On sale, claimed depreciation is recaptured at up to 25%, and gains may owe capital-gains tax (a 1031 exchange can defer both). Figures are a year-1 estimate at your 24.0% rate — not tax advice; consult a CPA.
Schools (NCES district)
- District
- Polk
- NCES district ID
- 1201590
- Math proficiency
- 39% ▼ -11.00%
- Reading proficiency
- 43% ▼ -4.00%
- Median HH income
- $43,979
- Composite
- 34.74/100
- National rank
- #5132
- State rank
- #62 of 73 in FL
Livability — Lakeland
- Score
- 77/100
- State rank
- #206
- US rank
- #3179
Category grades
Schools grade is shown separately in the Schools card above.
Census & demographics
- Census place
- Lakeland, FL
- County
- Polk County · 740,051 people
- City population
- 277,690
- Metro
- Lakeland-Winter Haven, FL
- Population (ZIP)
- 29,321
- Household income
- $65,807
- Rent vs Own
- Severe rent burden
- 1128.0
Population outlook (Polk County) Hauer SSP2
- Today (2025)
- 752,975 people
- By 2030
- 804,621 · +6.9%
- By 2040
- 906,117 · +20.3%
- By 2050
- 1,000,476 · +32.9%
- By 2075
- 1,197,520 · +59.0%
- By 2100
- 1,271,518 · +68.9%
Race, ethnicity, and origin ACS 2023
- Neighborhood character
- Predominantly White (70%)
- Race & ethnicity
- White 70% Hispanic / Latino 20% Two or more races 11% Black 6% Asian 2%
- Hispanic origin (detail)
- Mexican 3% Puerto Rican 6% Cuban 2% Dominican 1%
- Common ancestry
- Italian 3% Slovak 3% Lithuanian 2%
- Foreign-born
- 11% · Canada, China, Jamaica
- Languages at home
- 80% English-only · Spanish 17% Other Indo-European 1% Other Asian/Pacific 1%
Political lean MEDSL · Polk
- 2024 margin
- Strong R (+20.7) · D 39.2% · R 59.9%
- 2008→2024 swing
- -14.6pp toward R · 2008: -6.1pp · 2024: -20.7pp
- All cycles
- 2024: R+20.7 2020: R+14.4 2016: R+14.1 2012: R+6.8 2008: R+6.1
Not yet ingested
- Civics
- —
Market trends
- HPI YoY
- ▼ -110.05%
- Current HPI
- 306.9789
- Rent YoY
- ▼ -0.06%
- Metro
- Lakeland-Winter Haven, FL
- State GDP YoY
- ▲ 3.28%
- F500 in state
- 36
Industry mix (Fortune 500 HQ in FL)
| Industry | F500 HQs | Revenue |
|---|---|---|
| Industrial Technology | 2 | $29B |
|
||
| Insurance | 2 | $17B |
|
||
| Retail | 1 | $60B |
|
||
| Technology Distribution | 1 | $58B |
|
||
| Homebuilding | 1 | $35B |
|
||
| Technology Manufacturing | 1 | $35B |
|
||
Price history
+45.3% since first listed20 events — show timeline
- 2026-04-23 Pending — Stellar MLS as Distributed by MLS Grid
- 2026-04-15 Listed $130,000 Stellar MLS as Distributed by MLS Grid
- 2025-07-31 Pending — Stellar MLS as Distributed by MLS Grid
- 2025-07-31 Listing Removed — Stellar MLS as Distributed by MLS Grid
- 2025-07-03 Price Changed $250,000 Stellar MLS as Distributed by MLS Grid
- 2025-02-25 Relisted — Stellar MLS as Distributed by MLS Grid
- 2025-02-20 Pending — Stellar MLS as Distributed by MLS Grid
- 2025-02-03 Relisted — Stellar MLS as Distributed by MLS Grid
- 2025-01-31 Listing Removed — Stellar MLS as Distributed by MLS Grid
- 2025-01-09 Relisted — Stellar MLS as Distributed by MLS Grid
- 2025-01-03 Pending — Stellar MLS as Distributed by MLS Grid
- 2024-09-27 Price Changed $275,000 Stellar MLS as Distributed by MLS Grid
- 2024-09-06 Listed $299,000 Stellar MLS as Distributed by MLS Grid
- 2017-05-24 Sold (Public Records) $150,000 Public Records
- 2017-05-17 Sold (MLS) $150,000 Stellar MLS as Distributed by MLS Grid
- 2017-04-07 Listing Removed — Stellar MLS as Distributed by MLS Grid
- 2017-04-05 Listed $144,900 Stellar MLS as Distributed by MLS Grid
- 2012-11-16 Sold (Public Records) $79,000 Public Records
- 2012-11-07 Sold (MLS) $79,000 Stellar MLS as Distributed by MLS Grid
- 2012-04-06 Listed $89,500 Stellar MLS as Distributed by MLS Grid
Property tax history
+13.0%/yrLatest (2025): $2,400 · +3.5% YoY. Source: county tax records.
Cash-flow waterfall
monthlySold comps — $/sqft
last 12 mo · ≤1 miLoading sold comps…