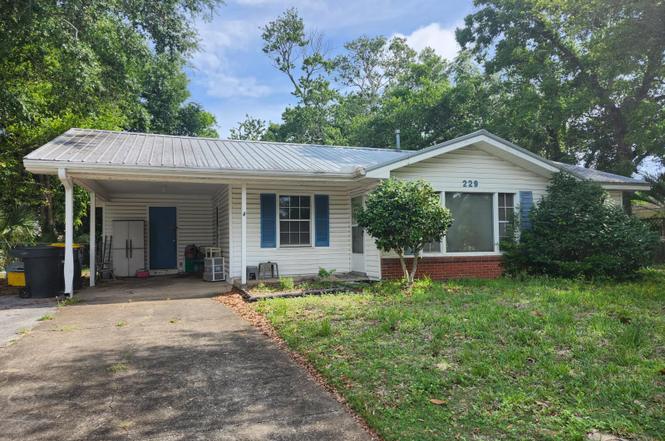
229 NW Holmes Blvd · Fort Walton Beach, FL
Flood risk 1/10 · Minimal
- FEMA flood zone
- X (unshaded)
- Chance of flooding over 30 yrs
- 0.0%
- Est. flood insurance / yr
- $507 – $1,088
Fire risk 1/10 · Minimal
- Est. fire insurance / yr
- $947 – $1,759
Heat risk 10/10 · Severe
- Hot days now (above 104°F)
- 7 days/yr
- Hot days in 30 yrs
- 22 days/yr
Wind risk 9/10 · Severe
- Chance of severe wind over 30 yrs
- 99.0%
Air-quality risk 2/10 · Minimal
- Unhealthy air days now
- 1 days/yr
- Unhealthy air days in 30 yrs
- 2 days/yr
Risk factors via First Street. Map © Google.
Why this score? — see what drove the C grade
The composite is a weighted blend of 9 inputs, each scored 0–100. Each bar is that input's sub-score; the figure is the points it added to the 100-point composite (weight × sub-score).
- Cash flow +18.7/30.0
- ARV discount +15.0/15.0
- DSCR +5.9/10.0
- Schools +5.2/10.0
- 1% rule +5.0/10.0
- Livability +4.0/5.0
- Rent growth +2.8/5.0
- Condition / age +2.5/5.0
- Appreciation +0.0/10.0
$179,900
🖨 Deal sheet 📄 Offer letter ✓ Due diligence
Listing remarks
This 3-bedroom, 1-bathroom home features a strong foundation and highly durable metal roof. The core systems are in great shape, including a well-maintained HVAC system under 10 years old and a newer hot water heater. Inside, the floor plan spans 1,043 square feet and sits on a generous quarter-acre lot. The property offers solid bones overall but is ready for your personal touch. Bring your creative ideas, fresh paint, and cosmetic customization to truly make this coastal property shine!
Key facts
- Solid bones
- Metal roof
- Strong foundation
Tags
Property features AI
Exterior
- Parking: Attached covered carport (1 carport space)
- Utilities: Public water; Public sewer; Central electric HVAC
- Home design: Single-story home; Built in 1960; Architectural style: Other; Residential single-family zoning
- Construction: Total building area recorded as 1,043; Year built 1960
- Exterior features: Lot approximately 0.25 acres with dimensions about 84 x 125; Subdivision: 2ND ADD VESTA HTS
Interior
- Kitchen: First-floor kitchen (approximately 14 x 16)
- Bedrooms: Three bedrooms total; Primary bedroom on the first floor (approximately 12 x 12); Second bedroom on the first floor (approximately 11 x 11); Third bedroom on the first floor (approximately 10 x 10)
- Bathrooms: One full bathroom
- Heating & cooling: Central heating; Central air conditioning; Ceiling fans; Electric heat controls
- Interior features: Five total rooms; Living room on the first floor; Kitchen on the first floor
Neighborhood map
What this means for you Summary
Snapshot
- This is a 3-bed/1.0-bath single-family listed at $180k.
Deal economics
- At list price, monthly cash flow is $176 ($2k/yr) — positive.
- The deal already cash-flows at list — no discount required.
- To meet the 1% rule (rent ≥ 1% of price), the offer needs to be $180k (0.1% below list).
- Recommended offer: $180k (0.1% below list) — sets the bar for 1% rule.
- Cap rate 7.5% vs local median 0.9% in Fort Walton Beach — top-decile yield for the area; either an underpriced asset or a hidden risk that comps aren't pricing in. Stress-test before assuming the spread holds.
Location & tenants
- Location reads 80/100 on livability (#111 in FL, #1,628 nationally) — a professional / high-income tenant draw. Strengths: commute A+, housing A+, health & safety A+; Watch: amenities F.
- Okaloosa (other): math 60% / reading 60% proficiency, ranked #12 of 73 in FL (top 16%) — acceptable for families but not a draw, mixed tenant base, ~2y average lease.
- Zoned schools: Annette P. Edwins Elementary School (math 47% / reading 42%, grade F, #1,288 of 2,144 statewide, top 62%, 453 students, 80% FRL); Fort Walton Beach High School (math 54% / reading 58%, grade C, #131 of 667 statewide, top 20%, 1,620 students, 42% FRL) — zoned schools average 61% FRL vs 36% district-wide (25 pts higher); higher-poverty schools than district average — tighter screening recommended.
- Market conditions: Rents rising (+1.3%/yr); 341 active listings in the ZIP; 39 comparable units currently listed for rent nearby; rentals at typical pace (median 21d on market — plan ~3-4 weeks tenant-placement turnaround); 1,268 units permitted in Okaloosa County in 2024 (175 in 5+ unit buildings).
- This rent runs 33% of the median local income ($65k/yr) — at the standard rent-burdened threshold; future hikes will face affordability resistance.
Forward outlook
- Local home prices are declining (-3.0%/yr); year-one equity from $1k of loan paydown is wiped out by about $5k of value loss. Plan a longer hold.
- Okaloosa County population projected at +37% by 2050 — long-run rental-demand tailwind backs the buy-and-hold thesis.
Negotiation context
- Only 8 days on market — expect competitive offers; lowballing is unlikely to land.
- 2 sale attempts since 29y ago with the ask held roughly flat each time — persistent listings suggest the price (not the market) is what's stuck; bring a comps-based counter.
- Current owner paid $50k; list at $180k implies a 261% gain — meaningful room to come down on a strong offer.
Risks & watch-outs
- Climate carrying-cost: severe wind risk, 99% chance of damaging wind over 30y; extreme-heat days projected 7→22/yr by 2055 (HVAC capex compounding) — expect insurance premiums to compound above CPI over the hold.
Questions for the listing agent
- Built in 1960 — when were the roof, HVAC, electrical panel, plumbing, and water heater last replaced?
- Is there a deadline driving the sale (1031 exchange, divorce, estate, relocation)? That informs how much negotiation room exists.
- What's the average days-on-market for RENTAL listings here right now (not sales)? A rising rental-DOM trend means longer vacancies and softer asking-rent achievability than the comps imply.
- What's the recent tenant-quality profile in this submarket — average credit score on applications, eviction rate, late-payment / NSF rate, and stable-employment percentage? A property-management company in the area should have these aggregated.
- How much new for-sale + rental construction is in the pipeline within 1–3 miles? Heavy new supply typically softens prices + rents 12–24 months out; constrained supply supports both.
Investment metrics
- 1% rule
- 1.00% ✗
- Cap rate
- 7.47%
- Cash-on-cash
- 4.20%
- DSCR
- 1.19
- GRM
- 8.3
CMA / ARV
- ARV (on-the-fly)
- $241,976
- Comps found
- 12
Show comp detail 12 sales within ~0.75 mi
| Address | Dist | Beds/Ba | Sqft | Sold | Price | $/sf | Match |
|---|---|---|---|---|---|---|---|
| 228 NW Martisa Rd | 0.23mi | 3/1.5 | 1,053 (+1%) | 8mo | $212,700 | $202 | 79 |
| 34 NW Hemlock Dr | 0.24mi | 3/2.0 | 1,050 (+1%) | 6mo | $320,000 | $305 | 78 |
| 214 NW Jet Ct | 0.23mi | 3/2.0 | 1,075 (+3%) | 7mo | $275,000 | $256 | 74 |
| 224 NW Gilda Pl | 0.08mi | 3/1.5 | 1,151 (+10%) | 3mo | $200,000 | $174 | 74 |
| 315 NW Leah Miller Dr | 0.23mi | 3/2.0 | 1,134 (+9%) | 1mo | $289,900 | $256 | 70 |
| 131 NW Moriarty St | 0.37mi | 3/1.0 | 1,158 (+11%) | 1mo | $140,000 | $121 | 63 |
| 119 NW Thames Pl | 0.36mi | 3/1.5 | 1,140 (+9%) | 7mo | $229,900 | $202 | 60 |
| 12 NW Memorial Pkwy | 0.43mi | 3/1.0 | 1,144 (+10%) | 7mo | $265,000 | $232 | 58 |
| 326 NW Oakland Circle Cir | 0.64mi | 3/1.0 | 1,080 (+4%) | 9mo | $160,000 | $148 | 57 |
| 113 NW Loizos Dr | 0.50mi | 3/1.5 | 1,148 (+10%) | 11mo | $295,000 | $257 | 48 |
| 61 NW Silva Dr | 0.47mi | 3/2.0 | 1,160 (+11%) | 10mo | $269,500 | $232 | 47 |
| 141 NW Rainbow Dr | 0.50mi | 2/1.5 (-1) | 1,158 (+11%) | 11mo | $285,000 | $246 | 42 |
Match score weights: distance 35% · size 25% · config 20% · recency 20%. Top-matched comps best support the ARV.
Projected returns pro-forma
-3.0% appreciation · 1.33% rent growth · sell at horizon
- IRR
- -11.6%
- Equity multiple
- 0.59×
- Total profit
- $-20,856
- Equity at exit
- $26,824
- IRR
- -5.0%
- Equity multiple
- 0.69×
- Total profit
- $-15,366
- Equity at exit
- $15,554
Cash invested: $50,372 (down + closing). Projections, not guarantees.
Landlord ↔ Tenant lean methodology
- Overall (STATE)
- 87 Strongly Landlord-Friendly
- State Florida
- 87 Strongly Landlord-Friendly · R+3
- County
- — inherits STATE
- City
- — inherits STATE
ZIP-level market 32548
- Home prices YoY
- -31.1%
- Rents YoY
- 1.3%
- Active inventory
- 341
- Price-to-rent
- 8.3×
Monthly cashflow live
- Estimated rent
- $1,797 high interval (Pro) →
- Mortgage (P&I)
- −$943
- Tax est. 1.5%
- −$225 /mo · $2,698/yr
- Insurance
- −$75
- HOA
- −$0
- Vacancy / Maint / Mgmt
- −$377
- Net cashflow
- $176
Break-even live
UW: 25.0% down · 7.5% · 30yr · 1.5% tax · 5.0% vac · 8.0% maint · 8.0% mgmt
Financing live
Cash to close
- Down payment
- $44,975
- Closing costs
- $5,397
- Reserves months
- —
- Total cash needed
- —
Loan-product check · same deal, 3 products live
Conventional
25% down · 7.5% · 30yr
- Down + closing
- —
- Monthly P&I
- —
- Monthly cashflow
- —
- DSCR
- —
- Eligible?
- —
Personal DTI + credit; lowest rate.
DSCR
20% down · 8.5% · 30yr
- Down + closing
- —
- Monthly P&I
- —
- Monthly cashflow
- —
- DSCR
- —
- Eligible?
- —
No personal income docs; deal must DSCR.
Hard money
10% down · 12.0% · 12mo
- Down + closing
- —
- Monthly P&I
- —
- Monthly cashflow
- —
- DSCR
- —
- Eligible?
- —
Short-term bridge; refi at stabilization.
Rent comps 39 comps
| Address | Beds | Baths | Sqft | Rent | $/sqft | DOM | Units | Dist |
|---|---|---|---|---|---|---|---|---|
| 305 Leah Miller Dr NW Fort Walton Beach, FL | 3.0 | 1.5 | 1334 | $2,000 | $1.50 | 21d | 1 | 0.25mi |
| 110 Loizos Dr NW Fort Walton Beach, FL | 3.0 | 2.0 | 1148 | $2,200 | $1.92 | 43d | 1 | 0.55mi |
| 44 Wright Pkwy NW Fort Walton Beach, FL | 2.0 | 1.0 | 1000 | $1,350 | $1.35 | 21d | 1 | 0.63mi |
| 405 Marshall Ct Fort Walton Beach, FL | 2.0 | 2.0 | 1000 | $1,495 | $1.50 | 43d | 1 | 0.69mi |
| 17 Cape Dr NW Unit B Fort Walton Beach, FL | 3.0 | 2.0 | 1462 | $1,995 | $1.36 | 13d | 1 | 0.74mi |
| 402 Marshall Ct NW #6 Fort Walton Beach, FL | 2.0 | 2.0 | 1050 | $1,500 | $1.43 | 21d | 1 | 0.75mi |
| 358 Coral Dr SW Fort Walton Beach, FL | 3.0 | 2.0 | 1350 | $1,800 | $1.33 | 43d | 1 | 0.77mi |
| 218 Rose Marie Ln SW Fort Walton Beach, FL | 3.0 | 1.0 | 1208 | $1,750 | $1.45 | 21d | 1 | 0.80mi |
| 115 Beal Pkwy NW Fort Walton Beach, FL | 2.0 | 2.5 | 1440 | $1,995 | $1.39 | 43d | 1 | 0.84mi |
| 1850 Stella Ln Unit 4-411 Fort Walton Beach, FL | 2.0 | 2.0 | 980 | $1,650 | $1.68 | 13d | 1 | 0.88mi |
| 1850 Stella Ln Unit 4-417 Fort Walton Beach, FL | 2.0 | 2.0 | 980 | $1,800 | $1.84 | 43d | 1 | 0.88mi |
| 1861 Stella Ln Fort Walton Beach, FL | 2.0 | 2.0 | 980 | $1,650 | $1.68 | 13d | 5 | 0.89mi |
| 413 Sea Rover Ln NW Unit F Fort Walton Beach, FL | 2.0 | 1.5 | 1035 | $1,600 | $1.55 | 21d | 1 | 0.92mi |
| 413 Sea Rover Ln NW Unit F Fort Walton Beach, FL | 2.0 | 1.5 | 1035 | $1,600 | $1.55 | 13d | 1 | 0.92mi |
| 1855 Stella Ln Unit 6-617 Fort Walton Beach, FL | 2.0 | 2.0 | 980 | $1,650 | $1.68 | 13d | 1 | 0.94mi |
| 1851 Stella Ln Unit 5-538 Fort Walton Beach, FL | 2.0 | 2.0 | 980 | $1,650 | $1.68 | 13d | 1 | 0.94mi |
| 607 W Sunset Blvd Unit B Fort Walton Beach, FL | 2.0 | 1.0 | 840 | $1,600 | $1.90 | 21d | 1 | 1.00mi |
| 1863 Norwood Ct Unit 4 Fort Walton Beach, FL | 2.0 | 2.0 | 960 | $1,350 | $1.41 | 43d | 1 | 1.10mi |
| 646 Virginia Oak Ct Fort Walton Beach, FL | 2.0 | 1.5 | 1278 | $1,545 | $1.21 | 13d | 1 | 1.11mi |
| 645 Virginia Oak Ct Fort Walton Beach, FL | 2.0 | 1.5 | 1254 | $1,900 | $1.52 | 13d | 1 | 1.12mi |
| 210 Pelham Rd Fort Walton Beach, FL | 1.0–2.0 | 1.0 | 809 | $1,500 | $1.85 | 13d | 2 | 1.12mi |
| 1855 Norwood Ct Fort Walton Beach, FL | 2.0 | 2.0 | 960 | $1,400 | $1.46 | 43d | 1 | 1.13mi |
| 1855 Norwood Ct #5 Fort Walton Beach, FL | 2.0 | 2.0 | 960 | $1,350 | $1.41 | 43d | 1 | 1.13mi |
| 1850 Norwood Ct Unit 2 Fort Walton Beach, FL | 2.0 | 2.0 | 960 | $1,350 | $1.41 | 21d | 1 | 1.13mi |
| 1851 Norwood Ct Unit 4 Fort Walton Beach, FL | 2.0 | 2.0 | 960 | $1,350 | $1.41 | 21d | 1 | 1.14mi |
| 5 Laguna St #104 Fort Walton Beach, FL | 2.0 | 2.0 | 1269 | $2,575 | $2.03 | 44d | 1 | 1.28mi |
| 337 Lewis St Unit F Fort Walton Beach, FL | 2.0 | 1.0 | 864 | $1,225 | $1.42 | 43d | 1 | 1.34mi |
| 101 Church Ave SE Unit 204 Fort Walton Beach, FL | 2.0 | 1.0 | 945 | $1,676 | $1.77 | 43d | 1 | 1.34mi |
| 140 Opp Blvd NE Fort Walton Beach, FL | 2.0 | 1.5 | 896 | $1,750 | $1.95 | 43d | 1 | 1.34mi |
| 103 Church Ave SE Unit B Fort Walton Beach, FL | 2.0 | 1.0 | 930 | $1,300 | $1.40 | 21d | 1 | 1.34mi |
| 706 Shady Lane Dr Unit D Fort Walton Beach, FL | 2.0 | 1.0 | 900 | $1,650 | $1.83 | 21d | 1 | 1.36mi |
| 706 Shady Lane Dr Unit D Fort Walton Beach, FL | 2.0 | 1.0 | 900 | $1,650 | $1.83 | 13d | 1 | 1.36mi |
| 706 Shady Lane Dr Unit B Fort Walton Beach, FL | 2.0 | 1.0 | 900 | $1,680 | $1.87 | 43d | 1 | 1.36mi |
| 706 Shady Lane Dr Unit C Fort Walton Beach, FL | 2.0 | 1.0 | 900 | $1,600 | $1.78 | 13d | 1 | 1.36mi |
| 120 Opp Blvd NE Fort Walton Beach, FL | 2.0 | 1.5 | 1240 | $1,700 | $1.37 | 21d | 1 | 1.39mi |
| 604 Colonial Dr Fort Walton Beach, FL | 1.0–2.0 | 1.0–2.0 | 818 | $1,624 | $1.99 | 43d | 1 | 1.39mi |
| 115 Hughes St NE Unit D2 Fort Walton Beach, FL | 2.0 | 1.0 | 1066 | $1,900 | $1.78 | 21d | 1 | 1.39mi |
| 805 Hayley Marie Ct Fort Walton Beach, FL | 2.0 | 2.0 | 1095 | $1,650 | $1.51 | 43d | 1 | 1.47mi |
| 940 Santa Rosa Blvd Fort Walton Beach, FL | 2.0 | 2.0 | 1000 | $2,200 | $2.20 | 21d | 4 | 1.48mi |
Listing history 7 events
-
2026-06-18days on market $179,900 Active 8 DOM
-
2026-06-17days on market $179,900 Active 7 DOM
-
2026-06-16days on market $179,900 Active 6 DOM
-
2026-06-15days on market $179,900 Active 5 DOM
-
2026-06-14days on market $179,900 Active 3 DOM
-
2026-06-13remarks 493-char remark
-
2026-06-13$179,900 Active 2 DOM
ⓘ Source: listings_history table (triggers on properties + properties_extension) + one-shot
backfill from property_details.listing_events for pre-trigger history.
Climate risk First Street
- Flood 1/10 Low FEMA zone X (unshaded) · 0% chance over 30 yrs
- Wildfire 1/10 Low
- Heat 10/10 Extreme 7 d/yr ≥104°F today · 22 d/yr by 30 yrs out
- Wind 9/10 Extreme 99% chance of damaging wind over 30 yrs
- Air quality 2/10 Low 1 unhealthy d/yr today · 2 by 30 yrs out
Nearby sold comps map
Loading sold comps map…
Walkable amenities ~0.75 mi
Loading nearby amenities…
Taxation est. · year 1
- Rental income
- $21,565
- − Mortgage interest
- −$10,077
- − Property taxes
- −$2,698
- − Insurance
- −$900
- − Repairs & maintenance
- −$1,725
- − Management
- −$1,725
- − Depreciation
- −$5,233
- Taxable loss
- −$794
- Est. tax savings @ 24.0%
- +$191
- After-tax cash flow
- $2,308/yr
For passive investors: Depreciation is non-cash, so a rental often shows a tax loss while cash-flowing — sheltering income. Rental losses are passive: they offset passive income freely, and up to $25,000/yr can offset ordinary (W-2) income if you actively participate and your MAGI is under $100k (phasing out to $0 by $150k); unused losses carry forward. On sale, claimed depreciation is recaptured at up to 25%, and gains may owe capital-gains tax (a 1031 exchange can defer both). Figures are a year-1 estimate at your 24.0% rate — not tax advice; consult a CPA.
Schools (NCES district)
- District
- Okaloosa
- NCES district ID
- 1201380
- Math proficiency
- 60% ▼ -12.00%
- Reading proficiency
- 60% ▼ -4.00%
- Median HH income
- $55,601
- Composite
- 51.62/100
- National rank
- #1705
- State rank
- #12 of 73 in FL
Livability — Fort Walton Beach
- Score
- 80/100
- State rank
- #111
- US rank
- #1628
Category grades
Schools grade is shown separately in the Schools card above.
Census & demographics
- Census place
- Fort Walton Beach, FL
- County
- Okaloosa County · 194,352 people
- City population
- 59,301
- Metro
- Crestview-Fort Walton Beach-Destin, FL
- Population (ZIP)
- 23,774
- Household income
- $65,342
- Rent vs Own
- Severe rent burden
- 889.0
Population outlook (Okaloosa County) Hauer SSP2
- Today (2025)
- 235,133 people
- By 2030
- 253,483 · +7.8%
- By 2040
- 289,537 · +23.1%
- By 2050
- 322,954 · +37.3%
- By 2075
- 399,624 · +70.0%
- By 2100
- 425,311 · +80.9%
Race, ethnicity, and origin ACS 2023
- Neighborhood character
- Diverse neighborhood (Simpson 0.57)
- Race & ethnicity
- White 63% Hispanic / Latino 13% Black 12% Two or more races 9% Asian 6%
- Hispanic origin (detail)
- Mexican 4% Puerto Rican 2%
- Common ancestry
- Italian 4% Slovak 3% Romanian 2%
- Foreign-born
- 12% · Canada, Jamaica
- Languages at home
- 84% English-only · Spanish 9% Other Asian/Pacific 3% Other Indo-European 1%
Political lean MEDSL · Okaloosa
- 2024 margin
- Solid R (+42.4) · D 28.2% · R 70.7% · Other 1.1%
- 2008→2024 swing
- +2.5pp toward D · 2008: -44.9pp · 2024: -42.4pp
- All cycles
- 2024: R+42.4 2020: R+39.1 2016: R+47.8 2012: R+49.4 2008: R+44.9
Not yet ingested
- Civics
- —
Market trends
- HPI YoY
- ▼ -123.88%
- Current HPI
- 274.8418
- Rent YoY
- ▲ 1.33%
- Metro
- Crestview-Fort Walton Beach-Destin, FL
- State GDP YoY
- ▲ 3.28%
- F500 in state
- 36
Industry mix (Fortune 500 HQ in FL)
| Industry | F500 HQs | Revenue |
|---|---|---|
| Industrial Technology | 2 | $29B |
|
||
| Insurance | 2 | $17B |
|
||
| Retail | 1 | $60B |
|
||
| Technology Distribution | 1 | $58B |
|
||
| Homebuilding | 1 | $35B |
|
||
| Technology Manufacturing | 1 | $35B |
|
||
Price history
+260.5% since first listed4 events — show timeline
- 2026-06-10 Listed $179,900 ECAR
- 1998-04-27 Sold (Public Records) $49,900 Public Records
- 1998-04-27 Sold (Public Records) $49,900 Public Records
- 1997-10-24 Listed $49,900 ECAR
Property tax history
-5.9%/yrLatest (2025): $258 · +4.8% YoY. Source: county tax records.
Cash-flow waterfall
monthlySold comps — $/sqft
last 12 mo · ≤1 miLoading sold comps…