1 Mcmartin St · Johnstown, NY
Flood risk 1/10 · Minimal
- FEMA flood zone
- X
- Chance of flooding over 30 yrs
- 0.0%
- Est. flood insurance / yr
- $473 – $860
Fire risk 1/10 · Minimal
- Est. fire insurance / yr
- $691 – $1,283
Heat risk 2/10 · Minimal
- Hot days now (above 94°F)
- 7 days/yr
- Hot days in 30 yrs
- 16 days/yr
Wind risk 2/10 · Minimal
- Chance of severe wind over 30 yrs
- 3.0%
Air-quality risk 1/10 · Minimal
- Unhealthy air days now
- 0 days/yr
- Unhealthy air days in 30 yrs
- 0 days/yr
Risk factors via First Street. Map © Google.
Why this score? — see what drove the A grade
The composite is a weighted blend of 9 inputs, each scored 0–100. Each bar is that input's sub-score; the figure is the points it added to the 100-point composite (weight × sub-score).
- Cash flow +30.0/30.0
- ARV discount +15.0/15.0
- 1% rule +10.0/10.0
- DSCR +10.0/10.0
- Appreciation +10.0/10.0
- Livability +3.9/5.0
- Schools +3.5/10.0
- Rent growth +2.5/5.0
- Condition / age +2.5/5.0
$99,000
🖨 Deal sheet 📄 Offer letter ✓ Due diligence
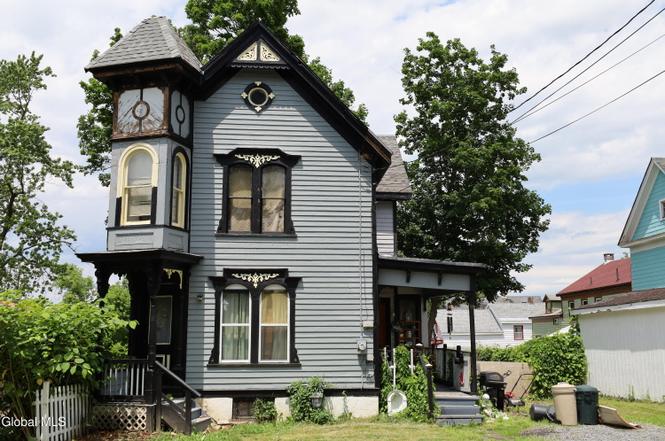
Listing remarks
Affordable Johnstown Victorian: Spacious inviting and grand despite years of distress, the curb appeal is still visible in the intricate crafted details not found in modern homes. The layout is spacious and the many tall windows invite sunlight all day long. First floor has a half bath plus a laundry room with a soaker tub. There is a large unfinished room off of the rear of the house - potential for expanding the kitchen or making a downstairs bedroom. Three upstairs bedrooms share a full bath. Access to a walk-up attic for storage. The easy to maintain yard offers space for entertaining, gardening or a pet to romp. Bring your tools and inspiration and start a new beginning here. Interior
Key facts
- Tall windows
- Half bath
- Laundry room
Tags
Property features AI
Exterior
- Parking: Stone parking area for 2 vehicles
- Security: Smoke detector(s); Carbon monoxide detector(s)
- Utilities: Public water; Public sewer; 100 amp electrical service
- Home design: Single family residence; Entry level: First floor
- Construction: Wood siding; Stone foundation; Below-grade finished area present
- Exterior features: Asphalt roof; Back yard fencing
Interior
- Kitchen: Electric oven; Refrigerator
- Bedrooms: Three bedrooms located on the second floor
- Bathrooms: One full bathroom on the second floor; One half bathroom on the first floor
- Heating & cooling: Natural gas heating
- Interior features: Smoke and carbon monoxide detectors; Unfinished basement; Six total rooms
- Laundry & utility: Laundry area on the main level
Neighborhood map
What this means for you Summary
Snapshot
- This is a 3-bed/1.0-bath single-family listed at $99k.
Deal economics
- At list price, monthly cash flow is $480 ($6k/yr) — positive.
- The deal already cash-flows at list — no discount required.
- Meets the 1% rule at list price ($2k rent vs $99k).
- Cap rate 12.1% vs local median 4.0% in Johnstown — top-decile yield for the area; either an underpriced asset or a hidden risk that comps aren't pricing in. Stress-test before assuming the spread holds.
Location & tenants
- Location reads 78/100 on livability (#168 in NY, #2,603 nationally) — a middle-class / working-renter tenant base. Strengths: housing A+, health & safety A+, cost of living A; Watch: crime D-, amenities D-.
- Johnstown City School District (town): math 35% / reading 47% proficiency, ranked #509 of 590 in NY (top 86%) — families likely to look elsewhere, expect single-tenant / working-renter base with shorter leases.
- Market conditions: 82 active listings in the ZIP; 112 units permitted in Fulton County in 2024 (50 in 5+ unit buildings).
Forward outlook
- In year one you build about $11k of equity ($684 loan paydown + $10k appreciation (10.0% local appreciation)).
- Fulton County population projected at -23% by 2050 — secular population decline; favor cash flow + early exit over multi-decade hold.
- At projected returns (10.0% appreciation + 3.0% rent growth), your $28k cash investment doubles in ~2 years — after that, you're playing with house money.
- By year 4, paydown + projected appreciation supports a ~$38k cash-out refi (75% LTV) — recoverable capital for the next deal without selling this one.
Negotiation context
- Only 1 days on market — expect competitive offers; lowballing is unlikely to land.
- 4 sale attempts since 21y ago with the ask held roughly flat each time — persistent listings suggest the price (not the market) is what's stuck; bring a comps-based counter.
- Current owner paid $40k; list at $99k implies a 148% gain — meaningful room to come down on a strong offer.
Risks & watch-outs
- Watch-outs: built in 1900 — expect roof / HVAC / electrical / plumbing capex.
Questions for the listing agent
- Built in 1900 — when were the roof, HVAC, electrical panel, plumbing, and water heater last replaced?
- Is there a deadline driving the sale (1031 exchange, divorce, estate, relocation)? That informs how much negotiation room exists.
- Crime grade is D in this area — have there been break-ins, vandalism, or insurance claims at this property in the last 3 years? What carrier currently insures it and at what premium?
- What's the average days-on-market for RENTAL listings here right now (not sales)? A rising rental-DOM trend means longer vacancies and softer asking-rent achievability than the comps imply.
- What's the recent tenant-quality profile in this submarket — average credit score on applications, eviction rate, late-payment / NSF rate, and stable-employment percentage? A property-management company in the area should have these aggregated.
- How much new for-sale + rental construction is in the pipeline within 1–3 miles? Heavy new supply typically softens prices + rents 12–24 months out; constrained supply supports both.
Investment metrics
- 1% rule
- 1.52% ✓
- Cap rate
- 12.11%
- Cash-on-cash
- 20.76%
- DSCR
- 1.92
- GRM
- 5.5
CMA / ARV
- ARV (on-the-fly)
- $151,335
- Comps found
- 12
Show comp detail 12 sales within ~0.75 mi
| Address | Dist | Beds/Ba | Sqft | Sold | Price | $/sf | Match |
|---|---|---|---|---|---|---|---|
| 22 Wells St | 0.21mi | 4/1.0 (+1) | 1,486 (-7%) | 9mo | $22,500 | $15 | 67 |
| 312 S Perry St | 0.57mi | 3/1.0 | 1,650 (+4%) | 1mo | $140,000 | $85 | 67 |
| 44 S Perry St | 0.33mi | 3/1.5 | 1,418 (-11%) | 2mo | $68,000 | $48 | 63 |
| 107 E Montgomery St | 0.61mi | 4/1.5 (+1) | 1,612 (+1%) | 3mo | $275,000 | $171 | 60 |
| 6 Mason St | 0.55mi | 3/1.0 | 1,422 (-11%) | 2mo | $50,119 | $35 | 55 |
| 502 S Market St | 0.67mi | 3/1.5 | 1,536 (-4%) | 9mo | $234,900 | $153 | 54 |
| 214 N Chase St | 0.65mi | 3/1.0 | 1,458 (-8%) | 3mo | $130,000 | $89 | 53 |
| 2 S Chase St | 0.65mi | 3/1.5 | 1,474 (-8%) | 6mo | $149,900 | $102 | 50 |
| 12 Cady St | 0.60mi | 3/1.0 | 1,776 (+12%) | 4mo | $81,000 | $46 | 50 |
| 225 N Chase St | 0.64mi | 3/1.0 | 1,408 (-12%) | 2mo | $240,000 | $170 | 49 |
| 110 E Montgomery St | 0.62mi | 3/1.5 | 1,365 (-14%) | 2mo | $270,000 | $198 | 43 |
| 8 Rosewood Ave | 0.72mi | 3/1.0 | 1,782 (+12%) | 7mo | $170,000 | $95 | 41 |
Match score weights: distance 35% · size 25% · config 20% · recency 20%. Top-matched comps best support the ARV.
Projected returns pro-forma
10.0% appreciation · 3.0% rent growth · sell at horizon
- IRR
- 39.8%
- Equity multiple
- 4.05×
- Total profit
- $84,499
- Equity at exit
- $89,187
- IRR
- 34.3%
- Equity multiple
- 9.11×
- Total profit
- $224,894
- Equity at exit
- $192,335
Cash invested: $27,720 (down + closing). Projections, not guarantees.
Landlord ↔ Tenant lean methodology
- Overall (STATE)
- 15 Strongly Tenant-Friendly
- State New York
- 15 Strongly Tenant-Friendly · D+10
- County
- — inherits STATE
- City
- — inherits STATE
ZIP-level market 12095
- Home prices YoY
- 3.8%
- Active inventory
- 82
- Price-to-rent
- 5.5×
Monthly cashflow live
- Estimated rent
- $1,506 medium interval (Pro) →
- Mortgage (P&I)
- −$519
- Tax from tax record
- −$150 /mo · $1,798/yr
- Insurance
- −$41
- HOA
- −$0
- Vacancy / Maint / Mgmt
- −$316
- Net cashflow
- $480
Break-even live
UW: 25.0% down · 7.5% · 30yr · 1.5% tax · 5.0% vac · 8.0% maint · 8.0% mgmt
Financing live
Cash to close
- Down payment
- $24,750
- Closing costs
- $2,970
- Reserves months
- —
- Total cash needed
- —
Loan-product check · same deal, 3 products live
Conventional
25% down · 7.5% · 30yr
- Down + closing
- —
- Monthly P&I
- —
- Monthly cashflow
- —
- DSCR
- —
- Eligible?
- —
Personal DTI + credit; lowest rate.
DSCR
20% down · 8.5% · 30yr
- Down + closing
- —
- Monthly P&I
- —
- Monthly cashflow
- —
- DSCR
- —
- Eligible?
- —
No personal income docs; deal must DSCR.
Hard money
10% down · 12.0% · 12mo
- Down + closing
- —
- Monthly P&I
- —
- Monthly cashflow
- —
- DSCR
- —
- Eligible?
- —
Short-term bridge; refi at stabilization.
Listing history 2 events
-
2026-06-18remarks 699-char remark
-
2026-06-18$99,000 Active 1 DOM
ⓘ Source: listings_history table (triggers on properties + properties_extension) + one-shot
backfill from property_details.listing_events for pre-trigger history.
Tax reassessment forecast NY · Partial reset (capped growth)
- Current annual tax
- $1,798 · $150/mo
- Projected year-2 tax
- $1,798 · $150/mo
- Expected delta
- $0/yr ($0/mo · 0.0%)
ⓘ Screening estimate from a state-policy table — verify with the county assessor before closing.
Climate risk First Street
- Flood 1/10 Low FEMA zone X · 0% chance over 30 yrs
- Wildfire 1/10 Low
- Heat 2/10 Low 7 d/yr ≥94°F today · 16 d/yr by 30 yrs out
- Wind 2/10 Low 3% chance of damaging wind over 30 yrs
- Air quality 1/10 Low 0 unhealthy d/yr today · 0 by 30 yrs out
Nearby sold comps map
Loading sold comps map…
Walkable amenities ~0.75 mi
Loading nearby amenities…
Taxation est. · year 1
- Rental income
- $18,072
- − Mortgage interest
- −$5,546
- − Property taxes
- −$1,798
- − Insurance
- −$495
- − Repairs & maintenance
- −$1,446
- − Management
- −$1,446
- − Depreciation
- −$2,880
- Taxable income
- $4,463
- Est. tax owed @ 24.0%
- −$1,071
- After-tax cash flow
- $4,683/yr
For passive investors: Depreciation is non-cash, so a rental often shows a tax loss while cash-flowing — sheltering income. Rental losses are passive: they offset passive income freely, and up to $25,000/yr can offset ordinary (W-2) income if you actively participate and your MAGI is under $100k (phasing out to $0 by $150k); unused losses carry forward. On sale, claimed depreciation is recaptured at up to 25%, and gains may owe capital-gains tax (a 1031 exchange can defer both). Figures are a year-1 estimate at your 24.0% rate — not tax advice; consult a CPA.
Schools (NCES district)
- District
- Johnstown City School District
- NCES district ID
- 3615980
- Math proficiency
- 35% ▼ -8.00%
- Reading proficiency
- 47% ▲ 4.00%
- Median HH income
- $45,999
- Composite
- 34.89/100
- National rank
- #5082
- State rank
- #509 of 590 in NY
Livability — Johnstown
- Score
- 78/100
- State rank
- #168
- US rank
- #2603
Category grades
Schools grade is shown separately in the Schools card above.
Census & demographics
- Census place
- Johnstown, NY
- Population (ZIP)
- 12,013
Population outlook (Fulton County) Hauer SSP2
- Today (2025)
- 51,132 people
- By 2030
- 49,114 · -3.9%
- By 2040
- 44,373 · -13.2%
- By 2050
- 39,321 · -23.1%
- By 2075
- 28,503 · -44.3%
- By 2100
- 19,268 · -62.3%
Race, ethnicity, and origin ACS 2023
- Neighborhood character
- Predominantly White (90%)
- Race & ethnicity
- White 90% Hispanic / Latino 4% Two or more races 4% Black 2%
- Common ancestry
- Iranian 6% Romanian 5% Lithuanian 4%
- Foreign-born
- 2% · Canada
- Languages at home
- 97% English-only · Spanish 2%
Political lean MEDSL · Fulton
- 2024 margin
- Solid R (+35.9) · D 32.1% · R 67.9%
- 2008→2024 swing
- -26.6pp toward R · 2008: -9.2pp · 2024: -35.9pp
- All cycles
- 2024: R+35.9 2020: R+31.4 2016: R+35.5 2012: R+10.5 2008: R+9.2
Not yet ingested
- Civics
- —
Market trends
- HPI YoY
- ▲ 10.82%
- Current HPI
- 297.365
- Rent YoY
- —
- Metro
- —
- State GDP YoY
- ▲ 2.60%
- F500 in state
- 92
Industry mix (Fortune 500 HQ in NY)
| Industry | F500 HQs | Revenue |
|---|---|---|
| Financial Services | 10 | $950B |
|
||
| Consumer Goods | 9 | $162B |
|
||
| Insurance | 4 | $225B |
|
||
| Telecommunications | 2 | $144B |
|
||
| Pharmaceuticals | 2 | $112B |
|
||
| Media / Entertainment | 2 | $69B |
|
||
Price history
+161.2% since first listed10 events — show timeline
- 2026-06-17 Listed $99,000 Global MLS
- 2023-11-01 Listing Removed — Global MLS
- 2023-09-26 Price Changed $87,500 Global MLS
- 2023-07-20 Listed $90,000 Global MLS
- 2020-04-17 Listing Removed — Global MLS
- 2020-02-21 Listed $45,000 Global MLS
- 2006-12-07 Sold (Public Records) $39,900 Public Records
- 2006-12-01 Sold (MLS) $45,000 Global MLS
- 2005-10-18 Listing Removed — Global MLS
- 2005-08-24 Listed $37,900 Global MLS
Property tax history
+7.8%/yrLatest (2025): $1,798 · +5.8% YoY. Source: county tax records.
Cash-flow waterfall
monthlySold comps — $/sqft
last 12 mo · ≤1 miLoading sold comps…