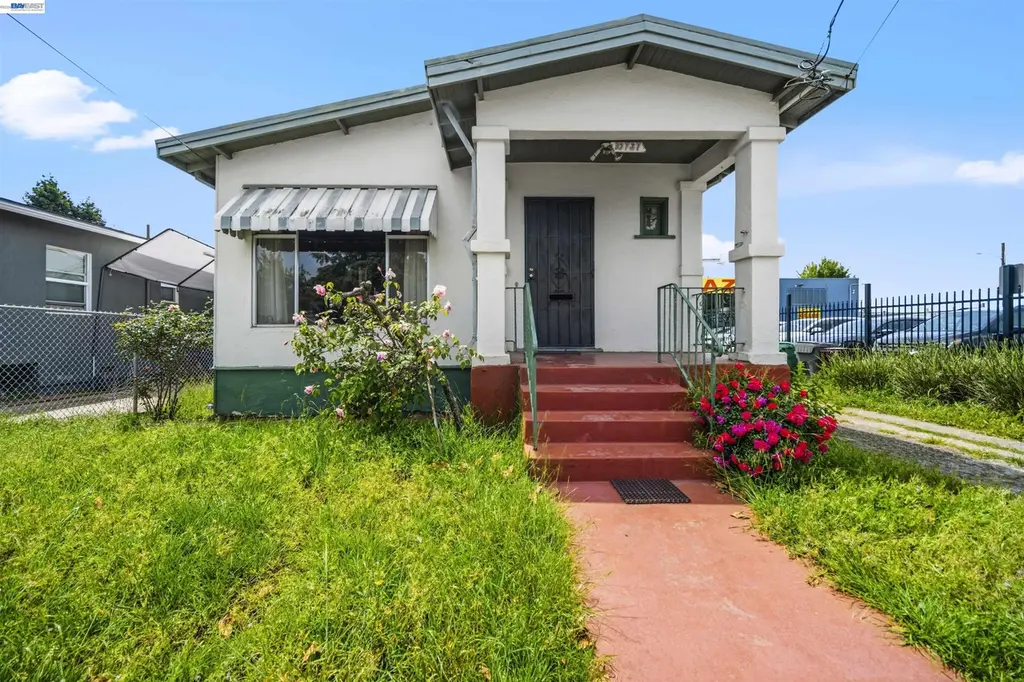
10737 Pearmain St · Oakland, CA
Flood risk 1/10 · Minimal
- FEMA flood zone
- X (unshaded)
- Chance of flooding over 30 yrs
- 0.0%
- Est. flood insurance / yr
- $507 – $1,088
Fire risk 1/10 · Minimal
- Est. fire insurance / yr
- $659 – $1,223
Heat risk 3/10 · Minor
- Hot days now (above 84°F)
- 7 days/yr
- Hot days in 30 yrs
- 15 days/yr
Wind risk 1/10 · Minimal
- Chance of severe wind over 30 yrs
- —
Air-quality risk 8/10 · Major
- Unhealthy air days now
- 14 days/yr
- Unhealthy air days in 30 yrs
- 14 days/yr
Risk factors via First Street. Map © Google.
Why this score? — see what drove the D grade
The composite is a weighted blend of 9 inputs, each scored 0–100. Each bar is that input's sub-score; the figure is the points it added to the 100-point composite (weight × sub-score).
- ARV discount +15.0/15.0
- Cash flow +11.8/30.0
- Livability +3.6/5.0
- DSCR +3.5/10.0
- Schools +3.0/10.0
- Rent growth +2.9/5.0
- 1% rule +2.6/10.0
- Condition / age +2.5/5.0
- Appreciation +0.0/10.0
$299,000
🖨 Deal sheet (PDF) 📄 Offer letter ✓ Due diligence
Listing remarks
First time on the market in decades, 10737 Pearmain St presents a rare opportunity to reimagine and add value in Oakland. This 2-bedroom, 1-bath home is full of potential and ready for its next chapter. Featuring a functional floor plan, detached garage, and a generous lot with possible ADU or expansion potential. This cosmetic fixer offers the perfect canvas for investors, contractors, or buyers looking to build sweat equity. Conveniently located near I-880, BART, and local amenities, the property combines accessibility with upside potential. Whether you’re looking to renovate and resell, create a long-term rental investment, or customize a home to your taste, opportunities like this
Key facts
- Generous lot
- Possible adu
- Expansion potential
Tags
Property features AI
Exterior
- Parking: Detached covered parking; 1 garage space
- Utilities: Public water; Public sewer
- Home design: Single family residence; Residential property; Built in 1923
- Construction: Stucco construction; Shingle roof; Built in 1923
- Exterior features: Back yard; Level lot
Interior
- Kitchen: No kitchen features specified
- Bedrooms: Total of 4 rooms (bedroom breakdown not specified)
- Flooring: Vinyl flooring; Carpet flooring
- Bathrooms: 1 full bathroom
- Heating & cooling: Floor furnace heating
- Interior features: No additional rooms listed; One fireplace located in the living room
- Laundry & utility: Washer included
Neighborhood map
What this means for you Summary
Snapshot
- This is a 2-bed/1.0-bath single-family listed at $299k.
Deal economics
- At list price, monthly cash flow is $-85 ($-1k/yr) — negative.
- To cash-flow at today's rent, offer at most $284k (5.0% below list).
- To meet the 1% rule (rent ≥ 1% of price), the offer needs to be $227k (24.2% below list).
- Recommended offer: $227k (24.2% below list) — sets the bar for 1% rule.
- Cap rate 6.0% vs local median 2.5% in Oakland — top-decile yield for the area; either an underpriced asset or a hidden risk that comps aren't pricing in. Stress-test before assuming the spread holds.
Location & tenants
- Location reads 71/100 on livability (#224 in CA) — a middle-class / working-renter tenant base. Strengths: amenities A+, commute A+, employment A+; Watch: crime F, cost of living F.
- Oakland Unified (urban): math 27% / reading 33% proficiency, ranked #1,007 of 1,400 in CA (top 72%) — families likely to look elsewhere, expect single-tenant / working-renter base with shorter leases; 68% free/reduced lunch — lower-income household profile, screen leases tightly.
- Zoned schools: Esperanza Elementary (422 students, 96% FRL); Castlemont High (680 students, 98% FRL) — zoned schools average 97% FRL vs 68% district-wide (29 pts higher); higher-poverty schools than district average — tighter screening recommended.
- Market conditions: Rents rising (+1.6%/yr); 98 active listings in the ZIP; 40 comparable units currently listed for rent nearby; rentals at typical pace (median 26d on market — plan ~3-4 weeks tenant-placement turnaround); 45% of comp listings sitting > 30 days — soft ceiling on asking rent; solid renter incomes; 1,742 units permitted in Alameda County in 2024 (856 in 5+ unit buildings).
- This rent runs 35% of the median local income ($77k/yr) — at the standard rent-burdened threshold; future hikes will face affordability resistance.
Forward outlook
- Local home prices are declining (-3.0%/yr); year-one equity from $2k of loan paydown is wiped out by about $9k of value loss. Plan a longer hold.
- Alameda County population projected at +34% by 2050 — long-run rental-demand tailwind backs the buy-and-hold thesis.
Negotiation context
- Only 10 days on market — expect competitive offers; lowballing is unlikely to land.
Risks & watch-outs
- Watch-outs: built in 1923 — expect roof / HVAC / electrical / plumbing capex.
Questions for the listing agent
- What do current leases actually rent for vs. the listed asking? Can we see a recent rent roll and the last 12 months of T-12 income?
- Built in 1923 — when were the roof, HVAC, electrical panel, plumbing, and water heater last replaced?
- Is there a deadline driving the sale (1031 exchange, divorce, estate, relocation)? That informs how much negotiation room exists.
- Crime grade is F in this area — have there been break-ins, vandalism, or insurance claims at this property in the last 3 years? What carrier currently insures it and at what premium?
- The area grade is low — what's the realistic commute time and amenity access for the typical tenant pool here? Any planned neighborhood developments (good or bad) we should know about?
- What's the average days-on-market for RENTAL listings here right now (not sales)? A rising rental-DOM trend means longer vacancies and softer asking-rent achievability than the comps imply.
- What's the recent tenant-quality profile in this submarket — average credit score on applications, eviction rate, late-payment / NSF rate, and stable-employment percentage? A property-management company in the area should have these aggregated.
- How much new for-sale + rental construction is in the pipeline within 1–3 miles? Heavy new supply typically softens prices + rents 12–24 months out; constrained supply supports both.
Investment metrics
- 1% rule
- 0.76% ✗
- Cap rate
- 5.95%
- Cash-on-cash
- -1.21%
- DSCR
- 0.95
- GRM
- 11.0
CMA / ARV
- ARV (median comp)
- $554,791
- List price
- $299,000
- Delta
- -46.11%
- Verdict
- UNDERPRICED
- Comps
- 20 within 1.0 mi
Show comp detail 12 sales within ~0.75 mi
| Address | Dist | Beds/Ba | Sqft | Sold | Price | $/sf | Match |
|---|---|---|---|---|---|---|---|
| 10737 Pearmain St | 0.00mi | 2/1.0 | 790 (0%) | 0mo | $355,000 | $449 | 100 |
| 10489 Nattress Way | 0.36mi | 2/1.0 | 825 (+4%) | 10mo | $515,000 | $624 | 68 |
| 432 Hale Ave | 0.32mi | 2/1.0 | 743 (-6%) | 10mo | $426,000 | $573 | 67 |
| 210 Kerwin Ave | 0.49mi | 2/1.0 | 809 (+2%) | 11mo | $500,000 | $618 | 64 |
| 430 Douglas | 0.41mi | 2/1.0 | 736 (-7%) | 12mo | $525,000 | $713 | 60 |
| 408 Burlwood Ave | 0.65mi | 2/1.0 | 782 (-1%) | 12mo | $495,000 | $633 | 59 |
| 342 Caswell Ave | 0.68mi | 2/1.0 | 782 (-1%) | 11mo | $425,000 | $543 | 57 |
| 1257 104th Ave | 0.48mi | 2/1.0 | 902 (+14%) | 6mo | $340,000 | $377 | 49 |
| 9638 E St | 0.70mi | 2/1.0 | 864 (+9%) | 4mo | $565,000 | $654 | 49 |
| 784 Douglas Dr | 0.55mi | 2/1.0 | 885 (+12%) | 7mo | $735,000 | $831 | 48 |
| 201 Kerwin Ave | 0.51mi | 3/1.0 (+1) | 884 (+12%) | 8mo | $550,000 | $622 | 45 |
| 1308 103rd Ave | 0.55mi | 2/1.0 | 904 (+14%) | 8mo | $352,000 | $389 | 44 |
Match score weights: distance 35% · size 25% · config 20% · recency 20%. Top-matched comps best support the ARV.
Projected returns pro-forma
-3.0% appreciation · 1.58% rent growth · sell at horizon
- IRR
- -19.8%
- Equity multiple
- 0.32×
- Total profit
- $-57,123
- Equity at exit
- $44,582
- IRR
- -15.7%
- Equity multiple
- 0.17×
- Total profit
- $-69,764
- Equity at exit
- $25,852
Cash invested: $83,720 (down + closing). Projections, not guarantees.
Landlord ↔ Tenant lean methodology
- Overall (CITY)
- 0 Strongly Tenant-Friendly
- State California
- 18 Strongly Tenant-Friendly · D+13
- County
- — inherits STATE
- City Oakland
- 0 Strongly Tenant-Friendly · D+62
ZIP-level market 94603
- Rents YoY
- 1.6%
- Active inventory
- 98
- Price-to-rent
- 11.0×
Monthly cashflow live
- Estimated rent
- $2,267 high interval (Pro) →
- Mortgage (P&I)
- −$1,568
- Tax from tax record
- −$183 /mo · $2,200/yr
- Insurance
- −$125
- HOA
- −$0
- Vacancy / Maint / Mgmt
- −$476
- Net cashflow
- $-85
Break-even live
Sensitivity live
| Price | -10% $85 | -5% $0 | +0% $-85 | +5% $-169 | +10% $-254 |
|---|---|---|---|---|---|
| Rent | -10% $-264 | -5% $-174 | +0% $-85 | +5% $5 | +10% $94 |
| Rate | -1.0pp $66 | -0.5pp $-9 | base $-85 | +0.5pp $-162 | +1.0pp $-241 |
UW: 25.0% down · 7.5% · 30yr · 1.5% tax · 5.0% vac · 8.0% maint · 8.0% mgmt
Financing live
Cash to close
- Down payment
- $74,750
- Closing costs
- $8,970
- Reserves months
- —
- Total cash needed
- —
Loan-product check · same deal, 3 products live
Conventional
25% down · 7.5% · 30yr
- Down + closing
- —
- Monthly P&I
- —
- Monthly cashflow
- —
- DSCR
- —
- Eligible?
- —
Personal DTI + credit; lowest rate.
DSCR
20% down · 8.5% · 30yr
- Down + closing
- —
- Monthly P&I
- —
- Monthly cashflow
- —
- DSCR
- —
- Eligible?
- —
No personal income docs; deal must DSCR.
Hard money
10% down · 12.0% · 12mo
- Down + closing
- —
- Monthly P&I
- —
- Monthly cashflow
- —
- DSCR
- —
- Eligible?
- —
Short-term bridge; refi at stabilization.
Rent comps 40 comps
| Address | Beds | Baths | Sqft | Rent | $/sqft | DOM | Units | Dist |
|---|---|---|---|---|---|---|---|---|
| 10786 Pippin St Apt 4 Oakland, CA | 2.0 | 1.0 | 760 | $1,797 | $2.36 | 19d | 1 | 0.09mi |
| 10786 Pippin St Oakland, CA | 2.0 | 1.0 | 760 | $1,977 | $2.60 | 26d | 1 | 0.10mi |
| 548 105th Ave Unit 13 Oakland, CA | 2.0 | 1.0 | 800 | $2,399 | $3.00 | 45d | 1 | 0.23mi |
| 410 Bristol Blvd Unit 410 San Leandro, CA | 2.0 | 1.0 | 800 | $2,150 | $2.69 | 26d | 1 | 0.26mi |
| 1206 105th Ave Oakland, CA | 2.0 | 1.0 | 900 | $2,350 | $2.61 | 45d | 1 | 0.38mi |
| 151 Catron Dr Unit D Oakland, CA | 2.0 | 1.0 | 700 | $1,650 | $2.36 | 16d | 1 | 0.50mi |
| 1463 Tucker St Oakland, CA | 2.0 | 2.0 | 885 | $2,600 | $2.94 | 26d | 1 | 0.66mi |
| 170 Stoakes Ave Unit 9 San Leandro, CA | 2.0 | 1.0 | 900 | $2,295 | $2.55 | 16d | 1 | 0.67mi |
| 170 Stoakes Ave Unit 01 San Leandro, CA | 1.0 | 1.0 | 650 | $2,045 | $3.15 | 45d | 1 | 0.67mi |
| 170 Stoakes Ave Unit 04 San Leandro, CA | 1.0 | 1.0 | 650 | $1,970 | $3.03 | 26d | 1 | 0.67mi |
| 1428 105th Ave Oakland, CA | 1.0–2.0 | 1.0 | 680 | $1,698 | $2.50 | 23d | 1 | 0.67mi |
| 165 Preda St San Leandro, CA | 1.0 | 1.0 | 600 | $1,715 | $2.86 | 45d | 1 | 0.70mi |
| 902 Davis St San Leandro, CA | 1.0–2.0 | 1.0–2.0 | 756 | $2,875 | $3.80 | 1d | 14 | 0.77mi |
| 9903 Walnut St Unit 9903 Oakland, CA | 2.0 | 1.0 | 982 | $2,199 | $2.24 | 23d | 1 | 0.87mi |
| 1001 91st Ave Oakland, CA | 2.0 | 1.0 | 762 | $2,195 | $2.88 | 45d | 1 | 0.98mi |
| 1275 Pacific Ave San Leandro, CA | 1.0 | 1.0 | 680 | $1,775 | $2.61 | 26d | 1 | 0.99mi |
| 150 Haas Ave San Leandro, CA | 2.0 | 1.0 | 930 | $2,400 | $2.58 | 7d | 1 | 1.00mi |
| 9635 Plymouth St Unit 2 Oakland, CA | 2.0 | 1.0 | 620 | $1,595 | $2.57 | 45d | 1 | 1.02mi |
| 1399 Pacific Ave San Leandro, CA | 1.0 | 1.0 | 492 | $1,895 | $3.85 | 45d | 6 | 1.04mi |
| 179 Haas Ave Apt 11 San Leandro, CA | 2.0 | 1.0 | 800 | $2,575 | $3.22 | 45d | 1 | 1.05mi |
| 9719 Cherry St Unit 1 Oakland, CA | 2.0 | 1.0 | 650 | $2,300 | $3.54 | 45d | 1 | 1.05mi |
| 235 Haas Ave San Leandro, CA | 1.0–2.0 | 1.0–2.0 | 684 | $2,665 | $3.89 | 1d | 5 | 1.07mi |
| 1255 Hays St Unit 8 San Leandro, CA | 2.0 | 2.0 | 1050 | $2,295 | $2.19 | 26d | 1 | 1.08mi |
| 1255 Hays St Unit 17 San Leandro, CA | 2.0 | 1.0 | 950 | $2,195 | $2.31 | 45d | 1 | 1.08mi |
| 9317 Walnut St Oakland, CA | 2.0 | 1.0 | 950 | $2,500 | $2.63 | 45d | 1 | 1.10mi |
| 9641 Birch St Apt 3 Oakland, CA | 3.0 | 2.0 | 780 | $2,490 | $3.19 | 26d | 1 | 1.12mi |
| 321 W Estudillo Ave Unit 4 San Leandro, CA | 1.0 | 1.0 | 540 | $1,875 | $3.47 | 46d | 1 | 1.13mi |
| 1510 Timothy Dr San Leandro, CA | 3.0 | 1.0 | 1015 | $4,000 | $3.94 | 25d | 1 | 1.14mi |
| 100 Callan Ave San Leandro, CA | 2.0 | 1.0–2.0 | 687 | $3,911 | $5.69 | 0d | 7 | 1.14mi |
| 1574 Pacific Ave Unit 1580 3 San Leandro, CA | 1.0 | 1.0 | 650 | $1,795 | $2.76 | 45d | 1 | 1.14mi |
| 206 Chumalia St San Leandro, CA | 1.0 | 1.0 | 650 | $1,925 | $2.96 | 5d | 1 | 1.16mi |
| 1540 Orchard Ave San Leandro, CA | 1.0 | 1.0 | 550 | $1,650 | $3.00 | 45d | 1 | 1.16mi |
| 1131 88th Ave Unit B Oakland, CA | 2.0 | 1.0 | 800 | $2,100 | $2.62 | 26d | 1 | 1.16mi |
| 8811 A St Unit 2 Oakland, CA | 2.0 | 1.0 | 1020 | $1,990 | $1.95 | 26d | 1 | 1.18mi |
| 2224 107th Ave Unit 2222 Oakland, CA | 2.0 | 1.0 | 667 | $3,000 | $4.50 | 45d | 1 | 1.19mi |
| 1111 87th Ave Oakland, CA | 2.0 | 1.0 | 900 | $2,395 | $2.66 | 26d | 1 | 1.20mi |
| 1565 Marybelle Ave San Leandro, CA | 1.0 | 1.0 | 900 | $2,500 | $2.78 | 45d | 1 | 1.21mi |
| 424 Callan Ave San Leandro, CA | 1.0–2.0 | 1.0–2.0 | 950 | $2,723 | $2.87 | 22d | 6 | 1.31mi |
| 554 Bancroft Ave San Leandro, CA | 2.0 | 1.0 | 694 | $2,200 | $3.17 | 45d | 1 | 1.32mi |
| 1675 Hays St San Leandro, CA | 1.0–2.0 | 1.5–2.0 | 859 | $2,645 | $3.08 | 45d | 3 | 1.35mi |
Listing history 1 events
-
2026-05-12$299,000 Active 779-char remark
ⓘ Source: listings_history table (triggers on properties + properties_extension) + one-shot
backfill from property_details.listing_events for pre-trigger history.
Tax reassessment forecast CA · Resets to sale price
- Current annual tax
- $2,200 · $183/mo
- Projected year-2 tax
- $2,272 · $189/mo
- Expected delta
- +$72/yr (+$6/mo · 3.3%)
ⓘ Screening estimate from a state-policy table — verify with the county assessor before closing.
Climate risk First Street
- Flood 1/10 Low FEMA zone X (unshaded) · 0% chance over 30 yrs
- Wildfire 1/10 Low
- Heat 3/10 Moderate 7 d/yr ≥84°F today · 15 d/yr by 30 yrs out
- Wind 1/10 Low
- Air quality 8/10 Severe 14 unhealthy d/yr today · 14 by 30 yrs out
Nearby sold comps map
Loading sold comps map…
Walkable amenities ~0.75 mi
Loading nearby amenities…
Taxation est. · year 1
- Rental income
- $27,209
- − Mortgage interest
- −$16,749
- − Property taxes
- −$2,200
- − Insurance
- −$1,495
- − Repairs & maintenance
- −$2,177
- − Management
- −$2,177
- − Depreciation
- −$8,698
- Taxable loss
- −$6,287
- Est. tax savings @ 24.0%
- +$1,509
- After-tax cash flow
- $492/yr
For passive investors: Depreciation is non-cash, so a rental often shows a tax loss while cash-flowing — sheltering income. Rental losses are passive: they offset passive income freely, and up to $25,000/yr can offset ordinary (W-2) income if you actively participate and your MAGI is under $100k (phasing out to $0 by $150k); unused losses carry forward. On sale, claimed depreciation is recaptured at up to 25%, and gains may owe capital-gains tax (a 1031 exchange can defer both). Figures are a year-1 estimate at your 24.0% rate — not tax advice; consult a CPA.
Schools (NCES district)
- District
- Oakland Unified
- NCES district ID
- 0628050
- Math proficiency
- 27% ▬ 0.00%
- Reading proficiency
- 33% ▬ 0.00%
- Median HH income
- $55,194
- Composite
- 29.52/100
- National rank
- #11769
- State rank
- #1007 of 1400 in CA
Livability — Oakland
- Score
- 71/100
- State rank
- #224
- US rank
- #7245
Category grades
Schools grade is shown separately in the Schools card above.
Census & demographics
- Census place
- Oakland, CA
- County
- Alameda County · 1,614,355 people
- City population
- 385,993
- Metro
- San Francisco-Oakland-Berkeley, CA
- Population (ZIP)
- 35,742
- Household income
- $76,723
- Rent vs Own
- Severe rent burden
- 2061.0
Population outlook (Alameda County) Hauer SSP2
- Today (2025)
- 1,928,884 people
- By 2030
- 2,069,146 · +7.3%
- By 2040
- 2,338,405 · +21.2%
- By 2050
- 2,586,608 · +34.1%
- By 2075
- 3,061,911 · +58.7%
- By 2100
- 3,234,133 · +67.7%
Race, ethnicity, and origin ACS 2023
- Neighborhood character
- Majority Hispanic (63%)
- Race & ethnicity
- Hispanic / Latino 63% Black 25% Two or more races 11% Asian 5% White 4% Native American 1% Pacific Islander 1%
- Hispanic origin (detail)
- Mexican 51%
- Foreign-born
- 37% · Canada, China, Vietnam
- Languages at home
- 37% English-only · Spanish 56% Other Asian/Pacific 2% Chinese 1%
Political lean MEDSL · Alameda
- 2024 margin
- Solid D (+53.6) · D 74.6% · R 21.0% · Other 4.4%
- 2008→2024 swing
- -5.9pp toward R · 2008: 59.5pp · 2024: 53.6pp
- All cycles
- 2024: D+53.6 2020: D+62.5 2016: D+64.4 2012: D+59.8 2008: D+59.5
Not yet ingested
- Civics
- —
Market trends
- HPI YoY
- ▼ -665.46%
- Current HPI
- 396.0247
- Rent YoY
- ▲ 1.58%
- Metro
- San Francisco-Oakland-Berkeley, CA
- State GDP YoY
- ▲ 3.21%
- F500 in state
- 116
Industry mix (Fortune 500 HQ in CA)
| Industry | F500 HQs | Revenue |
|---|---|---|
| Technology | 27 | $1,492B |
|
||
| Financial Services | 3 | $174B |
|
||
| Retail | 3 | $44B |
|
||
| Insurance | 3 | $26B |
|
||
| Media / Entertainment | 2 | $115B |
|
||
| Pharmaceuticals / Biotech | 2 | $62B |
|
||
Price history
2 events — show timeline
- 2026-05-22 Pending — bridgeMLS, Bay East AOR, or Contra Costa AOR
- 2026-05-12 Listed $299,000 bridgeMLS, Bay East AOR, or Contra Costa AOR
Property tax history
+5.8%/yrLatest (2025): $2,200 · +5.6% YoY. Source: county tax records.
Cash-flow waterfall
monthlySold comps — $/sqft
last 12 mo · ≤1 miLoading sold comps…