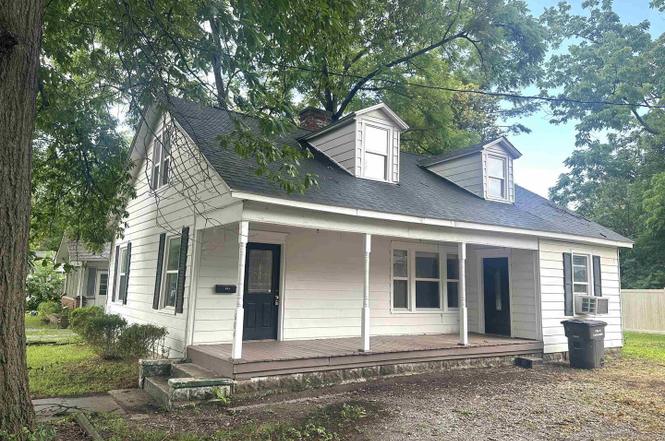
604 W Walnut St · Carbondale, IL
Flood risk 1/10 · Minimal
- FEMA flood zone
- X (unshaded)
- Chance of flooding over 30 yrs
- 0.0%
- Est. flood insurance / yr
- $473 – $860
Fire risk 1/10 · Minimal
- Est. fire insurance / yr
- $804 – $1,492
Heat risk 5/10 · Moderate
- Hot days now (above 107°F)
- 7 days/yr
- Hot days in 30 yrs
- 21 days/yr
Wind risk 2/10 · Minimal
- Chance of severe wind over 30 yrs
- 2.0%
Air-quality risk 2/10 · Minimal
- Unhealthy air days now
- 0 days/yr
- Unhealthy air days in 30 yrs
- 1 days/yr
Risk factors via First Street. Map © Google.
Why this score? — see what drove the B grade
The composite is a weighted blend of 9 inputs, each scored 0–100. Each bar is that input's sub-score; the figure is the points it added to the 100-point composite (weight × sub-score).
- Cash flow +29.4/30.0
- ARV discount +15.0/15.0
- DSCR +10.0/10.0
- 1% rule +8.2/10.0
- Rent growth +3.6/5.0
- Livability +3.5/5.0
- Condition / age +2.5/5.0
- Schools +2.4/10.0
- Appreciation +0.0/10.0
$80,000
🖨 Deal sheet 📄 Offer letter ✓ Due diligence
Listing remarks
This 3-bedroom, 2-bath home at 604 Walnut offers plenty of space and a great location close to SIU. The layout includes a large living room with a fireplace, a newly remodeled kitchen with granite countertops and stainless steel appliances, and a private master suite upstairs. Whether you're looking for a personal home or an investment property, this one is worth a look. Walking distance to campus, parks, and town. Schedule a tour and make an offer today!
Key facts
- Private master suite
- Large living room
- Granite countertops
Tags
Property features AI
Finance
- HOA & community: No master association fee required
Exterior
- Parking: Other parking
- Utilities: Public water; Public sewer; Electric service with circuit breakers
- Home design: Detached single-family home; 1.5-story design; Fee simple ownership; Property is over 100 years old; Level lot
- Construction: Frame construction with aluminum siding; Block foundation; Built before 1978
- Exterior features: Other exterior features
Interior
- Kitchen: Kitchen with eating area / table space; Includes microwave, range, refrigerator
- Bedrooms: Master bedroom on the second level with full attached bath; Two additional main-level bedrooms; Possible fourth bedroom (listed as Bedroom 4)
- Flooring: Carpet in master bedroom and sitting room; Luxury vinyl flooring in main-level bedrooms, dining room, and kitchen
- Bathrooms: Two full bathrooms; Master bathroom with whirlpool tub; Basement contains bathroom facilities
- Heating & cooling: Forced air heating with natural gas; Window air conditioning units
- Interior features: Six total rooms; Basement is partial with crawl space; Wood-burning fireplace in the living room
- Laundry & utility: Dedicated laundry room; Sump pump
Neighborhood map
What this means for you Summary
Snapshot
- This is a 3-bed/2.0-bath single-family listed at $80k.
Deal economics
- At list price, monthly cash flow is $283 ($3k/yr) — positive.
- The deal already cash-flows at list — no discount required.
- Meets the 1% rule at list price ($1k rent vs $80k).
- Recommended offer: $70k (12.0% below list) — sets the bar for market timing.
- Cap rate 10.5% vs local median 4.9% in Carbondale — top-decile yield for the area; either an underpriced asset or a hidden risk that comps aren't pricing in. Stress-test before assuming the spread holds.
Location & tenants
- Location reads 70/100 on livability (#375 in IL) — a middle-class / working-renter tenant base. Strengths: amenities A+, commute A+, cost of living A+; Watch: housing C-, schools D+, crime F.
- Carbondale Chsd 165 (urban): math 26% / reading 35% proficiency, ranked #279 of 620 in IL (top 45%) — families likely to look elsewhere, expect single-tenant / working-renter base with shorter leases.
- Market conditions: Rents rising fast (+4.5%/yr); 202 active listings in the ZIP; lower-income renter base — watch delinquency; 5 units permitted in Jackson County in 2024 (0 in 5+ unit buildings).
- This rent runs 36% of the median local income ($35k/yr) — at the standard rent-burdened threshold; future hikes will face affordability resistance.
Forward outlook
- Local home prices are declining (-3.0%/yr); year-one equity from $553 of loan paydown is wiped out by about $2k of value loss. Plan a longer hold.
- At projected returns (-3.0% appreciation + 4.5% rent growth), your $22k cash investment doubles in ~7 years — after that, you're playing with house money.
Negotiation context
- It's been on market 182 days — a 12% lower offer ($70k) is reasonable based on typical stale-listing flexibility.
- 7 sale attempts since 27y ago; this cycle's ask has dropped $5k (6%) from the opening price — seller is motivated, your offer sets the floor, not the list.
Risks & watch-outs
- Watch-outs: built in 1923 — expect roof / HVAC / electrical / plumbing capex.
- Climate carrying-cost: extreme-heat days projected 7→21/yr by 2055 (HVAC capex compounding) — expect insurance premiums to compound above CPI over the hold.
Questions for the listing agent
- It's been on market 182 days. Have you received any prior offers? Is the seller open to a 12% concession, seller financing, or rate buy-down credit?
- Built in 1923 — when were the roof, HVAC, electrical panel, plumbing, and water heater last replaced?
- Why hasn't it sold? Are there any deal-killer items the seller is aware of (foundation, flood, title, zoning, code violations)?
- Is there a deadline driving the sale (1031 exchange, divorce, estate, relocation)? That informs how much negotiation room exists.
- Schools are D-rated, which usually means shorter tenancies and higher turnover. Who's the typical renter profile here, and what's been the actual vacancy rate?
- Crime grade is F in this area — have there been break-ins, vandalism, or insurance claims at this property in the last 3 years? What carrier currently insures it and at what premium?
- What's the average days-on-market for RENTAL listings here right now (not sales)? A rising rental-DOM trend means longer vacancies and softer asking-rent achievability than the comps imply.
- What's the recent tenant-quality profile in this submarket — average credit score on applications, eviction rate, late-payment / NSF rate, and stable-employment percentage? A property-management company in the area should have these aggregated.
- How much new for-sale + rental construction is in the pipeline within 1–3 miles? Heavy new supply typically softens prices + rents 12–24 months out; constrained supply supports both.
Investment metrics
- 1% rule
- 1.32% ✓
- Cap rate
- 10.55%
- Cash-on-cash
- 15.19%
- DSCR
- 1.68
- GRM
- 6.3
CMA / ARV
- ARV (on-the-fly)
- $117,311
- Comps found
- 12
Show comp detail 12 sales within ~0.75 mi
| Address | Dist | Beds/Ba | Sqft | Sold | Price | $/sf | Match |
|---|---|---|---|---|---|---|---|
| 711 W Elm St | 0.10mi | 3/1.5 | 1,624 (+1%) | 0mo | $160,000 | $99 | 91 |
| 505 N Almond St | 0.43mi | 3/2.0 | 1,551 (-4%) | 0mo | $155,000 | $100 | 74 |
| 203 Orchard Dr | 0.41mi | 3/3.0 | 1,603 (-0%) | 3mo | $115,000 | $72 | 74 |
| 1212 W Schwartz St | 0.36mi | 3/1.0 | 1,720 (+7%) | 4mo | $85,000 | $49 | 65 |
| 1206 W Chautauqua St | 0.71mi | 3/2.0 | 1,633 (+2%) | 1mo | $120,000 | $73 | 63 |
| 901 S Johnson Ave | 0.66mi | 3/2.0 | 1,600 (-0%) | 8mo | $185,000 | $116 | 62 |
| 901 S Johnson Ave | 0.66mi | 3/2.0 | 1,600 (-0%) | 8mo | $185,000 | $116 | 62 |
| 813 W Walnut St | 0.17mi | 3/1.0 | 1,365 (-15%) | 6mo | $55,000 | $40 | 58 |
| 813 W Walnut St | 0.17mi | 3/1.0 | 1,365 (-15%) | 6mo | $55,000 | $40 | 58 |
| 1406 W Taylor Dr | 0.63mi | 3/1.0 | 1,680 (+4%) | 4mo | $147,000 | $88 | 56 |
| 702 S Dixon Ave | 0.58mi | 3/2.0 | 1,776 (+10%) | 4mo | $129,000 | $73 | 52 |
| 1114 W Walkup St | 0.53mi | 2/1.0 (-1) | 1,440 (-10%) | 7mo | $40,000 | $28 | 43 |
Match score weights: distance 35% · size 25% · config 20% · recency 20%. Top-matched comps best support the ARV.
Projected returns pro-forma
-3.0% appreciation · 4.51% rent growth · sell at horizon
- IRR
- 7.6%
- Equity multiple
- 1.30×
- Total profit
- $6,741
- Equity at exit
- $11,928
- IRR
- 18.1%
- Equity multiple
- 2.61×
- Total profit
- $36,094
- Equity at exit
- $6,917
Cash invested: $22,400 (down + closing). Projections, not guarantees.
Landlord ↔ Tenant lean methodology
- Overall (STATE)
- 43 Moderately Tenant-Leaning
- State Illinois
- 43 Moderately Tenant-Leaning · D+7
- County
- — inherits STATE
- City
- — inherits STATE
ZIP-level market 62901
- Rents YoY
- 4.5%
- Active inventory
- 202
- Price-to-rent
- 6.3×
Monthly cashflow live
- Estimated rent
- $1,059 medium interval (Pro) →
- Mortgage (P&I)
- −$420
- Tax est. 1.5%
- −$100 /mo · $1,200/yr
- Insurance
- −$33
- HOA
- −$0
- Vacancy / Maint / Mgmt
- −$222
- Net cashflow
- $283
Break-even live
UW: 25.0% down · 7.5% · 30yr · 1.5% tax · 5.0% vac · 8.0% maint · 8.0% mgmt
Financing live
Cash to close
- Down payment
- $20,000
- Closing costs
- $2,400
- Reserves months
- —
- Total cash needed
- —
Loan-product check · same deal, 3 products live
Conventional
25% down · 7.5% · 30yr
- Down + closing
- —
- Monthly P&I
- —
- Monthly cashflow
- —
- DSCR
- —
- Eligible?
- —
Personal DTI + credit; lowest rate.
DSCR
20% down · 8.5% · 30yr
- Down + closing
- —
- Monthly P&I
- —
- Monthly cashflow
- —
- DSCR
- —
- Eligible?
- —
No personal income docs; deal must DSCR.
Hard money
10% down · 12.0% · 12mo
- Down + closing
- —
- Monthly P&I
- —
- Monthly cashflow
- —
- DSCR
- —
- Eligible?
- —
Short-term bridge; refi at stabilization.
Listing history 50 events
-
2026-06-19days on market $80,000 Active 182 DOM
-
2026-06-18days on market $80,000 Active 181 DOM
-
2026-06-17days on market $80,000 Active 180 DOM
-
2026-06-16days on market $80,000 Active 179 DOM
-
2026-06-15days on market $80,000 Active 178 DOM
-
2026-06-14days on market $80,000 Active 176 DOM
-
2026-06-13days on market $80,000 Active 175 DOM
-
2026-06-10days on market $80,000 Active 173 DOM
-
2026-06-09days on market $80,000 Active 172 DOM
-
2026-06-08days on market $80,000 Active 171 DOM
-
2026-06-07days on market $80,000 Active 170 DOM
-
2026-06-02days on market $80,000 Active 165 DOM
-
2026-06-01days on market $80,000 Active 164 DOM
-
2026-05-31days on market $80,000 Active 163 DOM
-
2026-05-30days on market $80,000 Active 162 DOM
-
2026-05-23price $95,000
-
2026-02-27price $80,000
-
2026-01-08status Active
-
2026-01-05historical
-
2025-12-18historical
-
2025-11-13price
-
2025-09-23status Active
-
2025-09-23historical
-
2025-09-11historical Under Contract
-
2025-09-03price
-
2025-08-18status Active
-
2025-08-13historical Under Contract
-
2025-06-27Active
-
2021-08-06historical
-
2021-08-06historical
-
2021-08-06historical
-
2021-08-06historical
-
2021-08-06historical
-
2021-08-06historical
-
2021-08-06historical
-
2021-08-06historical
-
2021-08-06historical
-
2021-08-06historical
-
2021-08-06historical
-
2021-08-06historical
-
2021-08-06historical
-
2021-08-06historical
-
2013-03-29historical
-
2007-06-22historical
-
2007-04-12historical
-
2006-03-03soldstatus $82,500
-
2006-02-09$85,000
-
2006-02-06soldstatus $82,500
-
2003-07-31historical
-
2003-07-31historical
ⓘ Source: listings_history table (triggers on properties + properties_extension) + one-shot
backfill from property_details.listing_events for pre-trigger history.
Climate risk First Street
- Flood 1/10 Low FEMA zone X (unshaded) · 0% chance over 30 yrs
- Wildfire 1/10 Low
- Heat 5/10 Major 7 d/yr ≥107°F today · 21 d/yr by 30 yrs out
- Wind 2/10 Low 2% chance of damaging wind over 30 yrs
- Air quality 2/10 Low 0 unhealthy d/yr today · 1 by 30 yrs out
Nearby sold comps map
Loading sold comps map…
Walkable amenities ~0.75 mi
Loading nearby amenities…
Taxation est. · year 1
- Rental income
- $12,704
- − Mortgage interest
- −$4,481
- − Property taxes
- −$1,200
- − Insurance
- −$400
- − Repairs & maintenance
- −$1,016
- − Management
- −$1,016
- − Depreciation
- −$2,327
- Taxable income
- $2,263
- Est. tax owed @ 24.0%
- −$543
- After-tax cash flow
- $2,859/yr
For passive investors: Depreciation is non-cash, so a rental often shows a tax loss while cash-flowing — sheltering income. Rental losses are passive: they offset passive income freely, and up to $25,000/yr can offset ordinary (W-2) income if you actively participate and your MAGI is under $100k (phasing out to $0 by $150k); unused losses carry forward. On sale, claimed depreciation is recaptured at up to 25%, and gains may owe capital-gains tax (a 1031 exchange can defer both). Figures are a year-1 estimate at your 24.0% rate — not tax advice; consult a CPA.
Schools (NCES district)
- District
- Carbondale Chsd 165
- NCES district ID
- 1708370
- Math proficiency
- 26% ▼ -10.00%
- Reading proficiency
- 35% ▼ -2.00%
- Median HH income
- $22,075
- Composite
- 23.92/100
- National rank
- #7787
- State rank
- #279 of 620 in IL
Livability — Carbondale
- Score
- 70/100
- State rank
- #375
- US rank
- #7806
Category grades
Schools grade is shown separately in the Schools card above.
Census & demographics
- Census place
- Carbondale, IL
- County
- Jackson County · 22,946 people
- City population
- 22,946
- Metro
- Carbondale-Marion, IL
- Population (ZIP)
- 22,946
- Household income
- $35,089
- Rent vs Own
- Severe rent burden
- 2038.0
Population outlook (Jackson County) Hauer SSP2
- Today (2025)
- 59,093 people
- By 2030
- 59,628 · +0.9%
- By 2040
- 59,495 · +0.7%
- By 2050
- 58,811 · -0.5%
- By 2075
- 57,683 · -2.4%
- By 2100
- 55,337 · -6.4%
Race, ethnicity, and origin ACS 2023
- Neighborhood character
- Diverse neighborhood (Simpson 0.58)
- Race & ethnicity
- White 59% Black 26% Asian 6% Hispanic / Latino 5% Two or more races 5%
- Hispanic origin (detail)
- Mexican 4%
- Common ancestry
- Romanian 2% Italian 2% Slovak 2%
- Foreign-born
- 9% · Canada, China, South Korea
- Languages at home
- 87% English-only · Other Indo-European 4% Spanish 4% Arabic 2%
Political lean MEDSL · Jackson
- 2024 margin
- Toss-up / Even · D 51.0% · R 47.5% · Other 1.4%
- 2008→2024 swing
- -18.3pp toward R · 2008: 21.8pp · 2024: 3.5pp
- All cycles
- 2024: D+3.5 2020: D+1.3 2016: D+3.0 2012: D+10.3 2008: D+21.8
Not yet ingested
- Civics
- —
Market trends
- HPI YoY
- ▼ -75.62%
- Current HPI
- 88.7209
- Rent YoY
- ▲ 4.51%
- Metro
- Carbondale-Marion, IL
- State GDP YoY
- ▲ 1.59%
- F500 in state
- 60
Industry mix (Fortune 500 HQ in IL)
| Industry | F500 HQs | Revenue |
|---|---|---|
| Insurance | 4 | $201B |
|
||
| Consumer Goods | 4 | $87B |
|
||
| Industrial Machinery | 3 | $64B |
|
||
| Healthcare | 2 | $55B |
|
||
| Retail / Pharmacy | 1 | $148B |
|
||
| Agriculture / Food | 1 | $86B |
|
||
Price history
+111.6% since first listed40 events — show timeline
- 2026-05-23 Price Changed $95,000 MRED as Distributed by MLS Grid
- 2026-02-27 Price Changed $80,000 MRED as Distributed by MLS Grid
- 2026-01-08 Relisted — MRED as Distributed by MLS Grid
- 2026-01-05 Listing Removed — MRED as Distributed by MLS Grid
- 2025-12-18 Listing Removed — MRED as Distributed by MLS Grid
- 2025-11-13 Price Changed — RMLSA as Distributed by MLS Grid
- 2025-09-23 Relisted — RMLSA as Distributed by MLS Grid
- 2025-09-23 Listing Removed — RMLSA as Distributed by MLS Grid
- 2025-09-11 Contingent — RMLSA as Distributed by MLS Grid
- 2025-09-03 Price Changed — RMLSA as Distributed by MLS Grid
- 2025-08-18 Relisted — RMLSA as Distributed by MLS Grid
- 2025-08-13 Contingent — RMLSA as Distributed by MLS Grid
- 2025-06-27 Listed — RMLSA as Distributed by MLS Grid
- 2021-08-06 Listing Removed — RMLSA as Distributed by MLS Grid
- 2021-08-06 Listing Removed — RMLSA as Distributed by MLS Grid
- 2021-08-06 Listing Removed — RMLSA as Distributed by MLS Grid
- 2021-08-06 Listing Removed — RMLSA as Distributed by MLS Grid
- 2021-08-06 Listing Removed — RMLSA as Distributed by MLS Grid
- 2021-08-06 Listing Removed — RMLSA as Distributed by MLS Grid
- 2021-08-06 Listing Removed — RMLSA as Distributed by MLS Grid
- 2021-08-06 Listing Removed — RMLSA as Distributed by MLS Grid
- 2021-08-06 Listing Removed — RMLSA as Distributed by MLS Grid
- 2021-08-06 Listing Removed — RMLSA as Distributed by MLS Grid
- 2021-08-06 Listing Removed — RMLSA as Distributed by MLS Grid
- 2021-08-06 Listing Removed — RMLSA as Distributed by MLS Grid
- 2021-08-06 Listing Removed — RMLSA as Distributed by MLS Grid
- 2021-08-06 Listing Removed — RMLSA as Distributed by MLS Grid
- 2013-03-29 Listing Removed — MRED as Distributed by MLS Grid
- 2007-06-22 Listing Removed — MRED as Distributed by MLS Grid
- 2007-04-12 Listing Removed — MRED as Distributed by MLS Grid
- 2006-03-03 Sold (MLS) $82,500 RMLSA as Distributed by MLS Grid
- 2006-02-09 Listed $85,000 RMLSA as Distributed by MLS Grid
- 2006-02-06 Sold (Public Records) $82,500 Public Records
- 2003-07-31 Listing Removed — RMLSA as Distributed by MLS Grid
- 2003-07-31 Listing Removed — MRED as Distributed by MLS Grid
- 2003-06-19 Listing Removed — MRED as Distributed by MLS Grid
- 2002-05-23 Listing Removed — MRED as Distributed by MLS Grid
- 2001-10-12 Listing Removed — MRED as Distributed by MLS Grid
- 1999-09-20 Listed $44,900 RMLSA as Distributed by MLS Grid
- 1999-09-20 Listed — MRED as Distributed by MLS Grid
Property tax history
+2.6%/yrLatest (2024): $4,753 · +6.4% YoY. Source: county tax records.
Cash-flow waterfall
monthlySold comps — $/sqft
last 12 mo · ≤1 miLoading sold comps…