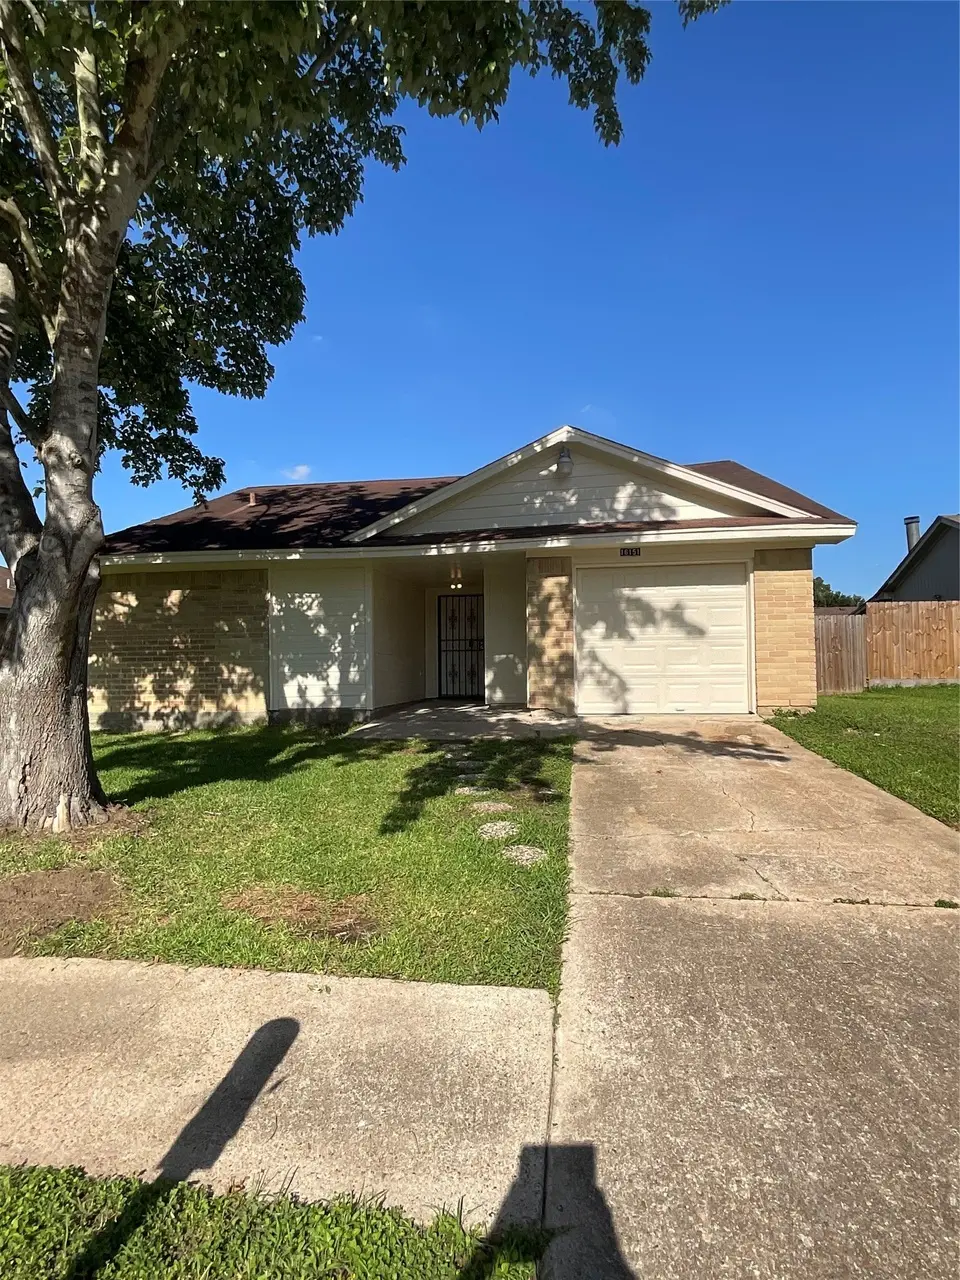
16151 Coyridge Ln · Houston, TX
Flood risk 1/10 · Minimal
- FEMA flood zone
- X (unshaded)
- Chance of flooding over 30 yrs
- 0.0%
- Est. flood insurance / yr
- $507 – $1,088
Fire risk 4/10 · Minor
- Est. fire insurance / yr
- $1,222 – $2,270
Heat risk 9/10 · Severe
- Hot days now (above 110°F)
- 7 days/yr
- Hot days in 30 yrs
- 24 days/yr
Wind risk 9/10 · Severe
- Chance of severe wind over 30 yrs
- 99.0%
Air-quality risk 3/10 · Minor
- Unhealthy air days now
- 2 days/yr
- Unhealthy air days in 30 yrs
- 3 days/yr
Risk factors via First Street. Map © Google.
Why this score? — see what drove the B grade
The composite is a weighted blend of 9 inputs, each scored 0–100. Each bar is that input's sub-score; the figure is the points it added to the 100-point composite (weight × sub-score).
- Cash flow +26.3/30.0
- ARV discount +15.0/15.0
- DSCR +8.9/10.0
- 1% rule +8.4/10.0
- Schools +4.5/10.0
- Livability +3.7/5.0
- Rent growth +2.9/5.0
- Condition / age +2.5/5.0
- Appreciation +0.0/10.0
$129,900
🖨 Deal sheet (PDF) 📄 Offer letter ✓ Due diligence
Key facts
- 6,503 sq ft lot
- Garage
- Built 1982
Property features AI
Finance
- HOA & community: Ridgegate Community HOA with an annual fee of $250
Exterior
- Parking: Attached garage with garage door opener (1 space)
- Utilities: Public water; Public sewer
- Home design: Residential property; Built in 1982; Slab foundation; Composition roof
- Construction: Brick and wood siding construction
- Exterior features: Deck; Patio; Private yard; Fenced backyard; Cleared lot in a subdivision; Asphalt road access
Interior
- Kitchen: Electric range
- Bedrooms: 7 total rooms (bedroom count not specified)
- Bathrooms: 2 full bathrooms; 1 half bathroom
- Heating & cooling: Central heating (electric); Central air conditioning (electric)
- Interior features: Wood-burning fireplace (1); Kitchen and family room combo; Kitchen and dining combo; Living and dining room; Pantry; Tub/shower
- Laundry & utility: Washer hookup; Electric dryer hookup
Neighborhood map
What this means for you Summary
Snapshot
- This is a 3-bed/2.0-bath single-family listed at $130k.
Deal economics
- At list price, monthly cash flow is $337 ($4k/yr) — positive.
- The deal already cash-flows at list — no discount required.
- Meets the 1% rule at list price ($2k rent vs $130k).
- Recommended offer: $128k (1.5% below list) — sets the bar for market timing.
- Cap rate 9.4% vs local median 3.2% in Houston — top-decile yield for the area; either an underpriced asset or a hidden risk that comps aren't pricing in. Stress-test before assuming the spread holds.
Location & tenants
- Location reads 74/100 on livability (#184 in TX, #4,771 nationally) — a middle-class / working-renter tenant base. Strengths: amenities A+, cost of living A+, housing A+; Watch: crime F.
- Fort Bend ISD (suburban): math 44% / reading 53% proficiency, ranked #140 of 826 in TX (top 17%) — families likely to look elsewhere, expect single-tenant / working-renter base with shorter leases.
- Zoned schools: Ridgegate El (math 17% / reading 12%, grade F, #4,048 of 4,322 statewide, top 95%, 449 students, 98% FRL); Christa Mcauliffe Middle (math 9% / reading 20%, grade F, #1,583 of 1,662 statewide, top 96%, 835 students, 94% FRL); Willowridge H S (math 12% / reading 29%, grade F, #1,389 of 1,632 statewide, top 86%, 1,319 students, 87% FRL) — zoned schools average 93% FRL vs 35% district-wide (58 pts higher); higher-poverty schools than district average — tighter screening recommended.
- Zoned-school proficiency averages 16% at this address vs 48% district-wide (-32 pts) — the specific schools serving this property underperform the Fort Bend ISD average; the district grade overstates school quality for this exact location.
- Market conditions: Rents rising (+1.7%/yr); 118 active listings in the ZIP; 14 comparable units currently listed for rent nearby; rentals at typical pace (median 19d on market — plan ~3-4 weeks tenant-placement turnaround); 12,093 units permitted in Fort Bend County in 2024 (815 in 5+ unit buildings).
- This rent runs 31% of the median local income ($67k/yr) — at the standard rent-burdened threshold; future hikes will face affordability resistance.
Forward outlook
- Local home prices are declining (-3.0%/yr); year-one equity from $898 of loan paydown is wiped out by about $4k of value loss. Plan a longer hold.
- Fort Bend County population projected at +75% by 2050 — long-run rental-demand tailwind backs the buy-and-hold thesis.
Negotiation context
- It's been on market 19 days — a 2% lower offer ($128k) is reasonable based on typical stale-listing flexibility.
Risks & watch-outs
- Watch-outs: property tax is 2.6% of price.
- Climate carrying-cost: severe wind risk, 99% chance of damaging wind over 30y; extreme-heat days projected 7→24/yr by 2055 (HVAC capex compounding) — expect insurance premiums to compound above CPI over the hold.
Questions for the listing agent
- Property tax is high relative to price — has the assessment been appealed recently, and will the sale trigger a re-assessment?
- What does the HOA fee cover, when was the last increase, and are there any pending special assessments or reserve-fund shortfalls?
- Is there a deadline driving the sale (1031 exchange, divorce, estate, relocation)? That informs how much negotiation room exists.
- Schools are D-rated, which usually means shorter tenancies and higher turnover. Who's the typical renter profile here, and what's been the actual vacancy rate?
- Crime grade is F in this area — have there been break-ins, vandalism, or insurance claims at this property in the last 3 years? What carrier currently insures it and at what premium?
- What's the average days-on-market for RENTAL listings here right now (not sales)? A rising rental-DOM trend means longer vacancies and softer asking-rent achievability than the comps imply.
- What's the recent tenant-quality profile in this submarket — average credit score on applications, eviction rate, late-payment / NSF rate, and stable-employment percentage? A property-management company in the area should have these aggregated.
- How much new for-sale + rental construction is in the pipeline within 1–3 miles? Heavy new supply typically softens prices + rents 12–24 months out; constrained supply supports both.
Investment metrics
- 1% rule
- 1.34% ✓
- Cap rate
- 9.41%
- Cash-on-cash
- 11.12%
- DSCR
- 1.49
- GRM
- 6.2
CMA / ARV
- ARV (on-the-fly)
- $179,920
- Comps found
- 10
Show comp detail 10 sales within ~0.75 mi
| Address | Dist | Beds/Ba | Sqft | Sold | Price | $/sf | Match |
|---|---|---|---|---|---|---|---|
| 5934 Beaconridge Dr | 0.27mi | 3/2.0 | 1,070 (+3%) | 0mo | $189,900 | $177 | 82 |
| 16146 Corsair Rd | 0.08mi | 2/1.0 (-1) | 1,040 (0%) | 17mo | $165,000 | $159 | 73 |
| 16010 Diamond Ridge Dr | 0.44mi | 2/2.0 (-1) | 1,052 (+1%) | 10mo | $193,650 | $184 | 64 |
| 15622 Corsair Rd | 0.59mi | 3/1.0 | 1,026 (-1%) | 10mo | $249,990 | $244 | 57 |
| 5734 Gineridge Dr | 0.51mi | 3/2.0 | 1,070 (+3%) | 19mo | $160,000 | $150 | 56 |
| 6033 Muskingum Ln | 0.66mi | 3/2.0 | 1,102 (+6%) | 13mo | $170,000 | $154 | 49 |
| 16211 Beck Ridge Dr | 0.46mi | 2/1.0 (-1) | 926 (-11%) | 12mo | $155,000 | $167 | 42 |
| 16242 Diamond Ridge Dr | 0.37mi | 2/1.0 (-1) | 926 (-11%) | 16mo | $160,000 | $173 | 42 |
| 7015 Trigate Dr | 0.65mi | 3/2.0 | 1,179 (+13%) | 7mo | $219,999 | $187 | 41 |
| 5705 Mackinaw St | 0.70mi | 4/1.5 (+1) | 1,114 (+7%) | 14mo | $158,999 | $143 | 37 |
Match score weights: distance 35% · size 25% · config 20% · recency 20%. Top-matched comps best support the ARV.
Projected returns pro-forma
-3.0% appreciation · 1.72% rent growth · sell at horizon
- IRR
- -1.2%
- Equity multiple
- 0.95×
- Total profit
- $-1,679
- Equity at exit
- $19,369
- IRR
- 6.9%
- Equity multiple
- 1.49×
- Total profit
- $17,801
- Equity at exit
- $11,231
Cash invested: $36,372 (down + closing). Projections, not guarantees.
Landlord ↔ Tenant lean methodology
- Overall (STATE)
- 87 Strongly Landlord-Friendly
- State Texas
- 87 Strongly Landlord-Friendly · R+5
- County
- — inherits STATE
- City
- — inherits STATE
ZIP-level market 77053
- Rents YoY
- 1.7%
- Active inventory
- 118
- Price-to-rent
- 6.2×
Monthly cashflow live
- Estimated rent
- $1,736 high interval (Pro) →
- Mortgage (P&I)
- −$681
- Tax from tax record
- −$278 /mo · $3,335/yr
- Insurance
- −$54
- HOA
- −$21
- Vacancy / Maint / Mgmt
- −$365
- Net cashflow
- $337
Break-even live
Sensitivity live
| Price | -10% $411 | -5% $374 | +0% $337 | +5% $300 | +10% $264 |
|---|---|---|---|---|---|
| Rent | -10% $200 | -5% $268 | +0% $337 | +5% $406 | +10% $474 |
| Rate | -1.0pp $402 | -0.5pp $370 | base $337 | +0.5pp $303 | +1.0pp $269 |
UW: 25.0% down · 7.5% · 30yr · 1.5% tax · 5.0% vac · 8.0% maint · 8.0% mgmt
Financing live
Cash to close
- Down payment
- $32,475
- Closing costs
- $3,897
- Reserves months
- —
- Total cash needed
- —
Loan-product check · same deal, 3 products live
Conventional
25% down · 7.5% · 30yr
- Down + closing
- —
- Monthly P&I
- —
- Monthly cashflow
- —
- DSCR
- —
- Eligible?
- —
Personal DTI + credit; lowest rate.
DSCR
20% down · 8.5% · 30yr
- Down + closing
- —
- Monthly P&I
- —
- Monthly cashflow
- —
- DSCR
- —
- Eligible?
- —
No personal income docs; deal must DSCR.
Hard money
10% down · 12.0% · 12mo
- Down + closing
- —
- Monthly P&I
- —
- Monthly cashflow
- —
- DSCR
- —
- Eligible?
- —
Short-term bridge; refi at stabilization.
Rent comps 14 comps
| Address | Beds | Baths | Sqft | Rent | $/sqft | DOM | Units | Dist |
|---|---|---|---|---|---|---|---|---|
| 16211 Corsair Rd Houston, TX | 3.0 | 2.0 | 1139 | $1,813 | $1.59 | 26d | 1 | 0.09mi |
| 16432 Chimney Rock Rd Unit 16465 Houston, TX | 3.0 | 2.0 | 1349 | $1,524 | $1.13 | 45d | 1 | 0.50mi |
| 16432 Chimney Rock Rd Unit 3174 Houston, TX | 3.0 | 2.0 | 1349 | $1,513 | $1.12 | 12d | 1 | 0.50mi |
| 16432 Chimney Rock Rd Apt 424 Houston, TX | 2.0 | 2.0 | 1026 | $1,292 | $1.26 | 7d | 1 | 0.50mi |
| 16432 Chimney Rock Rd Unit 2174 Houston, TX | 2.0 | 2.0 | 1026 | $1,327 | $1.29 | 12d | 1 | 0.50mi |
| 16432 Chimney Rock Rd Unit 3112 Houston, TX | 3.0 | 2.0 | 1349 | $1,473 | $1.09 | 0d | 1 | 0.50mi |
| 16432 Chimney Rock Rd Unit 2112 Houston, TX | 2.0 | 2.0 | 1026 | $1,276 | $1.24 | 0d | 1 | 0.50mi |
| 16432 Chimney Rock Rd Unit 16489 Houston, TX | 2.0 | 2.0 | 1026 | $1,317 | $1.28 | 45d | 1 | 0.50mi |
| 16603 Sentinel Dr Houston, TX | 3.0 | 2.0 | 1296 | $1,799 | $1.39 | 18d | 1 | 0.74mi |
| 5030 Shadowridge Dr Houston, TX | 3.0 | 2.0 | 1310 | $1,800 | $1.37 | 45d | 1 | 1.12mi |
| 5030 Ridgecreek Dr Houston, TX | 3.0 | 2.0 | 1399 | $1,659 | $1.19 | 4d | 1 | 1.17mi |
| 15703 Baybriar Dr Missouri City, TX | 3.0 | 2.0 | 1252 | $1,615 | $1.29 | 21d | 1 | 1.37mi |
| 15823 Baybriar Dr Missouri City, TX | 3.0 | 2.0 | 1335 | $1,641 | $1.23 | 7d | 1 | 1.41mi |
| 15810 Boonridge Rd Houston, TX | 3.0 | 2.0 | 1221 | $1,750 | $1.43 | 45d | 1 | 1.45mi |
HOA detail
- Monthly dues
- $21 · $252/yr
Listing history 11 events
-
2026-06-21days on market $129,900 Active 19 DOM
-
2026-06-18days on market $129,900 Active 16 DOM
-
2026-06-17days on market $129,900 Active 15 DOM
-
2026-06-16days on market $129,900 Active 14 DOM
-
2026-06-15days on market $129,900 Active 13 DOM
-
2026-06-13days on market $129,900 Active 11 DOM
-
2026-06-09days on market $129,900 Active 7 DOM
-
2026-06-08days on market $129,900 Active 6 DOM
-
2026-06-07days on market $129,900 Active 5 DOM
-
2026-06-04days on market $129,900 Active 2 DOM
-
2026-06-02$129,900 Active 1 DOM
ⓘ Source: listings_history table (triggers on properties + properties_extension) + one-shot
backfill from property_details.listing_events for pre-trigger history.
Tax reassessment forecast TX · Resets to sale price
- Current annual tax
- $3,335 · $278/mo
- Projected year-2 tax
- $3,335 · $278/mo
- Expected delta
- $0/yr ($0/mo · 0.0%)
ⓘ Screening estimate from a state-policy table — verify with the county assessor before closing.
Climate risk First Street
- Flood 1/10 Low FEMA zone X (unshaded) · 0% chance over 30 yrs
- Wildfire 4/10 Moderate
- Heat 9/10 Extreme 7 d/yr ≥110°F today · 24 d/yr by 30 yrs out
- Wind 9/10 Extreme 99% chance of damaging wind over 30 yrs
- Air quality 3/10 Moderate 2 unhealthy d/yr today · 3 by 30 yrs out
Nearby sold comps map
Loading sold comps map…
Walkable amenities ~0.75 mi
Loading nearby amenities…
Taxation est. · year 1
- Rental income
- $20,830
- − Mortgage interest
- −$7,276
- − Property taxes
- −$3,335
- − Insurance
- −$650
- − Repairs & maintenance
- −$1,666
- − Management
- −$1,666
- − HOA
- −$252
- − Depreciation
- −$3,779
- Taxable income
- $2,205
- Est. tax owed @ 24.0%
- −$529
- After-tax cash flow
- $3,515/yr
For passive investors: Depreciation is non-cash, so a rental often shows a tax loss while cash-flowing — sheltering income. Rental losses are passive: they offset passive income freely, and up to $25,000/yr can offset ordinary (W-2) income if you actively participate and your MAGI is under $100k (phasing out to $0 by $150k); unused losses carry forward. On sale, claimed depreciation is recaptured at up to 25%, and gains may owe capital-gains tax (a 1031 exchange can defer both). Figures are a year-1 estimate at your 24.0% rate — not tax advice; consult a CPA.
Schools (NCES district)
- District
- Fort Bend ISD
- NCES district ID
- 4819650
- Math proficiency
- 44% ▼ -15.00%
- Reading proficiency
- 53% ▼ -4.00%
- Median HH income
- $82,360
- Composite
- 44.61/100
- National rank
- #2779
- State rank
- #140 of 826 in TX
Livability — Houston
- Score
- 74/100
- State rank
- #184
- US rank
- #4771
Category grades
Schools grade is shown separately in the Schools card above.
Census & demographics
- Census place
- Houston, TX
- County
- Fort Bend County · 836,777 people
- City population
- 3,226,434
- Metro
- Houston-The Woodlands-Sugar Land, TX
- Population (ZIP)
- 30,198
- Household income
- $66,510
- Rent vs Own
- Severe rent burden
- 562.0
Population outlook (Fort Bend County) Hauer SSP2
- Today (2025)
- 1,004,526 people
- By 2030
- 1,153,104 · +14.8%
- By 2040
- 1,453,718 · +44.7%
- By 2050
- 1,753,781 · +74.6%
- By 2075
- 2,455,772 · +144.5%
- By 2100
- 2,930,528 · +191.7%
Race, ethnicity, and origin ACS 2023
- Neighborhood character
- Majority Hispanic (54%)
- Race & ethnicity
- Hispanic / Latino 54% Black 41% Two or more races 22% White 3% Native American 2%
- Hispanic origin (detail)
- Mexican 39%
- Common ancestry
- Lithuanian 1% Portuguese 1% Slovak 1%
- Foreign-born
- 26% · Canada
- Languages at home
- 50% English-only · Spanish 49%
Political lean MEDSL · Fort Bend
- 2024 margin
- Toss-up / Even · D 49.5% · R 47.9% · Other 2.6%
- 2008→2024 swing
- +4.0pp toward D · 2008: -2.4pp · 2024: 1.6pp
- All cycles
- 2024: D+1.6 2020: D+10.6 2016: D+6.6 2012: R+6.8 2008: R+2.4
Not yet ingested
- Civics
- —
Market trends
- HPI YoY
- ▼ -182.09%
- Current HPI
- 266.6541
- Rent YoY
- ▲ 1.72%
- Metro
- Houston-The Woodlands-Sugar Land, TX
- State GDP YoY
- ▲ 3.95%
- F500 in state
- 110
Industry mix (Fortune 500 HQ in TX)
| Industry | F500 HQs | Revenue |
|---|---|---|
| Energy | 16 | $1,198B |
|
||
| Technology | 5 | $198B |
|
||
| Engineering / Construction | 4 | $72B |
|
||
| Energy Services | 3 | $60B |
|
||
| Utilities | 3 | $41B |
|
||
| Healthcare | 2 | $330B |
|
||
Price history
2 events — show timeline
- 2026-06-02 Listed $129,900 HARMLS
- 2017-04-06 Sold (Public Records) — Public Records
Property tax history
+4.4%/yrLatest (2025): $3,335 · +14.0% YoY. Source: county tax records.
Cash-flow waterfall
monthlySold comps — $/sqft
last 12 mo · ≤1 miLoading sold comps…