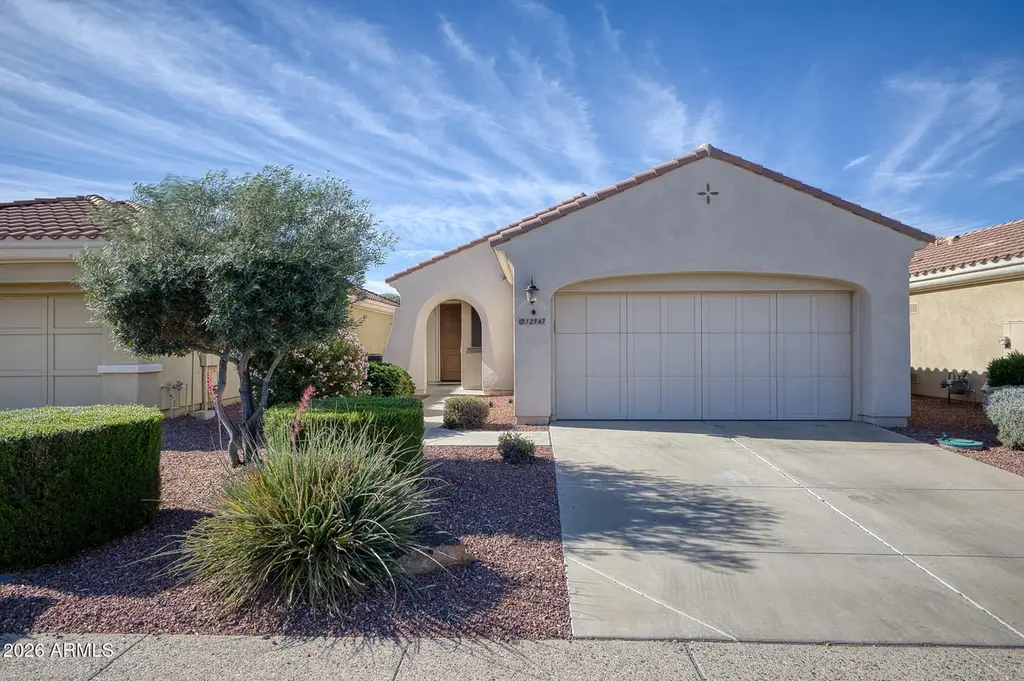
12947 W Chapala Dr · Sun City West, AZ
Flood risk 1/10 · Minimal
- FEMA flood zone
- X (shaded)
- Chance of flooding over 30 yrs
- 0.0%
- Est. flood insurance / yr
- $507 – $1,088
Fire risk 4/10 · Minor
- Est. fire insurance / yr
- $610 – $1,132
Heat risk 9/10 · Severe
- Hot days now (above 114°F)
- 7 days/yr
- Hot days in 30 yrs
- 16 days/yr
Wind risk 1/10 · Minimal
- Chance of severe wind over 30 yrs
- —
Air-quality risk 2/10 · Minimal
- Unhealthy air days now
- 1 days/yr
- Unhealthy air days in 30 yrs
- 1 days/yr
Risk factors via First Street. Map © Google.
Why this score? — see what drove the C grade
The composite is a weighted blend of 9 inputs, each scored 0–100. Each bar is that input's sub-score; the figure is the points it added to the 100-point composite (weight × sub-score).
- Cash flow +17.0/30.0
- ARV discount +15.0/15.0
- DSCR +5.3/10.0
- 1% rule +4.8/10.0
- Rent growth +4.3/5.0
- Schools +3.5/10.0
- Livability +3.2/5.0
- Condition / age +2.5/5.0
- Appreciation +0.0/10.0
$315,000
🖨 Deal sheet 📄 Offer letter ✓ Due diligence
Listing remarks MLS
2-bedroom home in the prestigious guard-gated community of Corte Bella Country Club. This desirable split-bedroom floor plan offers an open-concept design, seamlessly connecting the living room, dining, and kitchen--ideal for both everyday living and entertaining. The kitchen is equipped with newer stainless-steel appliances, an induction cooktop, & the added flexibility of an optional gas hookup. The spacious primary suite features dual sinks, a walk-in shower, & a generous walk-in closet, creating a comfortable private retreat. Enjoy resort-style living in Corte Bella, an active adult community known for its exceptional amenities, including a clubhouse, heated pool & spa, tennis and pickleball courts, on-site restaurant, lots of scenic walking paths, and a vibrant calendar of activities.
Key facts
- Induction cooktop
- Optional gas hookup
- Open concept design
Tags
Neighborhood map
What this means for you Summary
Snapshot
- This is a 2-bed/3.0-bath single-family listed at $315k.
Deal economics
- At list price, monthly cash flow is $213 ($3k/yr) — positive.
- The deal already cash-flows at list — no discount required.
- To meet the 1% rule (rent ≥ 1% of price), the offer needs to be $307k (2.4% below list).
- Recommended offer: $296k (6.0% below list) — sets the bar for market timing.
- Cap rate 7.1% vs local median 4.1% in Sun City West — top-decile yield for the area; either an underpriced asset or a hidden risk that comps aren't pricing in. Stress-test before assuming the spread holds.
Location & tenants
- Location reads 63/100 on livability (#106 in AZ) — a middle-class / working-renter tenant base. Strengths: housing A+, crime B, cost of living B; Watch: schools D+, health & safety D, amenities F.
- Peoria Unified School District (4237) (suburban): math 36% / reading 42% proficiency, ranked #64 of 249 in AZ (top 26%) — families likely to look elsewhere, expect single-tenant / working-renter base with shorter leases.
- Market conditions: Rents rising fast (+7.0%/yr); 125 active listings in the ZIP; 5 comparable units currently listed for rent nearby; rentals leasing fast (median 1d on market — plan ~1-2 weeks tenant-placement turnaround); 40% of comp listings sitting > 30 days — soft ceiling on asking rent; 36,011 units permitted in Maricopa County in 2024 (12,801 in 5+ unit buildings).
- At $3,074/mo this rent would consume 58% of the median local household income ($64k/yr) (locally 691% of renters already pay >50% of income on rent) — very limited rent-growth headroom before tenants either downsize or default.
Forward outlook
- Local home prices are declining (-3.0%/yr); year-one equity from $2k of loan paydown is wiped out by about $9k of value loss. Plan a longer hold.
- Maricopa County population projected at +38% by 2050 — long-run rental-demand tailwind backs the buy-and-hold thesis.
Negotiation context
- It's been on market 72 days — a 6% lower offer ($296k) is reasonable based on typical stale-listing flexibility.
- 6 sale attempts since 9y ago; this cycle's ask has dropped $30k (9%) from the opening price — seller is motivated, your offer sets the floor, not the list.
- Current owner paid $262k; 20% above their basis — modest negotiation headroom, anchor on the comps not their cost.
Risks & watch-outs
- Climate carrying-cost: extreme-heat days projected 7→16/yr by 2055 (HVAC capex compounding) — expect insurance premiums to compound above CPI over the hold.
Questions for the listing agent
- It's been on market 72 days. Have you received any prior offers? Is the seller open to a 6% concession, seller financing, or rate buy-down credit?
- What does the HOA fee cover, when was the last increase, and are there any pending special assessments or reserve-fund shortfalls?
- Why hasn't it sold? Are there any deal-killer items the seller is aware of (foundation, flood, title, zoning, code violations)?
- Is there a deadline driving the sale (1031 exchange, divorce, estate, relocation)? That informs how much negotiation room exists.
- Schools are D-rated, which usually means shorter tenancies and higher turnover. Who's the typical renter profile here, and what's been the actual vacancy rate?
- What's the average days-on-market for RENTAL listings here right now (not sales)? A rising rental-DOM trend means longer vacancies and softer asking-rent achievability than the comps imply.
- What's the recent tenant-quality profile in this submarket — average credit score on applications, eviction rate, late-payment / NSF rate, and stable-employment percentage? A property-management company in the area should have these aggregated.
- How much new for-sale + rental construction is in the pipeline within 1–3 miles? Heavy new supply typically softens prices + rents 12–24 months out; constrained supply supports both.
Investment metrics
- 1% rule
- 0.98% ✗
- Cap rate
- 7.10%
- Cash-on-cash
- 2.89%
- DSCR
- 1.13
- GRM
- 8.5
CMA / ARV
- ARV (median comp)
- $378,486
- List price
- $315,000
- Delta
- -16.77%
- Verdict
- UNDERPRICED
- Comps
- 20 within 1.0 mi
Show comp detail 12 sales within ~0.75 mi
| Address | Dist | Beds/Ba | Sqft | Sold | Price | $/sf | Match |
|---|---|---|---|---|---|---|---|
| 12930 W Chapala Dr | 0.04mi | 2/2.0 | 1,154 (0%) | 3mo | $350,000 | $303 | 91 |
| 22417 N Los Gatos Dr | 0.08mi | 2/2.0 | 1,154 (0%) | 2mo | $337,000 | $292 | 91 |
| 12948 W EL Sueno Ct | 0.02mi | 2/2.0 | 1,154 (0%) | 13mo | $300,000 | $260 | 84 |
| 22504 N San Ramon Dr | 0.07mi | 2/2.0 | 1,154 (0%) | 11mo | $475,000 | $412 | 84 |
| 22524 N San Ramon Dr | 0.06mi | 2/2.0 | 1,154 (0%) | 12mo | $468,000 | $406 | 83 |
| 12934 W Chapala Dr | 0.04mi | 2/2.0 | 1,283 (+11%) | 4mo | $365,000 | $284 | 72 |
| 12945 W EL Sueno Ct | 0.05mi | 2/2.0 | 1,283 (+11%) | 4mo | $355,000 | $277 | 71 |
| 12937 W EL Sueno Ct | 0.05mi | 2/2.0 | 1,283 (+11%) | 10mo | $420,000 | $327 | 66 |
| 12941 W EL Sueno Ct | 0.05mi | 2/2.0 | 1,283 (+11%) | 15mo | $390,000 | $304 | 62 |
| 22520 N San Ramon Dr | 0.06mi | 2/2.0 | 1,283 (+11%) | 16mo | $480,000 | $374 | 62 |
| 22454 N San Ramon Dr | 0.08mi | 2/2.0 | 1,283 (+11%) | 15mo | $450,000 | $351 | 62 |
| 22407 N San Ramon Ct | 0.11mi | 2/2.0 | 1,283 (+11%) | 20mo | $390,000 | $304 | 55 |
Match score weights: distance 35% · size 25% · config 20% · recency 20%. Top-matched comps best support the ARV.
Projected returns pro-forma
-3.0% appreciation · 7.03% rent growth · sell at horizon
- IRR
- -7.2%
- Equity multiple
- 0.72×
- Total profit
- $-24,467
- Equity at exit
- $46,968
- IRR
- 6.9%
- Equity multiple
- 1.61×
- Total profit
- $54,239
- Equity at exit
- $27,235
Cash invested: $88,200 (down + closing). Projections, not guarantees.
Landlord ↔ Tenant lean methodology
- Overall (STATE)
- 87 Strongly Landlord-Friendly
- State Arizona
- 87 Strongly Landlord-Friendly · R+3
- County
- — inherits STATE
- City
- — inherits STATE
ZIP-level market 85375
- Rents YoY
- 7.0%
- Active inventory
- 125
- Price-to-rent
- 8.5×
Monthly cashflow live
- Estimated rent
- $3,074 high interval (Pro) →
- Mortgage (P&I)
- −$1,652
- Tax from tax record
- −$195 /mo · $2,344/yr
- Insurance
- −$131
- HOA
- −$237
- Vacancy / Maint / Mgmt
- −$645
- Net cashflow
- $213
Break-even live
UW: 25.0% down · 7.5% · 30yr · 1.5% tax · 5.0% vac · 8.0% maint · 8.0% mgmt
Financing live
Cash to close
- Down payment
- $78,750
- Closing costs
- $9,450
- Reserves months
- —
- Total cash needed
- —
Loan-product check · same deal, 3 products live
Conventional
25% down · 7.5% · 30yr
- Down + closing
- —
- Monthly P&I
- —
- Monthly cashflow
- —
- DSCR
- —
- Eligible?
- —
Personal DTI + credit; lowest rate.
DSCR
20% down · 8.5% · 30yr
- Down + closing
- —
- Monthly P&I
- —
- Monthly cashflow
- —
- DSCR
- —
- Eligible?
- —
No personal income docs; deal must DSCR.
Hard money
10% down · 12.0% · 12mo
- Down + closing
- —
- Monthly P&I
- —
- Monthly cashflow
- —
- DSCR
- —
- Eligible?
- —
Short-term bridge; refi at stabilization.
Rent comps 5 comps
| Address | Beds | Baths | Sqft | Rent | $/sqft | DOM | Units | Dist |
|---|---|---|---|---|---|---|---|---|
| 13452 W El Sueno Ct Sun City West, AZ | 2.0 | 2.0 | 1378 | $3,200 | $2.32 | 1d | 1 | 0.64mi |
| 22816 N Las Positas Dr Sun City West, AZ | 2.0 | 2.0 | 1351 | $4,500 | $3.33 | 1d | 1 | 0.66mi |
| 13758 W Sola Dr Sun City West, AZ | 2.0 | 1.5 | 1351 | $3,950 | $2.92 | 1d | 1 | 1.06mi |
| 11980 W Dos Rios Dr Sun City, AZ | 3.0 | 2.0 | 1310 | $1,850 | $1.41 | 43d | 1 | 1.41mi |
| 14113 W Robertson Dr Sun City West, AZ | 2.0 | 1.5 | 1410 | $3,800 | $2.70 | 43d | 1 | 1.43mi |
HOA detail
- Monthly dues
- $237 · $2,844/yr
- Likely covers
- gaspoolsecurity
Listing history 34 events
-
2026-06-18days on market $315,000 Active 72 DOM
-
2026-06-17days on market $315,000 Active 71 DOM
-
2026-06-16days on market $315,000 Active 70 DOM
-
2026-06-15days on market $315,000 Active 69 DOM
-
2026-06-13days on market $315,000 Active 67 DOM
-
2026-06-13days on market $315,000 Active 66 DOM
-
2026-06-09days on market $315,000 Active 63 DOM
-
2026-06-08days on market $315,000 Active 62 DOM
-
2026-06-07days on market $315,000 Active 61 DOM
-
2026-06-04days on market $315,000 Active 58 DOM
-
2026-06-03days on market $315,000 Active 57 DOM
-
2026-06-02days on market $315,000 Active 56 DOM
-
2026-06-01days on market $315,000 Active 55 DOM
-
2026-05-31pricedays on market $315,000 Active 54 DOM
-
2026-05-05price $335,000 812-char remark
Show marketing remark (812 chars)
2-bedroom home in the prestigious guard-gated community of Corte Bella Country Club. This desirable split-bedroom floor plan offers an open-concept design, seamlessly connecting the living room, dining, and kitchen--ideal for both everyday living and entertaining. The kitchen is equipped with newer stainless-steel appliances, an induction cooktop, & the added flexibility of an optional gas hookup. The spacious primary suite features dual sinks, a walk-in shower, & a generous walk-in closet, creating a comfortable private retreat. Enjoy resort-style living in Corte Bella, an active adult community known for its exceptional amenities, including a clubhouse, heated pool & spa, tennis and pickleball courts, on-site restaurant, lots of scenic walking paths, and a vibrant calendar of activities.
-
2026-04-07$345,000 Active 812-char remark
Show marketing remark (812 chars)
2-bedroom home in the prestigious guard-gated community of Corte Bella Country Club. This desirable split-bedroom floor plan offers an open-concept design, seamlessly connecting the living room, dining, and kitchen--ideal for both everyday living and entertaining. The kitchen is equipped with newer stainless-steel appliances, an induction cooktop, & the added flexibility of an optional gas hookup. The spacious primary suite features dual sinks, a walk-in shower, & a generous walk-in closet, creating a comfortable private retreat. Enjoy resort-style living in Corte Bella, an active adult community known for its exceptional amenities, including a clubhouse, heated pool & spa, tennis and pickleball courts, on-site restaurant, lots of scenic walking paths, and a vibrant calendar of activities.
-
2025-05-19historical $1,750
-
2025-05-09$1,750
-
2025-05-07historical
-
2025-03-29price $350,000
-
2025-03-06price $365,000
-
2025-02-05price $375,000
-
2025-01-09$399,990 Active
-
2020-10-30soldstatus $262,000 Closed
-
2020-10-30soldstatus $262,000
-
2020-09-20status Pending
-
2020-09-18status Active
-
2020-09-16status Pending
-
2020-09-11$262,500 Active
-
2017-12-29soldstatus $215,000 Closed
-
2017-12-29soldstatus $215,000
-
2017-12-17status Pending
-
2017-11-24historical Under Contract Accepting Backups
-
2017-11-19$220,000 Active
ⓘ Source: listings_history table (triggers on properties + properties_extension) + one-shot
backfill from property_details.listing_events for pre-trigger history.
Tax reassessment forecast AZ · Resets to sale price
- Current annual tax
- $2,344 · $195/mo
- Projected year-2 tax
- $2,344 · $195/mo
- Expected delta
- $0/yr ($0/mo · 0.0%)
ⓘ Screening estimate from a state-policy table — verify with the county assessor before closing.
Climate risk First Street
- Flood 1/10 Low FEMA zone X (shaded) · 0% chance over 30 yrs
- Wildfire 4/10 Moderate
- Heat 9/10 Extreme 7 d/yr ≥114°F today · 16 d/yr by 30 yrs out
- Wind 1/10 Low
- Air quality 2/10 Low 1 unhealthy d/yr today · 1 by 30 yrs out
Nearby sold comps map
Loading sold comps map…
Walkable amenities ~0.75 mi
Loading nearby amenities…
Taxation est. · year 1
- Rental income
- $36,882
- − Mortgage interest
- −$17,645
- − Property taxes
- −$2,344
- − Insurance
- −$1,575
- − Repairs & maintenance
- −$2,951
- − Management
- −$2,951
- − HOA
- −$2,844
- − Depreciation
- −$9,164
- Taxable loss
- −$2,591
- Est. tax savings @ 24.0%
- +$622
- After-tax cash flow
- $3,173/yr
For passive investors: Depreciation is non-cash, so a rental often shows a tax loss while cash-flowing — sheltering income. Rental losses are passive: they offset passive income freely, and up to $25,000/yr can offset ordinary (W-2) income if you actively participate and your MAGI is under $100k (phasing out to $0 by $150k); unused losses carry forward. On sale, claimed depreciation is recaptured at up to 25%, and gains may owe capital-gains tax (a 1031 exchange can defer both). Figures are a year-1 estimate at your 24.0% rate — not tax advice; consult a CPA.
Schools (NCES district)
- District
- Peoria Unified School District (4237)
- NCES district ID
- 0406250
- Math proficiency
- 36% ▼ -14.00%
- Reading proficiency
- 42% ▼ -8.00%
- Median HH income
- $60,171
- Composite
- 34.62/100
- National rank
- #5152
- State rank
- #64 of 249 in AZ
Livability — Sun City West
- Score
- 63/100
- State rank
- #106
- US rank
- #14878
Category grades
Schools grade is shown separately in the Schools card above.
Census & demographics
- Census place
- Sun City West, AZ
- County
- Maricopa County · 4,537,380 people
- City population
- 27,680
- Metro
- Phoenix-Mesa-Chandler, AZ
- Population (ZIP)
- 27,680
- Household income
- $63,928
- Rent vs Own
- Severe rent burden
- 691.0
Population outlook (Maricopa County) Hauer SSP2
- Today (2025)
- 4,979,203 people
- By 2030
- 5,378,229 · +8.0%
- By 2040
- 6,156,598 · +23.6%
- By 2050
- 6,872,376 · +38.0%
- By 2075
- 8,401,270 · +68.7%
- By 2100
- 9,247,439 · +85.7%
Race, ethnicity, and origin ACS 2023
- Neighborhood character
- Predominantly White (94%)
- Race & ethnicity
- White 94% Two or more races 2% Hispanic / Latino 1% Asian 1%
- Common ancestry
- Romanian 5% Portuguese 5% Lithuanian 4%
- Foreign-born
- 4% · Canada
- Languages at home
- 96% English-only · Spanish 2% Russian/Polish/Slavic 1%
Political lean MEDSL · Maricopa
- 2024 margin
- Toss-up / Even · D 47.7% · R 51.2% · Other 1.1%
- 2008→2024 swing
- +7.1pp toward D · 2008: -10.6pp · 2024: -3.5pp
- All cycles
- 2024: R+3.5 2020: D+2.2 2016: R+3.5 2012: R+12.0 2008: R+10.6
Not yet ingested
- Civics
- —
Market trends
- HPI YoY
- ▼ -140.20%
- Current HPI
- 239.3422
- Rent YoY
- ▲ 7.03%
- Metro
- Phoenix-Mesa-Chandler, AZ
- State GDP YoY
- ▲ 4.54%
- F500 in state
- 20
Industry mix (Fortune 500 HQ in AZ)
| Industry | F500 HQs | Revenue |
|---|---|---|
| Technology | 2 | $13B |
|
||
| Mining / Metals | 1 | $23B |
|
||
| Environmental Services | 1 | $16B |
|
||
| Metals / Steel | 1 | $14B |
|
||
| Technology Distribution | 1 | $9B |
|
||
| Homebuilding | 1 | $8B |
|
||
Price history
+52.3% since first listed20 events — show timeline
- 2026-05-05 Price Changed $335,000 ARMLS
- 2026-04-07 Listed $345,000 ARMLS
- 2025-05-19 Rental Removed $1,750 REDFIN
- 2025-05-09 Listed for Rent $1,750 REDFIN
- 2025-05-07 Listing Removed — ARMLS
- 2025-03-29 Price Changed $350,000 ARMLS
- 2025-03-06 Price Changed $365,000 ARMLS
- 2025-02-05 Price Changed $375,000 ARMLS
- 2025-01-09 Listed $399,990 ARMLS
- 2020-10-30 Sold (Public Records) $262,000 Public Records
- 2020-10-30 Sold (MLS) $262,000 ARMLS
- 2020-09-20 Pending — ARMLS
- 2020-09-18 Relisted — ARMLS
- 2020-09-16 Pending — ARMLS
- 2020-09-11 Listed $262,500 ARMLS
- 2017-12-29 Sold (Public Records) $215,000 Public Records
- 2017-12-29 Sold (MLS) $215,000 ARMLS
- 2017-12-17 Pending — ARMLS
- 2017-11-24 Contingent — ARMLS
- 2017-11-19 Listed $220,000 ARMLS
Property tax history
+3.7%/yrLatest (2025): $2,344 · +6.7% YoY. Source: county tax records.
Cash-flow waterfall
monthlySold comps — $/sqft
last 12 mo · ≤1 miLoading sold comps…