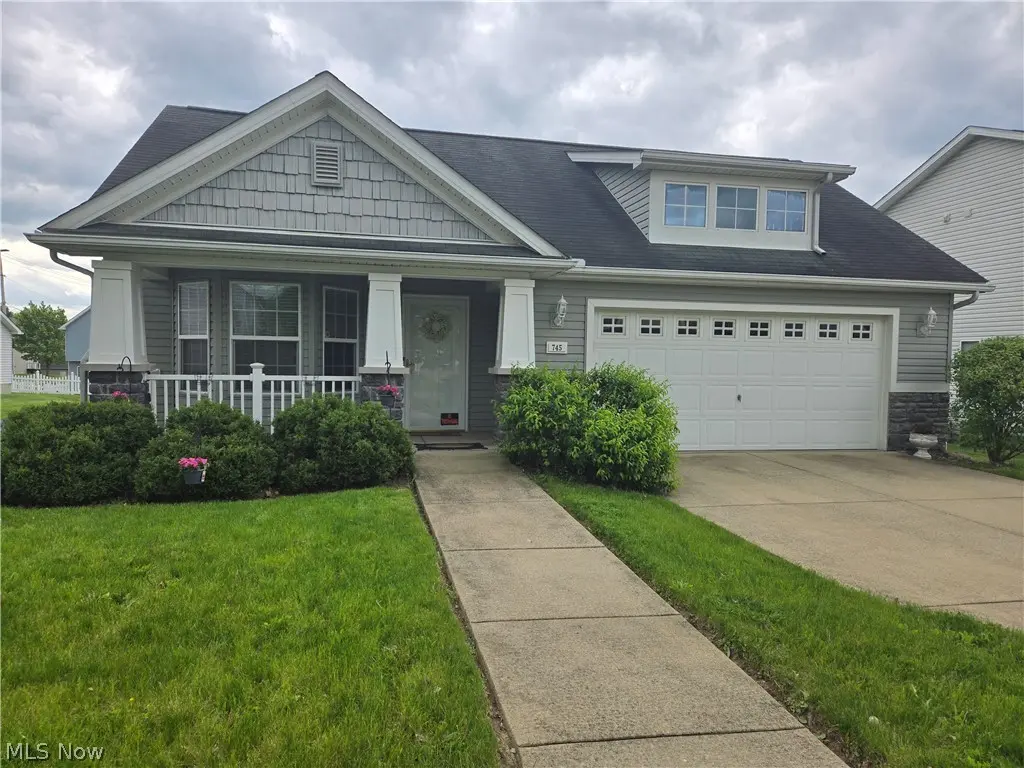
745 Lexington Ave · Youngstown, OH
Flood risk 1/10 · Minimal
- FEMA flood zone
- X (unshaded)
- Chance of flooding over 30 yrs
- 0.0%
- Est. flood insurance / yr
- $507 – $1,088
Fire risk 1/10 · Minimal
- Est. fire insurance / yr
- $713 – $1,323
Heat risk 3/10 · Minor
- Hot days now (above 97°F)
- 7 days/yr
- Hot days in 30 yrs
- 17 days/yr
Wind risk 1/10 · Minimal
- Chance of severe wind over 30 yrs
- —
Air-quality risk 2/10 · Minimal
- Unhealthy air days now
- 1 days/yr
- Unhealthy air days in 30 yrs
- 2 days/yr
Risk factors via First Street. Map © Google.
Why this score? — see what drove the D- grade
The composite is a weighted blend of 9 inputs, each scored 0–100. Each bar is that input's sub-score; the figure is the points it added to the 100-point composite (weight × sub-score).
- Appreciation +10.0/10.0
- Cash flow +8.1/30.0
- ARV discount +7.5/15.0
- Livability +4.0/5.0
- Rent growth +2.5/5.0
- Condition / age +2.5/5.0
- DSCR +2.1/10.0
- 1% rule +1.5/10.0
- Schools +0.9/10.0
$150,000
🖨 Deal sheet (PDF) 📄 Offer letter ✓ Due diligence
Listing remarks MLS
Homes at Arlington Hieghts. Very spacious three bedroom Ranch Home, 2 and a half baths, with a two car attached garage. Energy Star approved home with a 10 year warranty. This newly built home is Eligible for the Buy Into Youngstown Program. Call for your appointment today.
Key facts
- Hot water tank
- Vinyl flooring
- Garbage disposal
Tags
Property features AI
Finance
- HOA & community: Homeowners association: Arlington Heights Homeowners Association; HOA fee $42 quarterly
Exterior
- Parking: Attached garage with 2 spaces
- Security: Security system; Smoke detectors
- Utilities: Public water; Public sewer
- Home design: Single-story; Asbestos shingle roof; Vinyl siding
- Construction: Built per public records; Vinyl siding; Asbestos shingle roof
- Exterior features: Lot approximately 0.176 acres; Security system; Smoke detectors
Interior
- Kitchen: Range; Dishwasher; Garbage disposal; Refrigerator
- Bedrooms: 3 main-level bedrooms
- Bathrooms: 1 full bathroom (main level)
- Heating & cooling: Gas heating; Central air conditioning
- Interior features: Ceiling fan(s)
- Laundry & utility: Dryer
Neighborhood map
What this means for you Summary
Snapshot
- This is a 3-bed/1.0-bath single-family listed at $150k.
Deal economics
- At list price, monthly cash flow is $-150 ($-2k/yr) — negative.
- To cash-flow at today's rent, offer at most $124k (17.6% below list).
- To meet the 1% rule (rent ≥ 1% of price), the offer needs to be $97k (35.3% below list).
- Recommended offer: $97k (35.3% below list) — sets the bar for 1% rule.
- Cap rate 5.1% vs local median 7.0% in Youngstown — below-typical yield; the buyer is paying a premium for something (appreciation thesis, condition, location) that the cap rate doesn't capture.
Location & tenants
- Location reads 81/100 on livability (#99 in OH, #1,506 nationally) — a professional / high-income tenant draw. Strengths: amenities A+, commute A+, cost of living A+; Watch: crime F, employment F.
- Youngstown City (urban): math 8% / reading 17% proficiency, ranked #649 of 656 in OH (top 99%) — low school quality limits family demand, transient renter base, plan for 1-2y turnover; 88% free/reduced lunch — lower-income household profile, screen leases tightly.
- Market conditions: 6 active listings in the ZIP; 10 comparable units currently listed for rent nearby; rentals at typical pace (median 22d on market — plan ~3-4 weeks tenant-placement turnaround); 40% of comp listings sitting > 30 days — soft ceiling on asking rent; lower-income renter base — watch delinquency; 147 units permitted in Mahoning County in 2024 (0 in 5+ unit buildings).
- At $970/mo this rent would consume 56% of the median local household income ($21k/yr) — very limited rent-growth headroom before tenants either downsize or default.
Forward outlook
- In year one you build about $16k of equity ($1k loan paydown + $15k appreciation (10.0% local appreciation)).
- Mahoning County population projected at -14% by 2050 — secular population decline; favor cash flow + early exit over multi-decade hold.
- By year 3, paydown + projected appreciation supports a ~$41k cash-out refi (75% LTV) — recoverable capital for the next deal without selling this one.
Negotiation context
- It's been on market 43 days — a 3% lower offer ($146k) is reasonable based on typical stale-listing flexibility.
- 2 sale attempts since 17y ago with the ask held roughly flat each time — persistent listings suggest the price (not the market) is what's stuck; bring a comps-based counter.
- Current owner paid $50k; list at $150k implies a 201% gain — meaningful room to come down on a strong offer.
Questions for the listing agent
- What do current leases actually rent for vs. the listed asking? Can we see a recent rent roll and the last 12 months of T-12 income?
- It's been on market 43 days. Have you received any prior offers? Is the seller open to a 35% concession, seller financing, or rate buy-down credit?
- What does the HOA fee cover, when was the last increase, and are there any pending special assessments or reserve-fund shortfalls?
- Is there a deadline driving the sale (1031 exchange, divorce, estate, relocation)? That informs how much negotiation room exists.
- Crime grade is F in this area — have there been break-ins, vandalism, or insurance claims at this property in the last 3 years? What carrier currently insures it and at what premium?
- The area grade is low — what's the realistic commute time and amenity access for the typical tenant pool here? Any planned neighborhood developments (good or bad) we should know about?
- What's the average days-on-market for RENTAL listings here right now (not sales)? A rising rental-DOM trend means longer vacancies and softer asking-rent achievability than the comps imply.
- What's the recent tenant-quality profile in this submarket — average credit score on applications, eviction rate, late-payment / NSF rate, and stable-employment percentage? A property-management company in the area should have these aggregated.
- How much new for-sale + rental construction is in the pipeline within 1–3 miles? Heavy new supply typically softens prices + rents 12–24 months out; constrained supply supports both.
Investment metrics
- 1% rule
- 0.65% ✗
- Cap rate
- 5.10%
- Cash-on-cash
- -4.28%
- DSCR
- 0.81
- GRM
- 12.9
CMA / ARV
- ARV (on-the-fly)
- $56,448
- Comps found
- 3
Show comp detail 3 sales within ~0.75 mi
| Address | Dist | Beds/Ba | Sqft | Sold | Price | $/sf | Match |
|---|---|---|---|---|---|---|---|
| 1815 Clifton St | 0.48mi | 3/1.0 | 1,162 (-1%) | 17mo | $55,000 | $47 | 62 |
| 795 Norwood Ave | 0.37mi | 3/1.0 | 1,352 (+15%) | 22mo | $65,000 | $48 | 40 |
| 1028 Burlington St | 0.72mi | 3/1.0 | 1,010 (-14%) | 7mo | $86,920 | $86 | 37 |
Match score weights: distance 35% · size 25% · config 20% · recency 20%. Top-matched comps best support the ARV.
Projected returns pro-forma
10.0% appreciation · 3.0% rent growth · sell at horizon
- IRR
- 21.2%
- Equity multiple
- 2.72×
- Total profit
- $72,103
- Equity at exit
- $135,132
- IRR
- 19.2%
- Equity multiple
- 6.23×
- Total profit
- $219,710
- Equity at exit
- $291,417
Cash invested: $42,000 (down + closing). Projections, not guarantees.
Landlord ↔ Tenant lean methodology
- Overall (STATE)
- 73 Landlord-Friendly
- State Ohio
- 73 Landlord-Friendly · R+6
- County
- — inherits STATE
- City
- — inherits STATE
ZIP-level market 44510
- Home prices YoY
- 8.8%
- Active inventory
- 6
- Price-to-rent
- 12.9×
Monthly cashflow live
- Estimated rent
- $970 high interval (Pro) →
- Mortgage (P&I)
- −$787
- Tax from tax record
- −$53 /mo · $637/yr
- Insurance
- −$62
- HOA
- −$14
- Vacancy / Maint / Mgmt
- −$204
- Net cashflow
- $-150
Break-even live
Sensitivity live
| Price | -10% $-65 | -5% $-107 | +0% $-150 | +5% $-192 | +10% $-235 |
|---|---|---|---|---|---|
| Rent | -10% $-226 | -5% $-188 | +0% $-150 | +5% $-111 | +10% $-73 |
| Rate | -1.0pp $-74 | -0.5pp $-111 | base $-150 | +0.5pp $-189 | +1.0pp $-228 |
UW: 25.0% down · 7.5% · 30yr · 1.5% tax · 5.0% vac · 8.0% maint · 8.0% mgmt
Financing live
Cash to close
- Down payment
- $37,500
- Closing costs
- $4,500
- Reserves months
- —
- Total cash needed
- —
Loan-product check · same deal, 3 products live
Conventional
25% down · 7.5% · 30yr
- Down + closing
- —
- Monthly P&I
- —
- Monthly cashflow
- —
- DSCR
- —
- Eligible?
- —
Personal DTI + credit; lowest rate.
DSCR
20% down · 8.5% · 30yr
- Down + closing
- —
- Monthly P&I
- —
- Monthly cashflow
- —
- DSCR
- —
- Eligible?
- —
No personal income docs; deal must DSCR.
Hard money
10% down · 12.0% · 12mo
- Down + closing
- —
- Monthly P&I
- —
- Monthly cashflow
- —
- DSCR
- —
- Eligible?
- —
Short-term bridge; refi at stabilization.
Rent comps 10 comps
| Address | Beds | Baths | Sqft | Rent | $/sqft | DOM | Units | Dist |
|---|---|---|---|---|---|---|---|---|
| 351 Lincoln Ave Youngstown, OH | 3.0–5.0 | 3.0–5.0 | 1527 | $699 | $0.46 | 14d | 10 | 0.76mi |
| 465 Gypsy Ln Youngstown, OH | 2.0 | 1.0–2.0 | 1060 | $920 | $0.87 | 14d | 1 | 1.08mi |
| 465 Gypsy Ln Youngstown, OH | 2.0 | 2.0 | 1320 | $1,120 | $0.85 | 44d | 1 | 1.15mi |
| 35 Whitney Ave N Youngstown, OH | 3.0 | 1.0 | 1144 | $1,050 | $0.92 | 22d | 1 | 1.23mi |
| 171 Upland Ave Unit 171 2nd floor Youngstown, OH | 3.0 | 1.0 | 1100 | $1,040 | $0.95 | 14d | 1 | 1.40mi |
| 2525 Ohio Ave Unit 2 Youngstown, OH | 2.0 | 1.0 | 1140 | $850 | $0.75 | 44d | 1 | 1.40mi |
| 178 Upland Ave Youngstown, OH | 2.0 | 1.0 | 1000 | $750 | $0.75 | 44d | 1 | 1.42mi |
| 176 Upland Ave Unit 1 Youngstown, OH | 4.0 | 2.0 | 1300 | $1,225 | $0.94 | 44d | 1 | 1.42mi |
| 911 Hawthorne St Youngstown, OH | 3.0 | 1.0 | 1198 | $1,080 | $0.90 | 22d | 1 | 1.47mi |
| 913 Hawthorne St Youngstown, OH | 3.0 | 1.0 | 1198 | $1,080 | $0.90 | 22d | 1 | 1.48mi |
HOA detail
- Monthly dues
- $14 · $168/yr
Listing history 20 events
-
2026-06-19days on market $150,000 Active 43 DOM
-
2026-06-18days on market $150,000 Active 42 DOM
-
2026-06-17days on market $150,000 Active 41 DOM
-
2026-06-16days on market $150,000 Active 40 DOM
-
2026-06-15days on market $150,000 Active 39 DOM
-
2026-06-14days on market $150,000 Active 37 DOM
-
2026-06-13days on market $150,000 Active 36 DOM
-
2026-06-10days on market $150,000 Active 34 DOM
-
2026-06-09days on market $150,000 Active 33 DOM
-
2026-06-08days on market $150,000 Active 32 DOM
-
2026-06-07days on market $150,000 Active 31 DOM
-
2026-06-03days on market $150,000 Active 27 DOM
-
2026-06-02pricedays on market $150,000 Active 26 DOM
-
2026-06-01days on market $155,000 Active 25 DOM
-
2026-05-31days on market $155,000 Active 24 DOM
-
2026-05-30days on market $155,000 Active 23 DOM
-
2026-05-02$155,000 Active
-
2010-03-23soldstatus $49,900 274-char remark
Show marketing remark (274 chars)
Homes at Arlington Hieghts. Very spacious three bedroom Ranch Home, 2 and a half baths, with a two car attached garage. Energy Star approved home with a 10 year warranty. This newly built home is Eligible for the Buy Into Youngstown Program. Call for your appointment today.
-
2010-01-27historical 274-char remark
Show marketing remark (274 chars)
Homes at Arlington Hieghts. Very spacious three bedroom Ranch Home, 2 and a half baths, with a two car attached garage. Energy Star approved home with a 10 year warranty. This newly built home is Eligible for the Buy Into Youngstown Program. Call for your appointment today.
-
2009-02-08$49,900 274-char remark
Show marketing remark (274 chars)
Homes at Arlington Hieghts. Very spacious three bedroom Ranch Home, 2 and a half baths, with a two car attached garage. Energy Star approved home with a 10 year warranty. This newly built home is Eligible for the Buy Into Youngstown Program. Call for your appointment today.
ⓘ Source: listings_history table (triggers on properties + properties_extension) + one-shot
backfill from property_details.listing_events for pre-trigger history.
Tax reassessment forecast OH · Partial reset (capped growth)
- Current annual tax
- $637 · $53/mo
- Projected year-2 tax
- $1,488 · $124/mo
- Expected delta
- +$852/yr (+$71/mo · 133.7%)
ⓘ Screening estimate from a state-policy table — verify with the county assessor before closing.
Climate risk First Street
- Flood 1/10 Low FEMA zone X (unshaded) · 0% chance over 30 yrs
- Wildfire 1/10 Low
- Heat 3/10 Moderate 7 d/yr ≥97°F today · 17 d/yr by 30 yrs out
- Wind 1/10 Low
- Air quality 2/10 Low 1 unhealthy d/yr today · 2 by 30 yrs out
Nearby sold comps map
Loading sold comps map…
Walkable amenities ~0.75 mi
Loading nearby amenities…
Taxation est. · year 1
- Rental income
- $11,643
- − Mortgage interest
- −$8,402
- − Property taxes
- −$637
- − Insurance
- −$750
- − Repairs & maintenance
- −$931
- − Management
- −$931
- − HOA
- −$168
- − Depreciation
- −$4,364
- Taxable loss
- −$4,540
- Est. tax savings @ 24.0%
- +$1,090
- After-tax cash flow
- $-706/yr
For passive investors: Depreciation is non-cash, so a rental often shows a tax loss while cash-flowing — sheltering income. Rental losses are passive: they offset passive income freely, and up to $25,000/yr can offset ordinary (W-2) income if you actively participate and your MAGI is under $100k (phasing out to $0 by $150k); unused losses carry forward. On sale, claimed depreciation is recaptured at up to 25%, and gains may owe capital-gains tax (a 1031 exchange can defer both). Figures are a year-1 estimate at your 24.0% rate — not tax advice; consult a CPA.
Schools (NCES district)
- District
- Youngstown City
- NCES district ID
- 3904516
- Math proficiency
- 8% ▼ -15.00%
- Reading proficiency
- 17% ▼ -10.00%
- Median HH income
- $25,257
- Composite
- 9.29/100
- National rank
- #9858
- State rank
- #649 of 656 in OH
Livability — Youngstown
- Score
- 81/100
- State rank
- #99
- US rank
- #1506
Category grades
Schools grade is shown separately in the Schools card above.
Census & demographics
- Census place
- Youngstown, OH
- County
- Mahoning · 224,175 people
- City population
- 28,503
- Metro
- Youngstown-Warren, OH
- Population (ZIP)
- 2,091
- Household income
- $20,706
- Rent vs Own
- Severe rent burden
- 8.2
Population outlook (Mahoning County) Hauer SSP2
- Today (2025)
- 223,932 people
- By 2030
- 218,387 · -2.5%
- By 2040
- 205,367 · -8.3%
- By 2050
- 193,606 · -13.5%
- By 2075
- 173,694 · -22.4%
- By 2100
- 151,147 · -32.5%
Race, ethnicity, and origin ACS 2023
- Neighborhood character
- Predominantly Black (81%)
- Race & ethnicity
- Black 81% Two or more races 8% Hispanic / Latino 7% White 6%
- Hispanic origin (detail)
- Mexican 1% Puerto Rican 6%
- Languages at home
- 96% English-only · Spanish 4%
Political lean MEDSL · Mahoning
- 2024 margin
- Lean R (+9.4) · D 44.9% · R 54.4%
- 2008→2024 swing
- -36.1pp toward R · 2008: 26.6pp · 2024: -9.4pp
- All cycles
- 2024: R+9.4 2020: R+1.9 2016: D+3.0 2012: D+27.7 2008: D+26.6
Not yet ingested
- Civics
- —
Market trends
- HPI YoY
- ▲ 18.99%
- Current HPI
- 234.6941
- Rent YoY
- —
- Metro
- —
- State GDP YoY
- ▲ 1.98%
- F500 in state
- 48
Industry mix (Fortune 500 HQ in OH)
| Industry | F500 HQs | Revenue |
|---|---|---|
| Insurance | 3 | $145B |
|
||
| Industrial Machinery | 3 | $49B |
|
||
| Financial Services | 3 | $24B |
|
||
| Consumer Goods | 2 | $93B |
|
||
| Aerospace / Defense | 2 | $47B |
|
||
| Utilities | 2 | $33B |
|
||
Price history
+210.6% since first listed4 events — show timeline
- 2026-05-02 Listed $155,000 MLSNOW
- 2010-03-23 Sold (MLS) $49,900 MLSNOW
- 2010-01-27 Listing Removed — MLSNOW
- 2009-02-08 Listed $49,900 MLSNOW
Property tax history
+33.3%/yrLatest (2025): $637 · -47.1% YoY. Source: county tax records.
Cash-flow waterfall
monthlySold comps — $/sqft
last 12 mo · ≤1 miLoading sold comps…