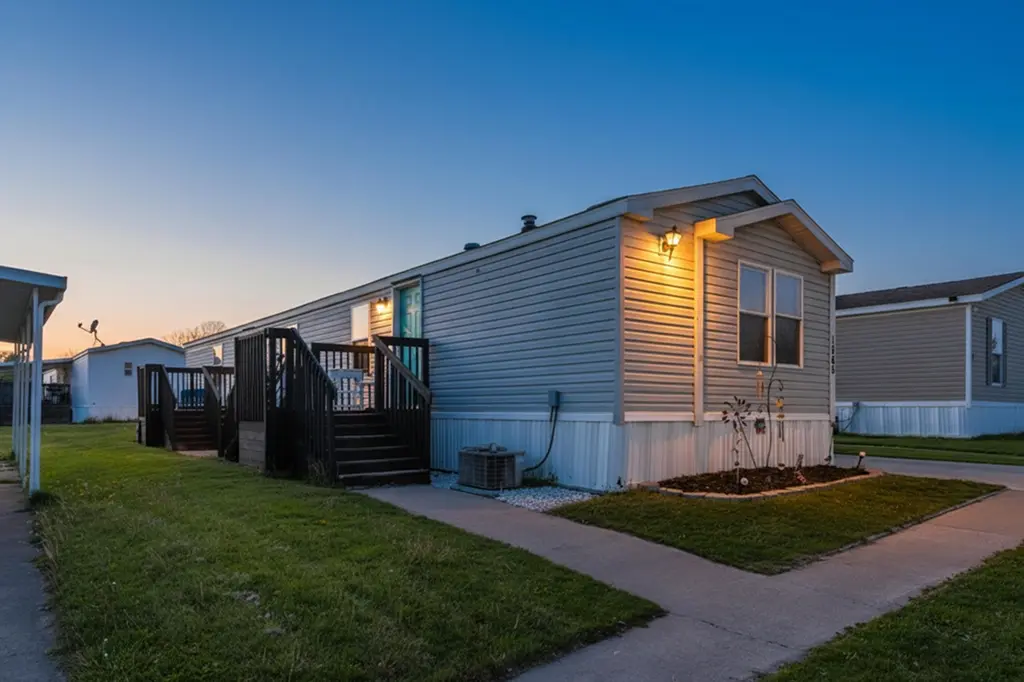
1065 Hazel Nut Ln · Sidney, OH
Flood risk 1/10 · Minimal
- FEMA flood zone
- X (unshaded)
- Chance of flooding over 30 yrs
- 0.0%
- Est. flood insurance / yr
- $507 – $1,088
Fire risk 1/10 · Minimal
- Est. fire insurance / yr
- $713 – $1,323
Heat risk 3/10 · Minor
- Hot days now (above 100°F)
- 7 days/yr
- Hot days in 30 yrs
- 18 days/yr
Wind risk 2/10 · Minimal
- Chance of severe wind over 30 yrs
- —
Air-quality risk 2/10 · Minimal
- Unhealthy air days now
- 1 days/yr
- Unhealthy air days in 30 yrs
- 2 days/yr
Risk factors via First Street. Map © Google.
Why this score? — see what drove the B+ grade
The composite is a weighted blend of 9 inputs, each scored 0–100. Each bar is that input's sub-score; the figure is the points it added to the 100-point composite (weight × sub-score).
- Cash flow +28.8/30.0
- ARV discount +15.0/15.0
- 1% rule +10.0/10.0
- DSCR +10.0/10.0
- Schools +4.2/10.0
- Livability +3.8/5.0
- Condition / age +3.8/5.0
- Rent growth +2.5/5.0
- Appreciation +0.0/10.0
$35,000
🖨 Deal sheet 📄 Offer letter ✓ Due diligence
Listing remarks
This charming 2-bedroom, 2-bath 1998 SCHULT home in Country Meadows Park is packed with potential and personality. Step inside to a smart, functional layout that makes everyday living feel easy and comfortable. Enjoy added peace of mind with a newer furnace, plus appliances already included and a bonus shed for extra storage, making convenience truly unbeatable. Whether you're looking to settle in or add your own personal touches, this home is the perfect opportunity to build equity while creating a space that truly feels like yours.
Key facts
- Newer furnace
- Included appliances
- Bonus shed
Tags
Property features AI
Finance
- Other: Located in the Country Meadows subdivision
- HOA & community: Monthly association fee of $440; Association covers grounds maintenance; Association present
Exterior
- Parking: Carport
- Utilities: Public sewer
- Home design: Residential mobile home; Built in 1998
- Construction: Vinyl siding construction; Built in 1998
- Exterior features: Vinyl siding; Leased lot; Supplied water
Interior
- Bathrooms: 2 full bathrooms
- Heating & cooling: Forced air heating; Natural gas heating
- Interior features: No basement
Neighborhood map
What this means for you Summary
Snapshot
- This is a 2-bed/2.0-bath manufactured listed at $35k. Condition is rated good.
Deal economics
- At list price, monthly cash flow is $118 ($1k/yr) — positive.
- The deal already cash-flows at list — no discount required.
- Meets the 1% rule at list price ($1k rent vs $35k).
- Recommended offer: $34k (3.0% below list) — sets the bar for market timing.
- Cap rate 10.3% vs local median 4.1% in Sidney — top-decile yield for the area; either an underpriced asset or a hidden risk that comps aren't pricing in. Stress-test before assuming the spread holds.
Location & tenants
- Location reads 76/100 on livability (#220 in OH, #3,412 nationally) — a middle-class / working-renter tenant base. Strengths: cost of living A+, housing A+, health & safety A+; Watch: crime C-, employment C-, amenities D.
- Sidney City (town): math 46% / reading 52% proficiency, ranked #454 of 656 in OH (top 69%) — families likely to look elsewhere, expect single-tenant / working-renter base with shorter leases.
- Market conditions: 145 active listings in the ZIP; 14 comparable units currently listed for rent nearby; rentals at typical pace (median 14d on market — plan ~3-4 weeks tenant-placement turnaround); 337 units permitted in Shelby County in 2024 (216 in 5+ unit buildings).
Forward outlook
- Local home prices are declining (-3.0%/yr); year-one equity from $242 of loan paydown is wiped out by about $1k of value loss. Plan a longer hold.
- Shelby County population projected at -18% by 2050 — secular population decline; favor cash flow + early exit over multi-decade hold.
- At projected returns (-3.0% appreciation + 3.0% rent growth), your $10k cash investment doubles in ~8 years — after that, you're playing with house money.
Negotiation context
- It's been on market 53 days — a 3% lower offer ($34k) is reasonable based on typical stale-listing flexibility.
Risks & watch-outs
- Watch-outs: HOA is 43% of rent.
Questions for the listing agent
- It's been on market 53 days. Have you received any prior offers? Is the seller open to a 3% concession, seller financing, or rate buy-down credit?
- What does the HOA fee cover, when was the last increase, and are there any pending special assessments or reserve-fund shortfalls?
- Is there a deadline driving the sale (1031 exchange, divorce, estate, relocation)? That informs how much negotiation room exists.
- What's the average days-on-market for RENTAL listings here right now (not sales)? A rising rental-DOM trend means longer vacancies and softer asking-rent achievability than the comps imply.
- What's the recent tenant-quality profile in this submarket — average credit score on applications, eviction rate, late-payment / NSF rate, and stable-employment percentage? A property-management company in the area should have these aggregated.
- How much new for-sale + rental construction is in the pipeline within 1–3 miles? Heavy new supply typically softens prices + rents 12–24 months out; constrained supply supports both.
Investment metrics
- 1% rule
- 2.89% ✓
- Cap rate
- 10.33%
- Cash-on-cash
- 14.41%
- DSCR
- 1.64
- GRM
- 2.9
CMA / ARV
- ARV (median comp)
- $45,000
- List price
- $35,000
- Delta
- -22.22%
- Verdict
- UNDERPRICED
- Comps
- 2 within 1.0 mi
Show comp detail 1 sale within ~0.75 mi
| Address | Dist | Beds/Ba | Sqft | Sold | Price | $/sf | Match |
|---|---|---|---|---|---|---|---|
| 1112 Hazel Nut | 0.03mi | 3/2.0 (+1) | 1,200 (+14%) | 4mo | $44,000 | $37 | 67 |
Match score weights: distance 35% · size 25% · config 20% · recency 20%. Top-matched comps best support the ARV.
Projected returns pro-forma
-3.0% appreciation · 3.0% rent growth · sell at horizon
- IRR
- 5.5%
- Equity multiple
- 1.22×
- Total profit
- $2,111
- Equity at exit
- $5,219
- IRR
- 15.5%
- Equity multiple
- 2.29×
- Total profit
- $12,653
- Equity at exit
- $3,026
Cash invested: $9,800 (down + closing). Projections, not guarantees.
Landlord ↔ Tenant lean methodology
- Overall (STATE)
- 73 Landlord-Friendly
- State Ohio
- 73 Landlord-Friendly · R+6
- County
- — inherits STATE
- City
- — inherits STATE
ZIP-level market 45365
- Home prices YoY
- -20.1%
- Active inventory
- 145
- Price-to-rent
- 2.9×
Monthly cashflow live
- Estimated rent
- $1,012 high interval (Pro) →
- Mortgage (P&I)
- −$184
- Tax est. 1.5%
- −$44 /mo · $525/yr
- Insurance
- −$15
- HOA
- −$440
- Vacancy / Maint / Mgmt
- −$213
- Net cashflow
- $118
Break-even live
UW: 25.0% down · 7.5% · 30yr · 1.5% tax · 5.0% vac · 8.0% maint · 8.0% mgmt
Financing live
Cash to close
- Down payment
- $8,750
- Closing costs
- $1,050
- Reserves months
- —
- Total cash needed
- —
Loan-product check · same deal, 3 products live
Conventional
25% down · 7.5% · 30yr
- Down + closing
- —
- Monthly P&I
- —
- Monthly cashflow
- —
- DSCR
- —
- Eligible?
- —
Personal DTI + credit; lowest rate.
DSCR
20% down · 8.5% · 30yr
- Down + closing
- —
- Monthly P&I
- —
- Monthly cashflow
- —
- DSCR
- —
- Eligible?
- —
No personal income docs; deal must DSCR.
Hard money
10% down · 12.0% · 12mo
- Down + closing
- —
- Monthly P&I
- —
- Monthly cashflow
- —
- DSCR
- —
- Eligible?
- —
Short-term bridge; refi at stabilization.
Rent comps 14 comps
| Address | Beds | Baths | Sqft | Rent | $/sqft | DOM | Units | Dist |
|---|---|---|---|---|---|---|---|---|
| 776 Country Side Ln Sidney, OH | 3.0 | 1.0 | 1001 | $994 | $0.99 | 2d | 1 | 0.18mi |
| 612 N Wagner Ave Sidney, OH | 2.0 | 1.0 | 700 | $975 | $1.39 | 19d | 1 | 0.30mi |
| 600 N Wagner Ave Sidney, OH | 2.0 | 1.0 | 729 | $975 | $1.34 | 14d | 1 | 0.32mi |
| 560 N Wagner Ave Sidney, OH | 2.0 | 1.0 | 729 | $975 | $1.34 | 2d | 1 | 0.34mi |
| 522 Stonecastle Ct Sidney, OH | 2.0 | 1.0 | 836 | $900 | $1.08 | 43d | 1 | 0.85mi |
| 552 Stonecastle Ct Sidney, OH | 2.0 | 1.0 | 836 | $900 | $1.08 | 43d | 1 | 0.85mi |
| 552 Stonecastle Ct Unit B1 Sidney, OH | 2.0 | 1.5 | 836 | $900 | $1.08 | 43d | 1 | 0.85mi |
| 113 N Ohio Ave Sidney, OH | 1.0 | 1.0 | 671 | $1,226 | $1.83 | 2d | 24 | 0.97mi |
| 121 W Poplar St Sidney, OH | 2.0 | 1.0 | 612 | $1,125 | $1.84 | 2d | 3 | 0.98mi |
| 751 Campbell Rd Sidney, OH | 2.0 | 1.0 | 980 | $1,100 | $1.12 | 2d | 1 | 1.10mi |
| 314 Thompson St Sidney, OH | 3.0 | 1.0 | 1352 | $1,200 | $0.89 | 2d | 1 | 1.40mi |
| 803 S Main Ave Sidney, OH | 2.0 | 1.0 | 1104 | $1,030 | $0.93 | 2d | 1 | 1.50mi |
| 803 S Main Ave Sidney, OH | 2.0 | 1.0 | 1104 | $1,100 | $1.00 | 43d | 1 | 1.50mi |
| 805 S Main Ave Sidney, OH | 3.0 | 1.0 | 1423 | $1,400 | $0.98 | 21d | 1 | 1.50mi |
HOA detail
- Monthly dues
- $440 · $5,280/yr
Listing history 16 events
-
2026-06-18days on market $35,000 Active 53 DOM
-
2026-06-17days on market $35,000 Active 52 DOM
-
2026-06-16days on market $35,000 Active 51 DOM
-
2026-06-15days on market $35,000 Active 50 DOM
-
2026-06-14days on market $35,000 Active 48 DOM
-
2026-06-13pricedays on market $35,000 Active 47 DOM
-
2026-06-10days on market $37,000 Active 45 DOM
-
2026-06-09days on market $37,000 Active 44 DOM
-
2026-06-08days on market $37,000 Active 43 DOM
-
2026-06-07days on market $37,000 Active 42 DOM
-
2026-06-03days on market $37,000 Active 38 DOM
-
2026-06-02days on market $37,000 Active 37 DOM
-
2026-06-01days on market $37,000 Active 36 DOM
-
2026-05-31days on market $37,000 Active 35 DOM
-
2026-05-31pricedays on market $37,000 Active 34 DOM
-
2026-04-26$39,900 Active 539-char remark
ⓘ Source: listings_history table (triggers on properties + properties_extension) + one-shot
backfill from property_details.listing_events for pre-trigger history.
Climate risk First Street
- Flood 1/10 Low FEMA zone X (unshaded) · 0% chance over 30 yrs
- Wildfire 1/10 Low
- Heat 3/10 Moderate 7 d/yr ≥100°F today · 18 d/yr by 30 yrs out
- Wind 2/10 Low
- Air quality 2/10 Low 1 unhealthy d/yr today · 2 by 30 yrs out
Nearby sold comps map
Loading sold comps map…
Walkable amenities ~0.75 mi
Loading nearby amenities…
Taxation est. · year 1
- Rental income
- $12,146
- − Mortgage interest
- −$1,961
- − Property taxes
- −$525
- − Insurance
- −$175
- − Repairs & maintenance
- −$972
- − Management
- −$972
- − HOA
- −$5,280
- − Depreciation
- −$1,018
- Taxable income
- $1,244
- Est. tax owed @ 24.0%
- −$298
- After-tax cash flow
- $1,114/yr
For passive investors: Depreciation is non-cash, so a rental often shows a tax loss while cash-flowing — sheltering income. Rental losses are passive: they offset passive income freely, and up to $25,000/yr can offset ordinary (W-2) income if you actively participate and your MAGI is under $100k (phasing out to $0 by $150k); unused losses carry forward. On sale, claimed depreciation is recaptured at up to 25%, and gains may owe capital-gains tax (a 1031 exchange can defer both). Figures are a year-1 estimate at your 24.0% rate — not tax advice; consult a CPA.
Condition & rehab AI · 12 photos
This charming 2-bedroom, 2-bath home in Country Meadows Park is in good condition with minimal repairs needed. It's move-in ready and offers a great opportunity to add personal touches and increase its value.
Value-add opportunities
- Both Paint exterior siding — Enhances curb appeal and value
- Both Clean gutters — Improves drainage and adds to overall home maintenance
Renovation cost estimate screening
Value-add ROI direction
- Both Paint exterior siding — Enhances curb appeal and value ↑
- Both Clean gutters — Improves drainage and adds to overall home maintenance ↑
ⓘ Cost ranges are severity-bucket heuristics (US national rule-of-thumb). Get contractor quotes + a written scope before underwriting a rehab budget.
Schools (NCES district)
- District
- Sidney City
- NCES district ID
- 3910003
- Math proficiency
- 46% ▼ -14.00%
- Reading proficiency
- 52% ▼ -6.00%
- Median HH income
- $45,974
- Composite
- 41.55/100
- National rank
- #3443
- State rank
- #454 of 656 in OH
Livability — Sidney
- Score
- 76/100
- State rank
- #220
- US rank
- #3412
Category grades
Schools grade is shown separately in the Schools card above.
Census & demographics
- Census place
- Sidney, OH
- County
- Shelby · 44,840 people
- City population
- 28,955
- Population (ZIP)
- 28,955
- Household income
- $66,044
- Rent vs Own
- Severe rent burden
- 5.7
Population outlook (Shelby County) Hauer SSP2
- Today (2025)
- 47,264 people
- By 2030
- 45,935 · -2.8%
- By 2040
- 42,786 · -9.5%
- By 2050
- 38,981 · -17.5%
- By 2075
- 30,225 · -36.1%
- By 2100
- 21,273 · -55.0%
Race, ethnicity, and origin ACS 2023
- Neighborhood character
- Predominantly White (90%)
- Race & ethnicity
- White 90% Two or more races 4% Black 3% Hispanic / Latino 2%
- Common ancestry
- Lithuanian 3% Slovak 1% Italian 1%
- Foreign-born
- 2% · Canada
- Languages at home
- 98% English-only · Spanish 1%
Political lean MEDSL · Shelby
- 2024 margin
- Solid R (+64.8) · D 17.2% · R 82.0%
- 2008→2024 swing
- -28.5pp toward R · 2008: -36.4pp · 2024: -64.8pp
- All cycles
- 2024: R+64.8 2020: R+63.2 2016: R+60.6 2012: R+46.0 2008: R+36.4
Not yet ingested
- Civics
- —
Market trends
- HPI YoY
- ▼ -66.62%
- Current HPI
- 264.4532
- Rent YoY
- —
- Metro
- —
- State GDP YoY
- ▲ 1.98%
- F500 in state
- 48
Industry mix (Fortune 500 HQ in OH)
| Industry | F500 HQs | Revenue |
|---|---|---|
| Insurance | 3 | $145B |
|
||
| Industrial Machinery | 3 | $49B |
|
||
| Financial Services | 3 | $24B |
|
||
| Consumer Goods | 2 | $93B |
|
||
| Aerospace / Defense | 2 | $47B |
|
||
| Utilities | 2 | $33B |
|
||
Price history
-12.3% since first listed3 events — show timeline
- 2026-06-11 Price Changed $35,000 WRIST
- 2026-05-30 Price Changed $37,000 WRIST
- 2026-04-26 Listed $39,900 WRIST
Cash-flow waterfall
monthlySold comps — $/sqft
last 12 mo · ≤1 miLoading sold comps…