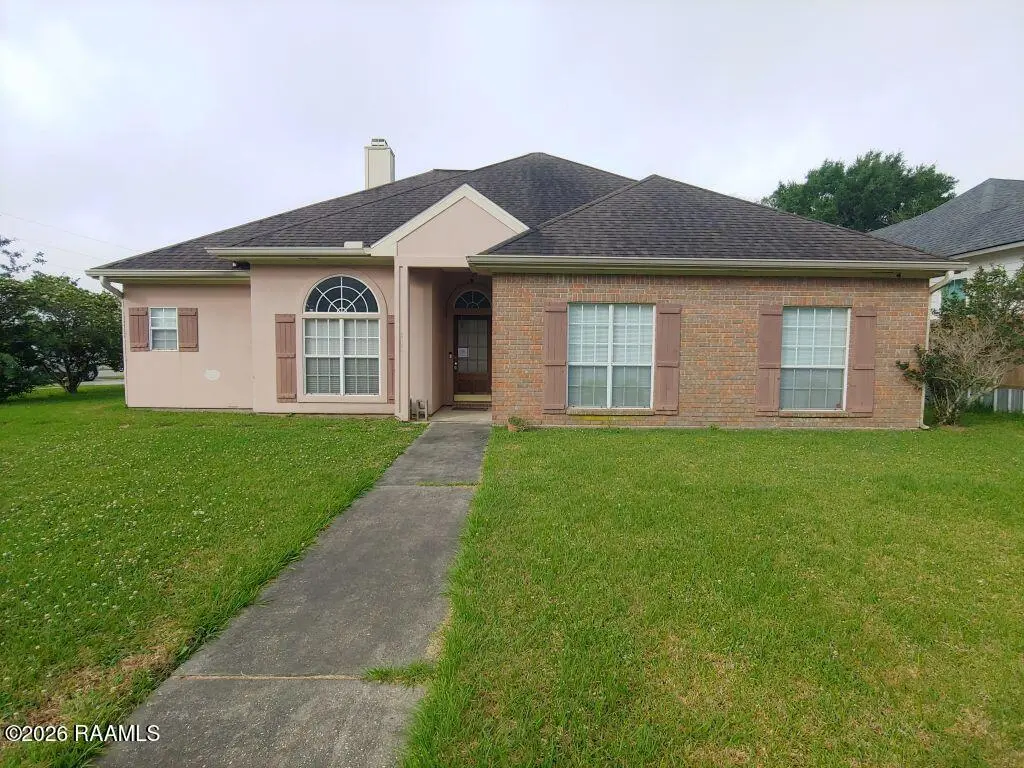
408 E Martial Ave · Lafayette, LA
Flood risk 6/10 · Moderate
- FEMA flood zone
- AE
- Chance of flooding over 30 yrs
- 0.72%
- Est. flood insurance / yr
- $1,737 – $8,500
Fire risk 1/10 · Minimal
- Est. fire insurance / yr
- $1,269 – $2,357
Heat risk 9/10 · Severe
- Hot days now (above 108°F)
- 7 days/yr
- Hot days in 30 yrs
- 21 days/yr
Wind risk 9/10 · Severe
- Chance of severe wind over 30 yrs
- 99.0%
Air-quality risk 2/10 · Minimal
- Unhealthy air days now
- 0 days/yr
- Unhealthy air days in 30 yrs
- 1 days/yr
Risk factors via First Street. Map © Google.
Why this score? — see what drove the B+ grade
The composite is a weighted blend of 9 inputs, each scored 0–100. Each bar is that input's sub-score; the figure is the points it added to the 100-point composite (weight × sub-score).
- Cash flow +30.0/30.0
- ARV discount +15.0/15.0
- 1% rule +10.0/10.0
- DSCR +10.0/10.0
- Schools +3.6/10.0
- Livability +3.5/5.0
- Rent growth +2.8/5.0
- Condition / age +2.5/5.0
- Appreciation +0.0/10.0
$188,000
🖨 Deal sheet 📄 Offer letter ✓ Due diligence
Listing remarks MLS
DEVIN HOMES WILL PAY UP TO $2800 IN TOWARDS CLOSING OR INTERIOR FURNISHINGS HOME COMPLETED WITH MANY EXTRAS BEING IN THE PARADE OF HOMES BEAUTY AND CHARM SURROUNDS THIS BEAUTIFUL NEW CONSTRUCTION. SPLIT FLOOR PLAN, DINING ROOM WITH DOUBLE TREY CEILING AND BRAZILIAN CHERRY WOOD FLRING. FLOOD ZONE C. LRG CORNER LOT. *UC TAKING BUPS TILL LOAN APPV.
Key facts
- Large living room
- Dining room
- Fenced backyard
Tags
Property features AI
Exterior
- Parking: 2 covered parking spaces; 2 total parking spaces; 2-car garage
- Utilities: Gas service by Atmos; Public sewer; Electric service by city
- Home design: Single family residence; City street frontage; Paved road access
- Construction: Brick veneer and stucco exterior; Composition roof
- Exterior features: Full wood fencing; Covered patio/porch
Interior
- Kitchen: Dishwasher; Disposal; Microwave
- Flooring: Carpet; Tile; Wood
- Bathrooms: 2 full bathrooms
- Heating & cooling: Central heating (electric); Central air conditioning
- Interior features: Built-in features; Vaulted ceilings; Tile counters; 1 fireplace
Neighborhood map
What this means for you Summary
Snapshot
- This is a 3-bed/2.0-bath single-family listed at $188k.
Deal economics
- At list price, monthly cash flow is $726 ($9k/yr) — positive.
- The deal already cash-flows at list — no discount required.
- Meets the 1% rule at list price ($3k rent vs $188k).
- Cap rate 13.7% vs local median 4.7% in Lafayette — top-decile yield for the area; either an underpriced asset or a hidden risk that comps aren't pricing in. Stress-test before assuming the spread holds.
Location & tenants
- Location reads 70/100 on livability (#63 in LA) — a middle-class / working-renter tenant base. Strengths: cost of living A+, housing A+, health & safety A+; Watch: amenities C-, employment C-, crime F.
- Lafayette Parish (urban): math 38% / reading 46% proficiency, ranked #19 of 98 in LA (top 19%) — families likely to look elsewhere, expect single-tenant / working-renter base with shorter leases.
- Zoned schools: Edgar Martin Middle School (math 40% / reading 53%, grade D+, #41 of 218 statewide, top 19%, 490 students, 59% FRL); O. Comeaux High School (math 38% / reading 40%, grade F, #86 of 265 statewide, top 33%, 1,098 students, 56% FRL) — zoned schools at 58% FRL track the district average.
- Market conditions: Rents rising (+1.2%/yr); 464 active listings in the ZIP; 26 comparable units currently listed for rent nearby; rentals lingering (median 44d on market — plan ~5-8 weeks vacancy on turnover, expect pricing pressure); 54% of comp listings sitting > 30 days — soft ceiling on asking rent; solid renter incomes; 1,585 units permitted in Lafayette Parish in 2024 (10 in 5+ unit buildings).
- This rent runs 42% of the median local income ($86k/yr) — at the standard rent-burdened threshold; future hikes will face affordability resistance.
Forward outlook
- Local home prices are declining (-3.0%/yr); year-one equity from $1k of loan paydown is wiped out by about $6k of value loss. Plan a longer hold.
- Lafayette County population projected at +34% by 2050 — long-run rental-demand tailwind backs the buy-and-hold thesis.
- At projected returns (-3.0% appreciation + 1.2% rent growth), your $53k cash investment doubles in ~9 years — after that, you're playing with house money.
Negotiation context
- Only 9 days on market — expect competitive offers; lowballing is unlikely to land.
- 2 sale attempts since 30y ago with the ask held roughly flat each time — persistent listings suggest the price (not the market) is what's stuck; bring a comps-based counter.
- Current owner paid $152k; 24% above their basis — modest negotiation headroom, anchor on the comps not their cost.
Risks & watch-outs
- Watch-outs: flood insurance adds $427/mo.
- Climate carrying-cost: in FEMA flood zone AE (mandatory federal flood insurance); severe wind risk, 99% chance of damaging wind over 30y; extreme-heat days projected 7→21/yr by 2055 (HVAC capex compounding) — expect insurance premiums to compound above CPI over the hold.
Questions for the listing agent
- What's the actual annual flood-insurance premium (NFIP or private), and is the property in a SFHA with mandatory coverage?
- Is there a deadline driving the sale (1031 exchange, divorce, estate, relocation)? That informs how much negotiation room exists.
- Schools are B-rated — typically a magnet for longer-tenancy family renters. What's the average tenant stay here, and is there a school-zone premium baked into asking?
- Crime grade is F in this area — have there been break-ins, vandalism, or insurance claims at this property in the last 3 years? What carrier currently insures it and at what premium?
- What's the average days-on-market for RENTAL listings here right now (not sales)? A rising rental-DOM trend means longer vacancies and softer asking-rent achievability than the comps imply.
- What's the recent tenant-quality profile in this submarket — average credit score on applications, eviction rate, late-payment / NSF rate, and stable-employment percentage? A property-management company in the area should have these aggregated.
- How much new for-sale + rental construction is in the pipeline within 1–3 miles? Heavy new supply typically softens prices + rents 12–24 months out; constrained supply supports both.
Investment metrics
- 1% rule
- 1.62% ✓
- Cap rate
- 13.65%
- Cash-on-cash
- 26.28%
- DSCR
- 2.17
- GRM
- 5.1
CMA / ARV
- ARV (on-the-fly)
- $334,656
- Comps found
- 12
Show comp detail 12 sales within ~0.75 mi
| Address | Dist | Beds/Ba | Sqft | Sold | Price | $/sf | Match |
|---|---|---|---|---|---|---|---|
| 202 Ashland Park Dr | 0.12mi | 3/2.0 | 2,125 (+7%) | 1mo | $312,500 | $147 | 82 |
| 108 Eldridge Dr | 0.23mi | 3/2.0 | 1,885 (-5%) | 10mo | $290,000 | $154 | 72 |
| 206 Porch View Dr | 0.37mi | 3/2.0 | 2,005 (+1%) | 14mo | $458,450 | $229 | 70 |
| 205 Hearth St | 0.37mi | 3/2.0 | 2,015 (+1%) | 13mo | $469,999 | $233 | 70 |
| 130 Hathaway Dr | 0.43mi | 3/2.0 | 2,000 (+0%) | 12mo | $299,900 | $150 | 70 |
| 210 Porch View Dr | 0.37mi | 3/3.0 | 1,947 (-2%) | 12mo | $415,000 | $213 | 65 |
| 213 Durham Dr | 0.25mi | 3/2.0 | 1,757 (-12%) | 4mo | $295,000 | $168 | 65 |
| 219 Durham Dr | 0.28mi | 3/2.0 | 1,757 (-12%) | 4mo | $295,000 | $168 | 64 |
| 118 Durham Dr | 0.17mi | 3/2.0 | 1,785 (-10%) | 16mo | $300,000 | $168 | 61 |
| 122 Thrush Loop | 0.50mi | 3/2.5 | 2,156 (+8%) | 8mo | $290,000 | $135 | 54 |
| 102 Hearth St | 0.37mi | 3/2.0 | 2,227 (+12%) | 16mo | $470,000 | $211 | 50 |
| 114 Tern Cir | 0.46mi | 3/2.0 | 1,753 (-12%) | 16mo | $257,500 | $147 | 46 |
Match score weights: distance 35% · size 25% · config 20% · recency 20%. Top-matched comps best support the ARV.
Projected returns pro-forma
-3.0% appreciation · 1.23% rent growth · sell at horizon
- IRR
- 5.4%
- Equity multiple
- 1.20×
- Total profit
- $10,752
- Equity at exit
- $28,031
- IRR
- 12.9%
- Equity multiple
- 1.93×
- Total profit
- $48,979
- Equity at exit
- $16,255
Cash invested: $52,640 (down + closing). Projections, not guarantees.
Landlord ↔ Tenant lean methodology
- Overall (STATE)
- 90 Strongly Landlord-Friendly
- State Louisiana
- 90 Strongly Landlord-Friendly · R+12
- County
- — inherits STATE
- City
- — inherits STATE
ZIP-level market 70508
- Home prices YoY
- -34.7%
- Rents YoY
- 1.2%
- Active inventory
- 464
- Price-to-rent
- 5.1×
Monthly cashflow live
- Estimated rent
- $3,042 high interval (Pro) →
- Mortgage (P&I)
- −$986
- Tax from tax record
- −$186 /mo · $2,234/yr
- Insurance
- −$78
- Flood insurance flood zone
- −$427 /mo · $5,118/yr
- HOA
- −$0
- Vacancy / Maint / Mgmt
- −$639
- Net cashflow
- $726
Break-even live
UW: 25.0% down · 7.5% · 30yr · 1.5% tax · 5.0% vac · 8.0% maint · 8.0% mgmt
Financing live
Cash to close
- Down payment
- $47,000
- Closing costs
- $5,640
- Reserves months
- —
- Total cash needed
- —
Loan-product check · same deal, 3 products live
Conventional
25% down · 7.5% · 30yr
- Down + closing
- —
- Monthly P&I
- —
- Monthly cashflow
- —
- DSCR
- —
- Eligible?
- —
Personal DTI + credit; lowest rate.
DSCR
20% down · 8.5% · 30yr
- Down + closing
- —
- Monthly P&I
- —
- Monthly cashflow
- —
- DSCR
- —
- Eligible?
- —
No personal income docs; deal must DSCR.
Hard money
10% down · 12.0% · 12mo
- Down + closing
- —
- Monthly P&I
- —
- Monthly cashflow
- —
- DSCR
- —
- Eligible?
- —
Short-term bridge; refi at stabilization.
Rent comps 26 comps
| Address | Beds | Baths | Sqft | Rent | $/sqft | DOM | Units | Dist |
|---|---|---|---|---|---|---|---|---|
| 204 Student Ln Lafayette, LA | 3.0 | 2.0 | 1976 | $3,500 | $1.77 | 43d | 1 | 0.01mi |
| 202 Student Ln Lafayette, LA | 4.0 | 2.0 | 2017 | $4,000 | $1.98 | 43d | 1 | 0.02mi |
| 406 E Martial Ave Lafayette, LA | 4.0 | 2.0 | 2017 | $5,000 | $2.48 | 43d | 1 | 0.03mi |
| 404 E Martial Ave Lafayette, LA | 4.0 | 2.0 | 2017 | $4,000 | $1.98 | 43d | 1 | 0.07mi |
| 402 E Martial Ave Lafayette, LA | 3.0 | 2.0 | 1500 | $4,000 | $2.67 | 43d | 1 | 0.08mi |
| 115 La Rue Vil Lafayette, LA | 3.0 | 2.0 | 1860 | $1,900 | $1.02 | 44d | 1 | 0.14mi |
| 150 La Rue Vil Lafayette, LA | 3.0 | 2.0 | 1650 | $1,650 | $1.00 | 13d | 1 | 0.17mi |
| 110 E Martial Ave Lafayette, LA | 1.0–3.0 | 1.0–2.0 | 1047 | $1,535 | $1.47 | 13d | 5 | 0.30mi |
| 5530 Ambassador Caffrey Blvd Lafayette, LA | 1.0–3.0 | 1.0–2.0 | 1194 | $1,875 | $1.57 | 13d | 15 | 0.35mi |
| 119 Coconut Grove Cir Lafayette, LA | 3.0 | 2.5 | 1600 | $1,800 | $1.12 | 43d | 1 | 0.38mi |
| 1521 Camellia Blvd Lafayette, LA | 1.0–3.0 | 1.0–2.0 | 1246 | $2,342 | $1.88 | 13d | 16 | 0.46mi |
| 110 Frem Boustany Dr Lafayette, LA | 1.0–3.0 | 1.0–2.0 | 1026 | $2,030 | $1.98 | 21d | 15 | 0.75mi |
| 201 Settlers Trace Blvd Lafayette, LA | 1.0–3.0 | 1.0–2.0 | 1024 | $1,848 | $1.80 | 13d | 12 | 0.77mi |
| 1510 Kaliste Saloom Rd #404 Lafayette, LA | 3.0 | 2.5 | 1398 | $4,000 | $2.86 | 43d | 1 | 0.88mi |
| 104 shirekeep Ln Lafayette, LA | 2.0 | 2.5 | 1311 | $2,075 | $1.58 | 43d | 1 | 0.99mi |
| 104 shirekeep Ln Lafayette, LA | 2.0 | 2.5 | 1311 | $1,985 | $1.51 | 13d | 1 | 0.99mi |
| 302 Richland Ave Unit 103C Lafayette, LA | 2.0 | 2.0 | 1409 | $4,200 | $2.98 | 43d | 1 | 1.04mi |
| 536 Settlers Trace Blvd Lafayette, LA | 1.0–3.0 | 1.0–2.0 | 1103 | $1,795 | $1.63 | 13d | 10 | 1.08mi |
| 102 Orchard Park Ave Lafayette, LA | 4.0 | 3.0 | 2464 | $4,200 | $1.70 | 13d | 1 | 1.14mi |
| 210 Polly Ln Lafayette, LA | 1.0–3.0 | 1.0–2.0 | 1064 | $1,686 | $1.58 | 13d | 23 | 1.25mi |
| 207 Summerland Key Ln Lafayette, LA | 4.0 | 3.0 | 2018 | $2,350 | $1.16 | 44d | 1 | 1.37mi |
| 108 Beaulac Ln Lafayette, LA | 2.0 | 2.0 | 1450 | $2,950 | $2.03 | 43d | 1 | 1.39mi |
| 113 Templeton Dr Lafayette, LA | 3.0 | 2.5 | 2050 | $3,000 | $1.46 | 43d | 1 | 1.40mi |
| 107 Papwood Cir Lafayette, LA | 3.0 | 2.0 | 1805 | $2,000 | $1.11 | 21d | 1 | 1.41mi |
| 1003 Camellia Blvd Unit 200 Lafayette, LA | 3.0 | 3.0 | 2550 | $3,800 | $1.49 | 43d | 1 | 1.47mi |
| 13 Heatherstone Dr Lafayette, LA | 3.0 | 2.0 | 1995 | $2,800 | $1.40 | 21d | 1 | 1.50mi |
Listing history 9 events
-
2026-06-09status $188,000 Pending 9 DOM
-
2026-06-08days on market $188,000 Active 9 DOM
-
2026-06-07days on market $188,000 Active 8 DOM
-
2026-06-05days on market $188,000 Active 5 DOM
-
2026-06-03days on market $188,000 Active 4 DOM
-
2026-06-02days on market $188,000 Active 3 DOM
-
2026-06-01days on market $188,000 Active 2 DOM
-
2026-05-31remarks 277-char remark
-
2026-05-31$188,000 Active 1 DOM
ⓘ Source: listings_history table (triggers on properties + properties_extension) + one-shot
backfill from property_details.listing_events for pre-trigger history.
Tax reassessment forecast LA · Resets to sale price
- Current annual tax
- $2,234 · $186/mo
- Projected year-2 tax
- $2,234 · $186/mo
- Expected delta
- $0/yr ($0/mo · 0.0%)
ⓘ Screening estimate from a state-policy table — verify with the county assessor before closing.
Climate risk First Street
- Flood 6/10 Major FEMA zone AE · 72% chance over 30 yrs
- Wildfire 1/10 Low
- Heat 9/10 Extreme 7 d/yr ≥108°F today · 21 d/yr by 30 yrs out
- Wind 9/10 Extreme 99% chance of damaging wind over 30 yrs
- Air quality 2/10 Low 0 unhealthy d/yr today · 1 by 30 yrs out
Nearby sold comps map
Loading sold comps map…
Walkable amenities ~0.75 mi
Loading nearby amenities…
Taxation est. · year 1
- Rental income
- $36,506
- − Mortgage interest
- −$10,531
- − Property taxes
- −$2,234
- − Insurance
- −$6,058
- − Repairs & maintenance
- −$2,920
- − Management
- −$2,920
- − Depreciation
- −$5,469
- Taxable income
- $6,372
- Est. tax owed @ 24.0%
- −$1,529
- After-tax cash flow
- $7,187/yr
For passive investors: Depreciation is non-cash, so a rental often shows a tax loss while cash-flowing — sheltering income. Rental losses are passive: they offset passive income freely, and up to $25,000/yr can offset ordinary (W-2) income if you actively participate and your MAGI is under $100k (phasing out to $0 by $150k); unused losses carry forward. On sale, claimed depreciation is recaptured at up to 25%, and gains may owe capital-gains tax (a 1031 exchange can defer both). Figures are a year-1 estimate at your 24.0% rate — not tax advice; consult a CPA.
Schools (NCES district)
- District
- Lafayette Parish
- NCES district ID
- 2200870
- Math proficiency
- 38% ▼ -32.00%
- Reading proficiency
- 46% ▼ -24.00%
- Median HH income
- $50,238
- Composite
- 36.15/100
- National rank
- #4741
- State rank
- #19 of 98 in LA
Livability — Lafayette
- Score
- 70/100
- State rank
- #63
- US rank
- #8133
Category grades
Schools grade is shown separately in the Schools card above.
Census & demographics
- Census place
- Lafayette, LA
- County
- Lafayette Parish · 207,544 people
- City population
- 158,114
- Metro
- Lafayette, LA
- Population (ZIP)
- 40,592
- Household income
- $86,005
- Rent vs Own
- Severe rent burden
- 1860.0
Population outlook (Lafayette County) Hauer SSP2
- Today (2025)
- 280,930 people
- By 2030
- 301,092 · +7.2%
- By 2040
- 339,456 · +20.8%
- By 2050
- 375,156 · +33.5%
- By 2075
- 451,672 · +60.8%
- By 2100
- 497,203 · +77.0%
Race, ethnicity, and origin ACS 2023
- Neighborhood character
- Predominantly White (75%)
- Race & ethnicity
- White 75% Black 13% Two or more races 7% Hispanic / Latino 5% Asian 3%
- Common ancestry
- Lithuanian 20% Slovak 2% Italian 1%
- Foreign-born
- 5% · Canada, China
- Languages at home
- 91% English-only · Spanish 3% French/Haitian/Cajun 2% Other Indo-European 1%
Political lean MEDSL · Lafayette
- 2024 margin
- Solid R (+31.4) · D 33.5% · R 64.8% · Other 1.7%
- 2008→2024 swing
- -0.1pp no change · 2008: -31.3pp · 2024: -31.4pp
- All cycles
- 2024: R+31.4 2020: R+28.7 2016: R+33.6 2012: R+33.7 2008: R+31.3
Not yet ingested
- Civics
- —
Market trends
- HPI YoY
- ▼ -76.28%
- Current HPI
- 143.6305
- Rent YoY
- ▲ 1.23%
- Metro
- Lafayette, LA
- State GDP YoY
- ▲ 3.29%
- F500 in state
- 10
Industry mix (Fortune 500 HQ in LA)
| Industry | F500 HQs | Revenue |
|---|---|---|
| Telecommunications | 2 | $23B |
|
||
| Utilities | 1 | $12B |
|
||
| Wholesale / Distribution | 1 | $5B |
|
||
| Advertising | 1 | $2B |
|
||
Price history
+24.1% since first listed3 events — show timeline
- 2026-05-30 Listed $188,000 AcadianaMLS
- 1996-08-23 Sold (MLS) $151,500 AcadianaMLS
- 1996-03-18 Listed $151,500 AcadianaMLS
Property tax history
+7.1%/yrLatest (2025): $2,234 · -1.1% YoY. Source: county tax records.
Cash-flow waterfall
monthlySold comps — $/sqft
last 12 mo · ≤1 miLoading sold comps…