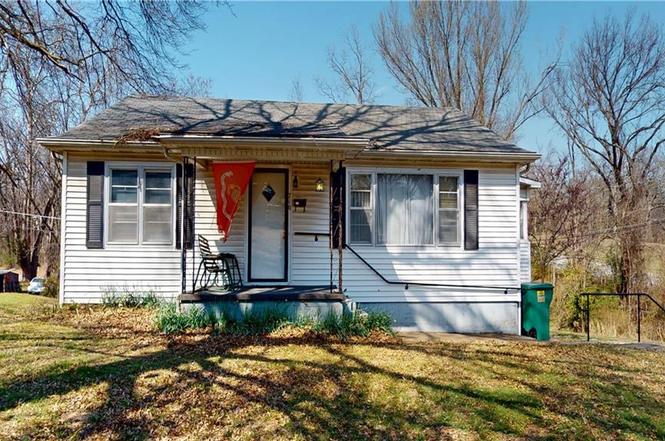
710 W Ewing St · Nevada, MO
Flood risk 8/10 · Major
- FEMA flood zone
- X (unshaded)
- Chance of flooding over 30 yrs
- 0.99%
- Est. flood insurance / yr
- $473 – $860
Fire risk 3/10 · Minor
- Est. fire insurance / yr
- $1,054 – $1,958
Heat risk 5/10 · Moderate
- Hot days now (above 108°F)
- 7 days/yr
- Hot days in 30 yrs
- 19 days/yr
Wind risk 2/10 · Minimal
- Chance of severe wind over 30 yrs
- 2.0%
Air-quality risk 2/10 · Minimal
- Unhealthy air days now
- 0 days/yr
- Unhealthy air days in 30 yrs
- 1 days/yr
Risk factors via First Street. Map © Google.
Why this score? — see what drove the D grade
The composite is a weighted blend of 9 inputs, each scored 0–100. Each bar is that input's sub-score; the figure is the points it added to the 100-point composite (weight × sub-score).
- Cash flow +15.0/30.0
- ARV discount +7.5/15.0
- 1% rule +5.0/10.0
- DSCR +5.0/10.0
- Schools +3.2/10.0
- Livability +3.0/5.0
- Rent growth +2.5/5.0
- Condition / age +2.5/5.0
- Appreciation +0.0/10.0
$1
🖨 Deal sheet 📄 Offer letter ✓ Due diligence
Listing remarks MLS
Very well kept home with family room in basement. Laundry room & 1 bath in basement also. Hardwood floors under carpets in most upstairs.
Key facts
- Screened-in porch
- Front porch
- Storage shed
Tags
Neighborhood map
What this means for you Summary
Snapshot
- This is a 3-bed/1.0-bath single-family listed at $1.
Deal economics
- At list price, monthly cash flow is $671 ($8k/yr) — positive.
- The deal already cash-flows at list — no discount required.
- Meets the 1% rule at list price ($920 rent vs $1).
- Cap rate 871759.8% vs local median 4.9% in Nevada — top-decile yield for the area; either an underpriced asset or a hidden risk that comps aren't pricing in. Stress-test before assuming the spread holds.
Location & tenants
- Location reads 59/100 on livability (#519 in MO) — a working-class tenant base; expect higher turnover. Strengths: cost of living A+, housing A; Watch: crime F, amenities F, commute F.
- Nevada R-V (town): math 33% / reading 44% proficiency, ranked #180 of 324 in MO (top 56%) — families likely to look elsewhere, expect single-tenant / working-renter base with shorter leases.
- Zoned schools: Nevada High (math 38% / reading 52%, grade D-, #176 of 521 statewide, top 34%, 786 students, 48% FRL) — zoned schools at 48% FRL track the district average.
- Market conditions: 104 active listings in the ZIP; 4 comparable units currently listed for rent nearby; rentals lingering (median 44d on market — plan ~5-8 weeks vacancy on turnover, expect pricing pressure); 100% of comp listings sitting > 30 days — soft ceiling on asking rent; 57 units permitted in Vernon County in 2024 (38 in 5+ unit buildings).
Forward outlook
- Local home prices are declining (-3.0%/yr); year-one equity from $0 of loan paydown is wiped out by about $0 of value loss. Plan a longer hold.
- Vernon County population projected at -13% by 2050 — secular population decline; favor cash flow + early exit over multi-decade hold.
- At projected returns (-3.0% appreciation + 3.0% rent growth), your $0 cash investment doubles in ~1 year — after that, you're playing with house money.
Negotiation context
- It's been on market 46 days — a 3% lower offer ($0) is reasonable based on typical stale-listing flexibility.
- 2 sale attempts since 16y ago with the ask held roughly flat each time — persistent listings suggest the price (not the market) is what's stuck; bring a comps-based counter.
Risks & watch-outs
- Watch-outs: flood insurance adds $56/mo; built in 1950 — expect roof / HVAC / electrical / plumbing capex.
- Climate carrying-cost: severe flood risk; extreme-heat days projected 7→19/yr by 2055 (HVAC capex compounding) — expect insurance premiums to compound above CPI over the hold.
Questions for the listing agent
- It's been on market 46 days. Have you received any prior offers? Is the seller open to a 5% concession, seller financing, or rate buy-down credit?
- Built in 1950 — when were the roof, HVAC, electrical panel, plumbing, and water heater last replaced?
- What's the actual annual flood-insurance premium (NFIP or private), and is the property in a SFHA with mandatory coverage?
- Is there a deadline driving the sale (1031 exchange, divorce, estate, relocation)? That informs how much negotiation room exists.
- Crime grade is F in this area — have there been break-ins, vandalism, or insurance claims at this property in the last 3 years? What carrier currently insures it and at what premium?
- The area grade is low — what's the realistic commute time and amenity access for the typical tenant pool here? Any planned neighborhood developments (good or bad) we should know about?
- What's the average days-on-market for RENTAL listings here right now (not sales)? A rising rental-DOM trend means longer vacancies and softer asking-rent achievability than the comps imply.
- What's the recent tenant-quality profile in this submarket — average credit score on applications, eviction rate, late-payment / NSF rate, and stable-employment percentage? A property-management company in the area should have these aggregated.
- How much new for-sale + rental construction is in the pipeline within 1–3 miles? Heavy new supply typically softens prices + rents 12–24 months out; constrained supply supports both.
Investment metrics
- 1% rule
- 91958.00% ✓
- Cap rate
- 871759.84%
- Cash-on-cash
- 3113405.53%
- DSCR
- 138530.03
- GRM
- 0.0
CMA / ARV
- ARV (on-the-fly)
- $104,636
- Comps found
- 12
Show comp detail 12 sales within ~0.75 mi
| Address | Dist | Beds/Ba | Sqft | Sold | Price | $/sf | Match |
|---|---|---|---|---|---|---|---|
| 1008 S Elizabeth St | 0.11mi | 3/1.0 | 936 (-10%) | 14mo | $149,500 | $160 | 67 |
| 600 S West St | 0.30mi | 2/1.0 (-1) | 1,090 (+5%) | 13mo | $72,500 | $67 | 62 |
| 1017 S Ash St | 0.33mi | 3/2.0 | 1,100 (+6%) | 15mo | $124,900 | $114 | 58 |
| 627 W Cherry St | 0.65mi | 2/1.0 (-1) | 1,142 (+10%) | 1mo | $89,900 | $79 | 47 |
| 728 W Arch St | 0.53mi | 2/1.0 (-1) | 996 (-4%) | 20mo | $132,000 | $133 | 47 |
| 428 W Maple St | 0.54mi | 2/1.0 (-1) | 1,090 (+5%) | 18mo | $110,000 | $101 | 46 |
| 528 S Cedar St | 0.54mi | 2/1.0 (-1) | 1,168 (+13%) | 6mo | $104,900 | $90 | 43 |
| 113 S Clay St | 0.66mi | 2/1.0 (-1) | 924 (-11%) | 9mo | $65,000 | $70 | 39 |
| 110 N Chestnut St | 0.71mi | 2/2.0 (-1) | 1,136 (+10%) | 8mo | $159,500 | $140 | 35 |
| 816 W Sycamore St | 0.47mi | 2/1.0 (-1) | 900 (-13%) | 22mo | $75,000 | $83 | 33 |
| 105 E Sycamore St E | 0.67mi | 2/1.0 (-1) | 928 (-10%) | 20mo | $133,500 | $144 | 29 |
| 707 W Cherry St | 0.65mi | 2/1.0 (-1) | 1,190 (+15%) | 18mo | $62,813 | $53 | 25 |
Match score weights: distance 35% · size 25% · config 20% · recency 20%. Top-matched comps best support the ARV.
Projected returns pro-forma
-3.0% appreciation · 3.0% rent growth · sell at horizon
- IRR
- —
- Equity multiple
- 152783.41×
- Total profit
- $42,779
- Equity at exit
- $0
- IRR
- —
- Equity multiple
- 330249.50×
- Total profit
- $92,470
- Equity at exit
- $0
Cash invested: $0 (down + closing). Projections, not guarantees.
Landlord ↔ Tenant lean methodology
- Overall (STATE)
- 81 Strongly Landlord-Friendly
- State Missouri
- 81 Strongly Landlord-Friendly · R+10
- County
- — inherits STATE
- City
- — inherits STATE
ZIP-level market 64772
- Active inventory
- 104
Monthly cashflow live
- Estimated rent
- $920 medium interval (Pro) →
- Mortgage (P&I)
- −$0
- Tax est. 1.5%
- −$0 /mo · $0/yr
- Insurance
- −$0
- Flood insurance flood zone
- −$56 /mo · $666/yr
- HOA
- −$0
- Vacancy / Maint / Mgmt
- −$193
- Net cashflow
- $671
Break-even live
UW: 25.0% down · 7.5% · 30yr · 1.5% tax · 5.0% vac · 8.0% maint · 8.0% mgmt
Financing live
Cash to close
- Down payment
- $0
- Closing costs
- $0
- Reserves months
- —
- Total cash needed
- —
Loan-product check · same deal, 3 products live
Conventional
25% down · 7.5% · 30yr
- Down + closing
- —
- Monthly P&I
- —
- Monthly cashflow
- —
- DSCR
- —
- Eligible?
- —
Personal DTI + credit; lowest rate.
DSCR
20% down · 8.5% · 30yr
- Down + closing
- —
- Monthly P&I
- —
- Monthly cashflow
- —
- DSCR
- —
- Eligible?
- —
No personal income docs; deal must DSCR.
Hard money
10% down · 12.0% · 12mo
- Down + closing
- —
- Monthly P&I
- —
- Monthly cashflow
- —
- DSCR
- —
- Eligible?
- —
Short-term bridge; refi at stabilization.
Rent comps 4 comps
| Address | Beds | Baths | Sqft | Rent | $/sqft | DOM | Units | Dist |
|---|---|---|---|---|---|---|---|---|
| 926 W Sycamore St Nevada, MO | 3.0 | 1.0 | 1100 | $850 | $0.77 | 44d | 1 | 0.50mi |
| 515 N Tower St Nevada, MO | 3.0 | 1.0 | 1305 | $1,025 | $0.79 | 44d | 1 | 1.10mi |
| 317 E Hickory St Nevada, MO | 3.0 | 1.0 | 1296 | $1,050 | $0.81 | 44d | 1 | 1.15mi |
| 404 E Ashland St Nevada, MO | 2.0 | 1.0 | 1041 | $875 | $0.84 | 44d | 1 | 1.26mi |
Listing history 4 events
-
2026-04-18status Pending
-
2026-03-02$1 Active
-
2010-11-30$74,500 143-char remark
Show marketing remark (143 chars)
Very well kept home with family room in basement. Laundry room & 1 bath in basement also. Hardwood floors under carpets in most upstairs.
-
1991-07-01soldstatus
ⓘ Source: listings_history table (triggers on properties + properties_extension) + one-shot
backfill from property_details.listing_events for pre-trigger history.
Climate risk First Street
- Flood 8/10 Severe FEMA zone X (unshaded) · 99% chance over 30 yrs
- Wildfire 3/10 Moderate
- Heat 5/10 Major 7 d/yr ≥108°F today · 19 d/yr by 30 yrs out
- Wind 2/10 Low 2% chance of damaging wind over 30 yrs
- Air quality 2/10 Low 0 unhealthy d/yr today · 1 by 30 yrs out
Nearby sold comps map
Loading sold comps map…
Walkable amenities ~0.75 mi
Loading nearby amenities…
Taxation est. · year 1
- Rental income
- $11,035
- − Mortgage interest
- −$0
- − Property taxes
- −$0
- − Insurance
- −$667
- − Repairs & maintenance
- −$883
- − Management
- −$883
- − Depreciation
- −$0
- Taxable income
- $8,603
- Est. tax owed @ 24.0%
- −$2,065
- After-tax cash flow
- $5,986/yr
For passive investors: Depreciation is non-cash, so a rental often shows a tax loss while cash-flowing — sheltering income. Rental losses are passive: they offset passive income freely, and up to $25,000/yr can offset ordinary (W-2) income if you actively participate and your MAGI is under $100k (phasing out to $0 by $150k); unused losses carry forward. On sale, claimed depreciation is recaptured at up to 25%, and gains may owe capital-gains tax (a 1031 exchange can defer both). Figures are a year-1 estimate at your 24.0% rate — not tax advice; consult a CPA.
Schools (NCES district)
- District
- Nevada R-V
- NCES district ID
- 2921840
- Math proficiency
- 33% ▼ -1.00%
- Reading proficiency
- 44% ▼ -1.00%
- Median HH income
- $38,804
- Composite
- 32.14/100
- National rank
- #5792
- State rank
- #180 of 324 in MO
Livability — Nevada
- Score
- 59/100
- State rank
- #519
- US rank
- #19644
Category grades
Schools grade is shown separately in the Schools card above.
Census & demographics
- Census place
- Nevada, MO
- Population (ZIP)
- 12,930
Population outlook (Vernon County) Hauer SSP2
- Today (2025)
- 20,169 people
- By 2030
- 19,639 · -2.6%
- By 2040
- 18,551 · -8.0%
- By 2050
- 17,549 · -13.0%
- By 2075
- 15,314 · -24.1%
- By 2100
- 13,132 · -34.9%
Race, ethnicity, and origin ACS 2023
- Neighborhood character
- Predominantly White (92%)
- Race & ethnicity
- White 92% Two or more races 4% Hispanic / Latino 3% Black 1% Asian 1%
- Common ancestry
- Italian 3% Portuguese 2% Romanian 2%
- Foreign-born
- 1%
- Languages at home
- 98% English-only · German/W. Germanic 1%
Political lean MEDSL · Vernon
- 2024 margin
- Solid R (+59.5) · D 19.8% · R 79.3%
- 2008→2024 swing
- -37.5pp toward R · 2008: -22.0pp · 2024: -59.5pp
- All cycles
- 2024: R+59.5 2020: R+57.2 2016: R+56.2 2012: R+37.3 2008: R+22.0
Not yet ingested
- Civics
- —
Market trends
- HPI YoY
- ▼ -84.21%
- Current HPI
- 150.7283
- Rent YoY
- —
- Metro
- —
- State GDP YoY
- ▲ 1.84%
- F500 in state
- 20
Industry mix (Fortune 500 HQ in MO)
| Industry | F500 HQs | Revenue |
|---|---|---|
| Healthcare | 1 | $163B |
|
||
| Insurance | 1 | $21B |
|
||
| Industrial Technology | 1 | $17B |
|
||
| Retail | 1 | $16B |
|
||
| Industrial Distribution | 1 | $10B |
|
||
| Utilities | 1 | $9B |
|
||
Price history
4 events — show timeline
- 2026-04-18 Pending — Heartland MLS as Distributed by MLS Grid
- 2026-03-02 Listed $1 Heartland MLS as Distributed by MLS Grid
- 2010-11-30 Listed $74,500 Heartland MLS as Distributed by MLS Grid
- 1991-07-01 Sold (Public Records) — Public Records
Property tax history
+2.7%/yrLatest (2025): $972 · +13.5% YoY. Source: county tax records.
Cash-flow waterfall
monthlySold comps — $/sqft
last 12 mo · ≤1 miLoading sold comps…