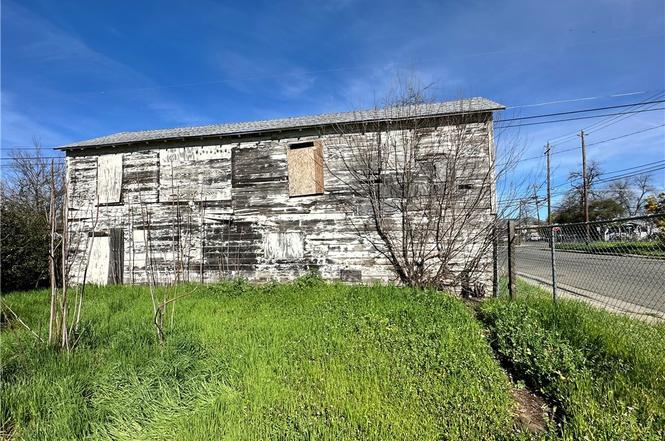
2380 A · Oroville, CA
Flood risk 1/10 · Minimal
- FEMA flood zone
- X (unshaded)
- Chance of flooding over 30 yrs
- 0.0%
- Est. flood insurance / yr
- $507 – $1,088
Fire risk 5/10 · Moderate
- Est. fire insurance / yr
- $659 – $1,223
Heat risk 8/10 · Major
- Hot days now (above 105°F)
- 7 days/yr
- Hot days in 30 yrs
- 16 days/yr
Wind risk 1/10 · Minimal
- Chance of severe wind over 30 yrs
- —
Air-quality risk 10/10 · Severe
- Unhealthy air days now
- 29 days/yr
- Unhealthy air days in 30 yrs
- 36 days/yr
Risk factors via First Street. Map © Google.
Why this score? — see what drove the B- grade
The composite is a weighted blend of 9 inputs, each scored 0–100. Each bar is that input's sub-score; the figure is the points it added to the 100-point composite (weight × sub-score).
- Cash flow +30.0/30.0
- DSCR +10.0/10.0
- 1% rule +8.2/10.0
- ARV discount +7.5/15.0
- Schools +2.8/10.0
- Rent growth +2.5/5.0
- Livability +2.5/5.0
- Condition / age +2.5/5.0
- Appreciation +0.0/10.0
$105,000
🖨 Deal sheet 📄 Offer letter ✓ Due diligence
Listing remarks
Investor Special! The upstairs is a 2-bedroom, 1-bathroom home with 731 sq ft of living space, situated on a spacious corner lot with an attached garage. The downstairs is a true blank canvas ready for your vision. Ideal for investors, flippers, or buyers looking to build equity. Great potential to renovate, update, and add value. The home recently had a new roof installed.
Key facts
- 4,792 sq ft lot
- Garage
- Built 1946
Property features AI
Finance
- Other: Total units: 1; No common walls; Parcel number available
Exterior
- Parking: Attached garage (1 car); Total parking spaces: 1
- Utilities: Public sewer; District/public water
- Home design: House; Two stories; No accessory dwelling unit
- Construction: Composition roof; Property listed as fixer; Year built: source listed as other
- Exterior features: Front yard; Chain link fencing; No pool; Has a view; Street lighting in the neighborhood; Corner location: Roseben and A Street
Interior
- Bedrooms: Bedrooms: see remarks
- Bathrooms: One full bathroom
- Interior features: Two-level interior; Entry on first level; No main-level bedrooms; No main-level bathrooms; Room details: see remarks
- Laundry & utility: Laundry on-site (see remarks)
Neighborhood map
What this means for you Summary
Snapshot
- This is a 2-bed/1.0-bath other listed at $105k.
Deal economics
- At list price, monthly cash flow is $442 ($5k/yr) — positive.
- The deal already cash-flows at list — no discount required.
- Meets the 1% rule at list price ($1k rent vs $105k).
- Recommended offer: $96k (9.0% below list) — sets the bar for market timing.
- Cap rate 11.3% vs local median 4.6% in Oroville — top-decile yield for the area; either an underpriced asset or a hidden risk that comps aren't pricing in. Stress-test before assuming the spread holds.
Location & tenants
- Location reads 50/100 on livability (#1,136 in CA) — a working-class tenant base; expect higher turnover. Watch: schools D, cost of living D, crime F.
- Oroville Union High (town): math 19% / reading 49% proficiency, ranked #300 of 517 in CA (top 58%) — families likely to look elsewhere, expect single-tenant / working-renter base with shorter leases.
- Market conditions: 372 active listings in the ZIP; 12 comparable units currently listed for rent nearby; rentals leasing fast (median 13d on market — plan ~1-2 weeks tenant-placement turnaround); 946 units permitted in Butte County in 2024 (254 in 5+ unit buildings).
Forward outlook
- Local home prices are declining (-3.0%/yr); year-one equity from $726 of loan paydown is wiped out by about $3k of value loss. Plan a longer hold.
- Butte County population projected at +10% by 2050 — modest demand growth; plan on rents tracking national, not racing it.
- At projected returns (-3.0% appreciation + 3.0% rent growth), your $29k cash investment doubles in ~7 years — after that, you're playing with house money.
Negotiation context
- It's been on market 112 days — a 9% lower offer ($96k) is reasonable based on typical stale-listing flexibility.
- Current owner paid $60k; list at $105k implies a 75% gain — meaningful room to come down on a strong offer.
Risks & watch-outs
- Watch-outs: built in 1946 — expect roof / HVAC / electrical / plumbing capex.
- Climate carrying-cost: moderate wildfire risk; extreme-heat days projected 7→16/yr by 2055 (HVAC capex compounding) — expect insurance premiums to compound above CPI over the hold.
Questions for the listing agent
- It's been on market 112 days. Have you received any prior offers? Is the seller open to a 9% concession, seller financing, or rate buy-down credit?
- Built in 1946 — when were the roof, HVAC, electrical panel, plumbing, and water heater last replaced?
- Why hasn't it sold? Are there any deal-killer items the seller is aware of (foundation, flood, title, zoning, code violations)?
- Is there a deadline driving the sale (1031 exchange, divorce, estate, relocation)? That informs how much negotiation room exists.
- Schools are D-rated, which usually means shorter tenancies and higher turnover. Who's the typical renter profile here, and what's been the actual vacancy rate?
- Crime grade is F in this area — have there been break-ins, vandalism, or insurance claims at this property in the last 3 years? What carrier currently insures it and at what premium?
- What's the average days-on-market for RENTAL listings here right now (not sales)? A rising rental-DOM trend means longer vacancies and softer asking-rent achievability than the comps imply.
- What's the recent tenant-quality profile in this submarket — average credit score on applications, eviction rate, late-payment / NSF rate, and stable-employment percentage? A property-management company in the area should have these aggregated.
- How much new for-sale + rental construction is in the pipeline within 1–3 miles? Heavy new supply typically softens prices + rents 12–24 months out; constrained supply supports both.
Investment metrics
- 1% rule
- 1.32% ✓
- Cap rate
- 11.34%
- Cash-on-cash
- 18.03%
- DSCR
- 1.80
- GRM
- 6.3
CMA / ARV
No comps found within radius.
Projected returns pro-forma
-3.0% appreciation · 3.0% rent growth · sell at horizon
- IRR
- 9.6%
- Equity multiple
- 1.38×
- Total profit
- $11,101
- Equity at exit
- $15,656
- IRR
- 18.7%
- Equity multiple
- 2.56×
- Total profit
- $45,798
- Equity at exit
- $9,078
Cash invested: $29,400 (down + closing). Projections, not guarantees.
Landlord ↔ Tenant lean methodology
- Overall (STATE)
- 18 Strongly Tenant-Friendly
- State California
- 18 Strongly Tenant-Friendly · D+13
- County
- — inherits STATE
- City
- — inherits STATE
ZIP-level market 95966
- Active inventory
- 372
- Price-to-rent
- 6.3×
Monthly cashflow live
- Estimated rent
- $1,381 high interval (Pro) →
- Mortgage (P&I)
- −$551
- Tax from tax record
- −$55 /mo · $660/yr
- Insurance
- −$44
- HOA
- −$0
- Vacancy / Maint / Mgmt
- −$290
- Net cashflow
- $442
Break-even live
UW: 25.0% down · 7.5% · 30yr · 1.5% tax · 5.0% vac · 8.0% maint · 8.0% mgmt
Financing live
Cash to close
- Down payment
- $26,250
- Closing costs
- $3,150
- Reserves months
- —
- Total cash needed
- —
Loan-product check · same deal, 3 products live
Conventional
25% down · 7.5% · 30yr
- Down + closing
- —
- Monthly P&I
- —
- Monthly cashflow
- —
- DSCR
- —
- Eligible?
- —
Personal DTI + credit; lowest rate.
DSCR
20% down · 8.5% · 30yr
- Down + closing
- —
- Monthly P&I
- —
- Monthly cashflow
- —
- DSCR
- —
- Eligible?
- —
No personal income docs; deal must DSCR.
Hard money
10% down · 12.0% · 12mo
- Down + closing
- —
- Monthly P&I
- —
- Monthly cashflow
- —
- DSCR
- —
- Eligible?
- —
Short-term bridge; refi at stabilization.
Rent comps 12 comps
| Address | Beds | Baths | Sqft | Rent | $/sqft | DOM | Units | Dist |
|---|---|---|---|---|---|---|---|---|
| 2737 Gilmore Ln Unit 1 Oroville, CA | 2.0 | 1.0 | 720 | $1,595 | $2.22 | 13d | 1 | 0.58mi |
| 2739 Gilmore Ln Unit 4 Oroville, CA | 2.0 | 1.0 | 720 | $1,595 | $2.22 | 13d | 1 | 0.59mi |
| 2741 Gilmore Ln Unit 3 Oroville, CA | 2.0 | 1.0 | 689 | $1,595 | $2.31 | 21d | 1 | 0.60mi |
| 4566 Virginia Ave Unit 4574 Oroville, CA | 2.0 | 1.0 | 549 | $1,095 | $1.99 | 13d | 1 | 0.88mi |
| 1331 Pomona Ave Unit 4 Oroville, CA | 2.0 | 1.0 | 673 | $1,075 | $1.60 | 13d | 1 | 0.94mi |
| 1558 Bridge St Oroville, CA | 2.0 | 1.0 | 661 | $1,172 | $1.77 | 13d | 1 | 0.97mi |
| 2804 Orange Ave Unit 11 Oroville, CA | 1.0 | 1.0 | 526 | $1,095 | $2.08 | 13d | 1 | 1.08mi |
| 1469 6th Ave Oroville, CA | 1.0 | 1.0 | 602 | $995 | $1.65 | 13d | 1 | 1.26mi |
| 1138 Elma St Apt 4 Oroville, CA | 1.0 | 1.0 | 500 | $975 | $1.95 | 13d | 1 | 1.27mi |
| 501 Pomona Ave Unit 501_5 Oroville, CA | 2.0 | 1.0 | 676 | $1,125 | $1.66 | 13d | 1 | 1.30mi |
| 11 Hemstalk Ct Oroville, CA | 2.0 | 1.0 | 650 | $1,100 | $1.69 | 13d | 1 | 1.34mi |
| 650 Bird St Unit 4 Oroville, CA | 1.0 | 1.0 | 510 | $1,150 | $2.25 | 13d | 1 | 1.37mi |
Listing history 21 events
-
2026-06-19days on market $105,000 Active 112 DOM
-
2026-06-18days on market $105,000 Active 111 DOM
-
2026-06-17days on market $105,000 Active 110 DOM
-
2026-06-16days on market $105,000 Active 109 DOM
-
2026-06-15days on market $105,000 Active 108 DOM
-
2026-06-14days on market $105,000 Active 106 DOM
-
2026-06-13days on market $105,000 Active 105 DOM
-
2026-06-10days on market $105,000 Active 103 DOM
-
2026-06-09days on market $105,000 Active 102 DOM
-
2026-06-08days on market $105,000 Active 101 DOM
-
2026-06-07days on market $105,000 Active 100 DOM
-
2026-06-03days on market $105,000 Active 96 DOM
-
2026-06-02days on market $105,000 Active 95 DOM
-
2026-06-01days on market $105,000 Active 94 DOM
-
2026-05-31days on market $105,000 Active 93 DOM
-
2026-05-30days on market $105,000 Active 92 DOM
-
2026-04-22price $105,000
-
2026-02-27$120,000 Active
-
2024-07-12soldstatus $60,000
-
2004-09-15soldstatus $30,500
-
1993-03-02soldstatus $46,000
ⓘ Source: listings_history table (triggers on properties + properties_extension) + one-shot
backfill from property_details.listing_events for pre-trigger history.
Tax reassessment forecast CA · Resets to sale price
- Current annual tax
- $660 · $55/mo
- Projected year-2 tax
- $798 · $66/mo
- Expected delta
- +$138/yr (+$11/mo · 20.8%)
ⓘ Screening estimate from a state-policy table — verify with the county assessor before closing.
Climate risk First Street
- Flood 1/10 Low FEMA zone X (unshaded) · 0% chance over 30 yrs
- Wildfire 5/10 Major
- Heat 8/10 Severe 7 d/yr ≥105°F today · 16 d/yr by 30 yrs out
- Wind 1/10 Low
- Air quality 10/10 Extreme 29 unhealthy d/yr today · 36 by 30 yrs out
Nearby sold comps map
Loading sold comps map…
Walkable amenities ~0.75 mi
Loading nearby amenities…
Taxation est. · year 1
- Rental income
- $16,576
- − Mortgage interest
- −$5,882
- − Property taxes
- −$660
- − Insurance
- −$525
- − Repairs & maintenance
- −$1,326
- − Management
- −$1,326
- − Depreciation
- −$3,055
- Taxable income
- $3,802
- Est. tax owed @ 24.0%
- −$913
- After-tax cash flow
- $4,390/yr
For passive investors: Depreciation is non-cash, so a rental often shows a tax loss while cash-flowing — sheltering income. Rental losses are passive: they offset passive income freely, and up to $25,000/yr can offset ordinary (W-2) income if you actively participate and your MAGI is under $100k (phasing out to $0 by $150k); unused losses carry forward. On sale, claimed depreciation is recaptured at up to 25%, and gains may owe capital-gains tax (a 1031 exchange can defer both). Figures are a year-1 estimate at your 24.0% rate — not tax advice; consult a CPA.
Schools (NCES district)
- District
- Oroville Union High
- NCES district ID
- 0629130
- Math proficiency
- 19% ▼ -2.00%
- Reading proficiency
- 49% ▼ -4.00%
- Median HH income
- $38,085
- Composite
- 28.26/100
- National rank
- #6794
- State rank
- #300 of 517 in CA
Livability — Oroville
- Score
- 50/100
- State rank
- #1136
- US rank
- #25715
Category grades
Schools grade is shown separately in the Schools card above.
Census & demographics
- Census place
- Oroville, CA
- County
- Butte County · 175,030 people
- City population
- 49,684
- Metro
- Chico, CA
- Population (ZIP)
- 28,503
- Household income
- $65,586
- Rent vs Own
- Severe rent burden
- 807.0
Population outlook (Butte County) Hauer SSP2
- Today (2025)
- 237,527 people
- By 2030
- 243,804 · +2.6%
- By 2040
- 253,899 · +6.9%
- By 2050
- 262,561 · +10.5%
- By 2075
- 283,709 · +19.4%
- By 2100
- 282,689 · +19.0%
Race, ethnicity, and origin ACS 2023
- Neighborhood character
- Predominantly White (67%)
- Race & ethnicity
- White 67% Hispanic / Latino 18% Two or more races 14% Asian 6% Native American 2% Black 2%
- Hispanic origin (detail)
- Mexican 16%
- Common ancestry
- Lithuanian 3% Slovak 3% Portuguese 2%
- Foreign-born
- 6% · Canada
- Languages at home
- 88% English-only · Spanish 7% Other Asian/Pacific 3% Russian/Polish/Slavic 1%
Political lean MEDSL · Butte
- 2024 margin
- Toss-up / Even · D 46.8% · R 49.9% · Other 3.3%
- 2008→2024 swing
- -5.5pp toward R · 2008: 2.4pp · 2024: -3.1pp
- All cycles
- 2024: R+3.1 2020: D+1.7 2016: R+4.0 2012: R+3.9 2008: D+2.4
Not yet ingested
- Civics
- —
Market trends
- HPI YoY
- ▼ -284.58%
- Current HPI
- 267.1415
- Rent YoY
- —
- Metro
- Chico, CA
- State GDP YoY
- ▲ 3.21%
- F500 in state
- 116
Industry mix (Fortune 500 HQ in CA)
| Industry | F500 HQs | Revenue |
|---|---|---|
| Technology | 27 | $1,492B |
|
||
| Financial Services | 3 | $174B |
|
||
| Retail | 3 | $44B |
|
||
| Insurance | 3 | $26B |
|
||
| Media / Entertainment | 2 | $115B |
|
||
| Pharmaceuticals / Biotech | 2 | $62B |
|
||
Price history
+128.3% since first listed5 events — show timeline
- 2026-04-22 Price Changed $105,000 CRMLS
- 2026-02-27 Listed $120,000 CRMLS
- 2024-07-12 Sold (Public Records) $60,000 Public Records
- 2004-09-15 Sold (Public Records) $30,500 Public Records
- 1993-03-02 Sold (Public Records) $46,000 Public Records
Property tax history
-0.4%/yrLatest (2025): $660 · +6.5% YoY. Source: county tax records.
Cash-flow waterfall
monthlySold comps — $/sqft
last 12 mo · ≤1 miLoading sold comps…