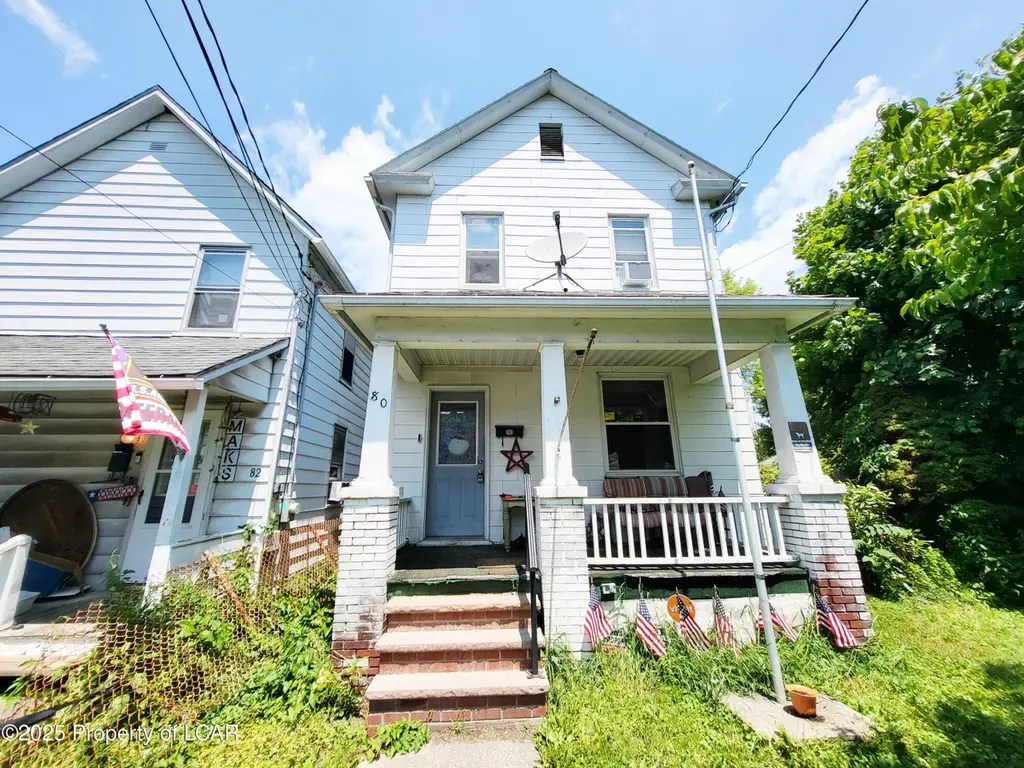
80 Coal St · Newport, PA
Flood risk 1/10 · Minimal
- FEMA flood zone
- X (unshaded)
- Chance of flooding over 30 yrs
- 0.0%
- Est. flood insurance / yr
- $507 – $1,088
Fire risk 3/10 · Minor
- Est. fire insurance / yr
- $511 – $949
Heat risk 4/10 · Minor
- Hot days now (above 94°F)
- 7 days/yr
- Hot days in 30 yrs
- 17 days/yr
Wind risk 3/10 · Minor
- Chance of severe wind over 30 yrs
- 4.0%
Air-quality risk 2/10 · Minimal
- Unhealthy air days now
- 1 days/yr
- Unhealthy air days in 30 yrs
- 2 days/yr
Risk factors via First Street. Map © Google.
Why this score? — see what drove the B+ grade
The composite is a weighted blend of 9 inputs, each scored 0–100. Each bar is that input's sub-score; the figure is the points it added to the 100-point composite (weight × sub-score).
- Cash flow +29.2/30.0
- ARV discount +12.5/15.0
- DSCR +10.0/10.0
- 1% rule +8.5/10.0
- Appreciation +7.8/10.0
- Livability +3.6/5.0
- Rent growth +2.5/5.0
- Condition / age +2.5/5.0
- Schools +2.0/10.0
$85,000
🖨 Deal sheet 📄 Offer letter ✓ Due diligence
Listing remarks
Highly Motivated Seller! Don't miss this single-family home featuring three bedrooms and 1.5 bathrooms. Enjoy a spacious yard, off-street parking, and a large front foyer. The home also offers a welcoming living room, a functional kitchen, and first-floor laundry for convenience. Cash and conventional financing only.
Key facts
- Spacious yard
- Functional kitchen
- Large front foyer
Tags
Property features AI
Finance
- HOA & community: Homeowners association with annual fee
Exterior
- Utilities: Public water; Public sewer
- Home design: Single-family residential; Two levels
- Exterior features: Front porch; Shed(s); Cleared lot
Interior
- Kitchen: Electric water heater
- Bathrooms: 1 full bathroom; 1 half bathroom
- Heating & cooling: Electric heating; Baseboard heating
- Interior features: Eat-in kitchen; 8 total rooms
Neighborhood map
What this means for you Summary
Snapshot
- This is a 3-bed/1.5-bath single-family listed at $85k.
Deal economics
- At list price, monthly cash flow is $295 ($4k/yr) — positive.
- The deal already cash-flows at list — no discount required.
- Meets the 1% rule at list price ($1k rent vs $85k).
- Recommended offer: $84k (1.5% below list) — sets the bar for market timing.
Location & tenants
- Location reads 72/100 on livability (#609 in PA) — a middle-class / working-renter tenant base. Strengths: crime A+, cost of living A+, housing A+; Watch: amenities F, commute F.
- Greater Nanticoke Area SD (suburban): math 14% / reading 34% proficiency, ranked #479 of 539 in PA (top 89%) — low school quality limits family demand, transient renter base, plan for 1-2y turnover.
- Market conditions: 20 active listings in the ZIP; 5 comparable units currently listed for rent nearby; rentals leasing fast (median 14d on market — plan ~1-2 weeks tenant-placement turnaround); 40% of comp listings sitting > 30 days — soft ceiling on asking rent; 349 units permitted in Luzerne County in 2024 (16 in 5+ unit buildings).
Forward outlook
- In year one you build about $5k of equity ($588 loan paydown + $5k appreciation (5.6% local appreciation)).
- Luzerne County population projected at +4% by 2050 — modest demand growth; plan on rents tracking national, not racing it.
- At projected returns (5.6% appreciation + 3.0% rent growth), your $24k cash investment doubles in ~3 years — after that, you're playing with house money.
- By year 7, paydown + projected appreciation supports a ~$35k cash-out refi (75% LTV) — recoverable capital for the next deal without selling this one.
Negotiation context
- It's been on market 24 days — a 2% lower offer ($84k) is reasonable based on typical stale-listing flexibility.
- 6 sale attempts since 5y ago; this cycle's ask has dropped $5k (5%) from the opening price — seller is motivated, your offer sets the floor, not the list.
- Current owner paid $68k; 26% above their basis — modest negotiation headroom, anchor on the comps not their cost.
Risks & watch-outs
- Watch-outs: built in 1950 — expect roof / HVAC / electrical / plumbing capex.
Questions for the listing agent
- Built in 1950 — when were the roof, HVAC, electrical panel, plumbing, and water heater last replaced?
- Is there a deadline driving the sale (1031 exchange, divorce, estate, relocation)? That informs how much negotiation room exists.
- What's the average days-on-market for RENTAL listings here right now (not sales)? A rising rental-DOM trend means longer vacancies and softer asking-rent achievability than the comps imply.
- What's the recent tenant-quality profile in this submarket — average credit score on applications, eviction rate, late-payment / NSF rate, and stable-employment percentage? A property-management company in the area should have these aggregated.
- How much new for-sale + rental construction is in the pipeline within 1–3 miles? Heavy new supply typically softens prices + rents 12–24 months out; constrained supply supports both.
Investment metrics
- 1% rule
- 1.35% ✓
- Cap rate
- 10.46%
- Cash-on-cash
- 14.87%
- DSCR
- 1.66
- GRM
- 6.2
CMA / ARV
- ARV (median comp)
- $95,548
- List price
- $85,000
- Delta
- -5.91%
- Verdict
- FAIR
- Comps
- 20 within 1.0 mi
Show comp detail 8 sales within ~0.75 mi
| Address | Dist | Beds/Ba | Sqft | Sold | Price | $/sf | Match |
|---|---|---|---|---|---|---|---|
| 46 Arch St | 0.21mi | 3/2.0 | 1,344 (-3%) | 0mo | $160,000 | $119 | 83 |
| 30 Coal St | 0.13mi | 4/1.0 (+1) | 1,288 (-7%) | 2mo | $170,000 | $132 | 74 |
| 93 Coal St | 0.06mi | 2/1.5 (-1) | 1,208 (-13%) | 5mo | $85,000 | $70 | 67 |
| 135 Main St | 0.51mi | 3/1.5 | 1,420 (+2%) | 7mo | $167,000 | $118 | 66 |
| 39 Orchard St | 0.44mi | 2/1.0 (-1) | 1,300 (-6%) | 17mo | $115,000 | $88 | 48 |
| 28 Orchard St | 0.42mi | 3/1.0 | 1,240 (-10%) | 23mo | $105,000 | $85 | 42 |
| 113 Newport St | 0.56mi | 3/1.0 | 1,232 (-11%) | 18mo | $140,000 | $114 | 38 |
| 160 Main St | 0.58mi | 3/1.0 | 1,560 (+13%) | 22mo | $125,000 | $80 | 32 |
Match score weights: distance 35% · size 25% · config 20% · recency 20%. Top-matched comps best support the ARV.
Projected returns pro-forma
5.58% appreciation · 3.0% rent growth · sell at horizon
- IRR
- 26.9%
- Equity multiple
- 2.73×
- Total profit
- $41,256
- Equity at exit
- $51,193
- IRR
- 25.5%
- Equity multiple
- 5.51×
- Total profit
- $107,319
- Equity at exit
- $90,960
Cash invested: $23,800 (down + closing). Projections, not guarantees.
Landlord ↔ Tenant lean methodology
- Overall (STATE)
- 62 Landlord-Friendly
- State Pennsylvania
- 62 Landlord-Friendly · EVEN
- County
- — inherits STATE
- City
- — inherits STATE
ZIP-level market 18617
- Home prices YoY
- 2.0%
- Active inventory
- 20
- Price-to-rent
- 6.2×
Monthly cashflow live
- Estimated rent
- $1,150 high interval (Pro) →
- Mortgage (P&I)
- −$446
- Tax from tax record
- −$132 /mo · $1,584/yr
- Insurance
- −$35
- HOA
- −$0
- Vacancy / Maint / Mgmt
- −$241
- Net cashflow
- $295
Break-even live
UW: 25.0% down · 7.5% · 30yr · 1.5% tax · 5.0% vac · 8.0% maint · 8.0% mgmt
Financing live
Cash to close
- Down payment
- $21,250
- Closing costs
- $2,550
- Reserves months
- —
- Total cash needed
- —
Loan-product check · same deal, 3 products live
Conventional
25% down · 7.5% · 30yr
- Down + closing
- —
- Monthly P&I
- —
- Monthly cashflow
- —
- DSCR
- —
- Eligible?
- —
Personal DTI + credit; lowest rate.
DSCR
20% down · 8.5% · 30yr
- Down + closing
- —
- Monthly P&I
- —
- Monthly cashflow
- —
- DSCR
- —
- Eligible?
- —
No personal income docs; deal must DSCR.
Hard money
10% down · 12.0% · 12mo
- Down + closing
- —
- Monthly P&I
- —
- Monthly cashflow
- —
- DSCR
- —
- Eligible?
- —
Short-term bridge; refi at stabilization.
Rent comps 5 comps
| Address | Beds | Baths | Sqft | Rent | $/sqft | DOM | Units | Dist |
|---|---|---|---|---|---|---|---|---|
| 5 E Main St Glen Lyon, PA | 3.0 | 1.0 | 1217 | $900 | $0.74 | 43d | 1 | 0.04mi |
| 8 Arch St Glen Lyon, PA | 3.0 | 1.0 | 1000 | $1,399 | $1.40 | 13d | 1 | 0.18mi |
| 34 Arch St Glen Lyon, PA | 3.0 | 2.0 | 1600 | $1,250 | $0.78 | 13d | 1 | 0.18mi |
| 34 Arch St Unit 1 Glen Lyon, PA | 3.0 | 2.0 | 1600 | $1,250 | $0.78 | 43d | 1 | 0.18mi |
| 212 W Main St Glen Lyon, PA | 3.0 | 1.0 | 1000 | $1,350 | $1.35 | 13d | 1 | 0.64mi |
Listing history 26 events
-
2026-06-18days on market $85,000 Active 24 DOM
-
2026-06-17pricedays on market $85,000 Active 23 DOM
-
2026-06-16days on market $89,900 Active 22 DOM
-
2026-06-15days on market $89,900 Active 21 DOM
-
2026-06-14days on market $89,900 Active 19 DOM
-
2026-06-13days on market $89,900 Active 18 DOM
-
2026-06-10days on market $89,900 Active 16 DOM
-
2026-06-09days on market $89,900 Active 15 DOM
-
2026-06-08days on market $89,900 Active 14 DOM
-
2026-06-07days on market $89,900 Active 13 DOM
-
2026-06-05days on market $89,900 Active 10 DOM
-
2026-06-02days on market $89,900 Active 8 DOM
-
2026-06-01days on market $89,900 Active 7 DOM
-
2026-05-31days on market $89,900 Active 6 DOM
-
2026-05-30days on market $89,900 Active 5 DOM
-
2026-05-17status Pending 378-char remark
-
2026-05-13$89,900 Active 378-char remark
-
2025-07-20price $105,000
-
2022-02-16soldstatus $67,500
-
2022-02-10soldstatus $67,000
-
2022-02-10soldstatus $67,000
-
2021-12-10$82,000
-
2021-12-10$82,000
-
2021-12-08$82,000
-
2021-12-08historical
-
2021-12-08$82,000
ⓘ Source: listings_history table (triggers on properties + properties_extension) + one-shot
backfill from property_details.listing_events for pre-trigger history.
Tax reassessment forecast PA · Partial reset (capped growth)
- Current annual tax
- $1,584 · $132/mo
- Projected year-2 tax
- $1,584 · $132/mo
- Expected delta
- $0/yr ($0/mo · 0.0%)
ⓘ Screening estimate from a state-policy table — verify with the county assessor before closing.
Climate risk First Street
- Flood 1/10 Low FEMA zone X (unshaded) · 0% chance over 30 yrs
- Wildfire 3/10 Moderate
- Heat 4/10 Moderate 7 d/yr ≥94°F today · 17 d/yr by 30 yrs out
- Wind 3/10 Moderate 4% chance of damaging wind over 30 yrs
- Air quality 2/10 Low 1 unhealthy d/yr today · 2 by 30 yrs out
Nearby sold comps map
Loading sold comps map…
Walkable amenities ~0.75 mi
Loading nearby amenities…
Taxation est. · year 1
- Rental income
- $13,795
- − Mortgage interest
- −$4,761
- − Property taxes
- −$1,584
- − Insurance
- −$425
- − Repairs & maintenance
- −$1,104
- − Management
- −$1,104
- − Depreciation
- −$2,473
- Taxable income
- $2,345
- Est. tax owed @ 24.0%
- −$563
- After-tax cash flow
- $2,977/yr
For passive investors: Depreciation is non-cash, so a rental often shows a tax loss while cash-flowing — sheltering income. Rental losses are passive: they offset passive income freely, and up to $25,000/yr can offset ordinary (W-2) income if you actively participate and your MAGI is under $100k (phasing out to $0 by $150k); unused losses carry forward. On sale, claimed depreciation is recaptured at up to 25%, and gains may owe capital-gains tax (a 1031 exchange can defer both). Figures are a year-1 estimate at your 24.0% rate — not tax advice; consult a CPA.
Schools (NCES district)
- District
- Greater Nanticoke Area SD
- NCES district ID
- 4216290
- Math proficiency
- 14% ▼ -8.00%
- Reading proficiency
- 34% ▼ -14.00%
- Median HH income
- $38,990
- Composite
- 20.1/100
- National rank
- #8647
- State rank
- #479 of 539 in PA
Livability — Newport
- Score
- 72/100
- State rank
- #609
- US rank
- #5859
Category grades
Schools grade is shown separately in the Schools card above.
Census & demographics
- Census place
- Glen Lyon, PA
- Population (ZIP)
- 1,616
Population outlook (Luzerne County) Hauer SSP2
- Today (2025)
- 319,505 people
- By 2030
- 319,943 · +0.1%
- By 2040
- 322,643 · +1.0%
- By 2050
- 330,817 · +3.5%
- By 2075
- 379,145 · +18.7%
- By 2100
- 431,908 · +35.2%
Race, ethnicity, and origin ACS 2023
- Neighborhood character
- Predominantly White (81%)
- Race & ethnicity
- White 81% Two or more races 10% Black 6% Asian 3% Hispanic / Latino 1%
- Common ancestry
- Romanian 45% Scotch-Irish 6% Iranian 1%
- Foreign-born
- 1% · Canada
- Languages at home
- 98% English-only · Other Indo-European 1% Spanish 1%
Political lean MEDSL · Luzerne
- 2024 margin
- R (+19.2) · D 40.0% · R 59.2%
- 2008→2024 swing
- -27.6pp toward R · 2008: 8.4pp · 2024: -19.2pp
- All cycles
- 2024: R+19.2 2020: R+14.4 2016: R+19.6 2012: D+4.8 2008: D+8.4
Not yet ingested
- Civics
- —
Market trends
- HPI YoY
- ▲ 5.58%
- Current HPI
- 278.0674
- Rent YoY
- —
- Metro
- —
- State GDP YoY
- ▲ 1.68%
- F500 in state
- 34
Industry mix (Fortune 500 HQ in PA)
| Industry | F500 HQs | Revenue |
|---|---|---|
| Healthcare | 2 | $309B |
|
||
| Insurance | 2 | $27B |
|
||
| Telecommunications / Media | 1 | $124B |
|
||
| Industrial Distribution | 1 | $22B |
|
||
| Financial Services | 1 | $20B |
|
||
| Chemicals / Materials | 1 | $18B |
|
||
Price history
+3.7% since first listed13 events — show timeline
- 2026-06-16 Price Changed $85,000 LCAR
- 2026-05-29 Relisted — LCAR
- 2026-05-17 Pending — LCAR
- 2026-05-13 Listed $89,900 LCAR
- 2025-07-20 Price Changed $105,000 LCAR
- 2022-02-16 Sold (Public Records) $67,500 Public Records
- 2022-02-10 Sold (MLS) $67,000 PMAR
- 2022-02-10 Sold (MLS) $67,000 BRIGHT MLS
- 2021-12-10 Listed $82,000 PMAR
- 2021-12-10 Listed $82,000 BRIGHT MLS
- 2021-12-08 Listing Removed — BRIGHT MLS
- 2021-12-08 Listed $82,000 BRIGHT MLS
- 2021-12-08 Listed $82,000 PMAR
Property tax history
+3.1%/yrLatest (2026): $1,584 · +9.9% YoY. Source: county tax records.
Cash-flow waterfall
monthlySold comps — $/sqft
last 12 mo · ≤1 miLoading sold comps…