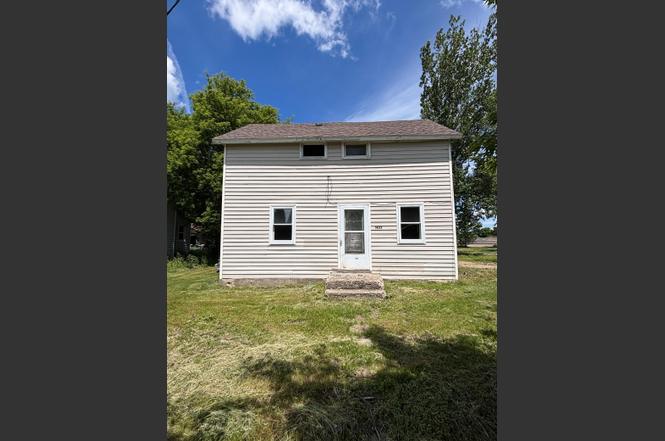
1433 1st Ave NE · Glenwood, MN
Flood risk 1/10 · Minimal
- FEMA flood zone
- —
- Chance of flooding over 30 yrs
- 0.0%
- Est. flood insurance / yr
- —
Fire risk 1/10 · Minimal
- Est. fire insurance / yr
- $888 – $1,650
Heat risk 2/10 · Minimal
- Hot days now (above 97°F)
- 7 days/yr
- Hot days in 30 yrs
- 13 days/yr
Wind risk 2/10 · Minimal
- Chance of severe wind over 30 yrs
- —
Air-quality risk 3/10 · Minor
- Unhealthy air days now
- 3 days/yr
- Unhealthy air days in 30 yrs
- 3 days/yr
Risk factors via First Street. Map © Google.
Why this score? — see what drove the B grade
The composite is a weighted blend of 9 inputs, each scored 0–100. Each bar is that input's sub-score; the figure is the points it added to the 100-point composite (weight × sub-score).
- Cash flow +30.0/30.0
- 1% rule +10.0/10.0
- DSCR +10.0/10.0
- ARV discount +7.5/15.0
- Schools +4.5/10.0
- Appreciation +3.5/10.0
- Livability +3.5/5.0
- Rent growth +2.5/5.0
- Condition / age +2.5/5.0
$99,000
🖨 Deal sheet 📄 Offer letter ✓ Due diligence
Listing remarks
Investment Opportunity with Dual Living Spaces! Unlock the potential of this unique property featuring two separate living spaces on one parcel. The main home offers 3 bedrooms and 1 bathroom, providing comfortable living space for a family or tenant. The second unit features 1 bedroom, 1 bathroom, and a large attached garage, making it ideal as a guest house, rental unit, home business space, or private living quarters. Whether you're looking for an income-producing property, a multi-generational living arrangement, or the opportunity to live in one unit while renting out the other, this property offers flexibility to fit a variety of needs. While the property will benefit from some updat
Key facts
- Dual living spaces
- 7,492 sq ft lot
- Garage
Tags
Property features AI
Exterior
- Parking: Attached garage (1 stall); Garage dimensions 22 x 40; Garage door 8' wide x 7' high
- Utilities: City water connected; City sewer connected; Natural gas
- Home design: Residential property; One and one half levels; Above-grade finished area 1,044 sq ft; Below-grade area 720 sq ft; Total building area 1,764 sq ft
- Construction: Built on block foundation; Foundation dimensions 30 x 24
- Exterior features: Vinyl exterior; Lot approximately 0.172 acres (dimensions: 50 x 150 x 50 x 150)
Interior
- Bedrooms: 4 bedrooms
- Bathrooms: 1 full bath; 1 three-quarter bath
- Heating & cooling: Boiler heating; Forced air heating; No central air
- Interior features: Unfinished basement; Block foundation
Neighborhood map
What this means for you Summary
Snapshot
- This is a 3-bed/1.0-bath single-family listed at $99k.
Deal economics
- At list price, monthly cash flow is $770 ($9k/yr) — positive.
- The deal already cash-flows at list — no discount required.
- Meets the 1% rule at list price ($2k rent vs $99k).
- Cap rate 15.6% vs local median 4.6% in Glenwood — top-decile yield for the area; either an underpriced asset or a hidden risk that comps aren't pricing in. Stress-test before assuming the spread holds.
Location & tenants
- Location reads 70/100 on livability (#336 in MN) — a middle-class / working-renter tenant base. Strengths: crime A+, cost of living A+, housing A+; Watch: employment C-, health & safety D+, amenities F.
- Minnewaska School District (rural): math 55% / reading 51% proficiency, ranked #87 of 301 in MN (top 29%) — acceptable for families but not a draw, mixed tenant base, ~2y average lease.
- Market conditions: 54 active listings in the ZIP; 41 units permitted in Pope County in 2024 (0 in 5+ unit buildings).
Forward outlook
- Local home prices are declining (-2.9%/yr); year-one equity from $684 of loan paydown is wiped out by about $3k of value loss. Plan a longer hold.
- Pope County population projected to shrink 10% by 2050 — rents likely to lag national; underwrite the cash flow, not the appreciation.
- At projected returns (-2.9% appreciation + 3.0% rent growth), your $28k cash investment doubles in ~4 years — after that, you're playing with house money.
Negotiation context
- Only 2 days on market — expect competitive offers; lowballing is unlikely to land.
Risks & watch-outs
- Watch-outs: built in 1896 — expect roof / HVAC / electrical / plumbing capex.
Questions for the listing agent
- Built in 1896 — when were the roof, HVAC, electrical panel, plumbing, and water heater last replaced?
- Is there a deadline driving the sale (1031 exchange, divorce, estate, relocation)? That informs how much negotiation room exists.
- Schools are B-rated — typically a magnet for longer-tenancy family renters. What's the average tenant stay here, and is there a school-zone premium baked into asking?
- What's the average days-on-market for RENTAL listings here right now (not sales)? A rising rental-DOM trend means longer vacancies and softer asking-rent achievability than the comps imply.
- What's the recent tenant-quality profile in this submarket — average credit score on applications, eviction rate, late-payment / NSF rate, and stable-employment percentage? A property-management company in the area should have these aggregated.
- How much new for-sale + rental construction is in the pipeline within 1–3 miles? Heavy new supply typically softens prices + rents 12–24 months out; constrained supply supports both.
Investment metrics
- 1% rule
- 1.83% ✓
- Cap rate
- 15.63%
- Cash-on-cash
- 33.34%
- DSCR
- 2.48
- GRM
- 4.6
CMA / ARV
No comps found within radius.
Projected returns pro-forma
-2.94% appreciation · 3.0% rent growth · sell at horizon
- IRR
- 28.7%
- Equity multiple
- 2.20×
- Total profit
- $33,266
- Equity at exit
- $15,024
- IRR
- 36.0%
- Equity multiple
- 4.33×
- Total profit
- $92,381
- Equity at exit
- $9,013
Cash invested: $27,720 (down + closing). Projections, not guarantees.
Landlord ↔ Tenant lean methodology
- Overall (STATE)
- 46 Balanced
- State Minnesota
- 46 Balanced · D+2
- County
- — inherits STATE
- City
- — inherits STATE
ZIP-level market 56334
- Home prices YoY
- -0.9%
- Active inventory
- 54
- Price-to-rent
- 4.6×
Monthly cashflow live
- Estimated rent
- $1,807 medium interval (Pro) →
- Mortgage (P&I)
- −$519
- Tax from tax record
- −$97 /mo · $1,166/yr
- Insurance
- −$41
- HOA
- −$0
- Vacancy / Maint / Mgmt
- −$380
- Net cashflow
- $770
Break-even live
UW: 25.0% down · 7.5% · 30yr · 1.5% tax · 5.0% vac · 8.0% maint · 8.0% mgmt
Financing live
Cash to close
- Down payment
- $24,750
- Closing costs
- $2,970
- Reserves months
- —
- Total cash needed
- —
Loan-product check · same deal, 3 products live
Conventional
25% down · 7.5% · 30yr
- Down + closing
- —
- Monthly P&I
- —
- Monthly cashflow
- —
- DSCR
- —
- Eligible?
- —
Personal DTI + credit; lowest rate.
DSCR
20% down · 8.5% · 30yr
- Down + closing
- —
- Monthly P&I
- —
- Monthly cashflow
- —
- DSCR
- —
- Eligible?
- —
No personal income docs; deal must DSCR.
Hard money
10% down · 12.0% · 12mo
- Down + closing
- —
- Monthly P&I
- —
- Monthly cashflow
- —
- DSCR
- —
- Eligible?
- —
Short-term bridge; refi at stabilization.
Listing history 3 events
-
2026-06-19days on market $99,000 Active 2 DOM
-
2026-06-17remarks 699-char remark
-
2026-06-17$99,000 Active 1 DOM
ⓘ Source: listings_history table (triggers on properties + properties_extension) + one-shot
backfill from property_details.listing_events for pre-trigger history.
Tax reassessment forecast MN · Partial reset (capped growth)
- Current annual tax
- $1,166 · $97/mo
- Projected year-2 tax
- $1,166 · $97/mo
- Expected delta
- $0/yr ($0/mo · 0.0%)
ⓘ Screening estimate from a state-policy table — verify with the county assessor before closing.
Climate risk First Street
- Flood 1/10 Low 0% chance over 30 yrs
- Wildfire 1/10 Low
- Heat 2/10 Low 7 d/yr ≥97°F today · 13 d/yr by 30 yrs out
- Wind 2/10 Low
- Air quality 3/10 Moderate 3 unhealthy d/yr today · 3 by 30 yrs out
Nearby sold comps map
Loading sold comps map…
Walkable amenities ~0.75 mi
Loading nearby amenities…
Taxation est. · year 1
- Rental income
- $21,687
- − Mortgage interest
- −$5,546
- − Property taxes
- −$1,166
- − Insurance
- −$495
- − Repairs & maintenance
- −$1,735
- − Management
- −$1,735
- − Depreciation
- −$2,880
- Taxable income
- $8,130
- Est. tax owed @ 24.0%
- −$1,951
- After-tax cash flow
- $7,290/yr
For passive investors: Depreciation is non-cash, so a rental often shows a tax loss while cash-flowing — sheltering income. Rental losses are passive: they offset passive income freely, and up to $25,000/yr can offset ordinary (W-2) income if you actively participate and your MAGI is under $100k (phasing out to $0 by $150k); unused losses carry forward. On sale, claimed depreciation is recaptured at up to 25%, and gains may owe capital-gains tax (a 1031 exchange can defer both). Figures are a year-1 estimate at your 24.0% rate — not tax advice; consult a CPA.
Schools (NCES district)
- District
- Minnewaska School District
- NCES district ID
- 2700019
- Math proficiency
- 55% ▼ -6.00%
- Reading proficiency
- 51% ▼ -10.00%
- Median HH income
- $51,589
- Composite
- 45.45/100
- National rank
- #2617
- State rank
- #87 of 301 in MN
Livability — Glenwood
- Score
- 70/100
- State rank
- #336
- US rank
- #7740
Category grades
Schools grade is shown separately in the Schools card above.
Census & demographics
- Census place
- Glenwood, MN
- Population (ZIP)
- 5,791
Population outlook (Pope County) Hauer SSP2
- Today (2025)
- 10,898 people
- By 2030
- 10,765 · -1.2%
- By 2040
- 10,369 · -4.9%
- By 2050
- 9,818 · -9.9%
- By 2075
- 8,532 · -21.7%
- By 2100
- 6,700 · -38.5%
Race, ethnicity, and origin ACS 2023
- Neighborhood character
- Predominantly White (94%)
- Race & ethnicity
- White 94% Two or more races 3% Hispanic / Latino 1% Black 1%
- Common ancestry
- Portuguese 30% Lithuanian 3% Iranian 3%
- Foreign-born
- 1% · Vietnam
- Languages at home
- 98% English-only · Spanish 1% Vietnamese 1%
Political lean MEDSL · Pope
- 2024 margin
- Solid R (+31.7) · D 33.4% · R 65.0% · Other 1.6%
- 2008→2024 swing
- -35.5pp toward R · 2008: 3.8pp · 2024: -31.7pp
- All cycles
- 2024: R+31.7 2020: R+27.6 2016: R+26.8 2012: R+2.6 2008: D+3.8
Not yet ingested
- Civics
- —
Market trends
- HPI YoY
- ▼ -2.94%
- Current HPI
- 333.52
- Rent YoY
- —
- Metro
- —
- State GDP YoY
- ▲ 2.41%
- F500 in state
- 34
Industry mix (Fortune 500 HQ in MN)
| Industry | F500 HQs | Revenue |
|---|---|---|
| Healthcare | 2 | $407B |
|
||
| Retail | 2 | $150B |
|
||
| Consumer Goods | 2 | $32B |
|
||
| Industrial Machinery | 2 | $6B |
|
||
| Agriculture | 1 | $40B |
|
||
| Healthcare / Medical Devices | 1 | $32B |
|
||
Price history
1 event — show timeline
- 2026-06-17 Listed $99,000 NORTHSTARMLS as Distributed by MLS Grid
Property tax history
+6.7%/yrLatest (2026): $1,166 · +13.4% YoY. Source: county tax records.
Cash-flow waterfall
monthlySold comps — $/sqft
last 12 mo · ≤1 miLoading sold comps…