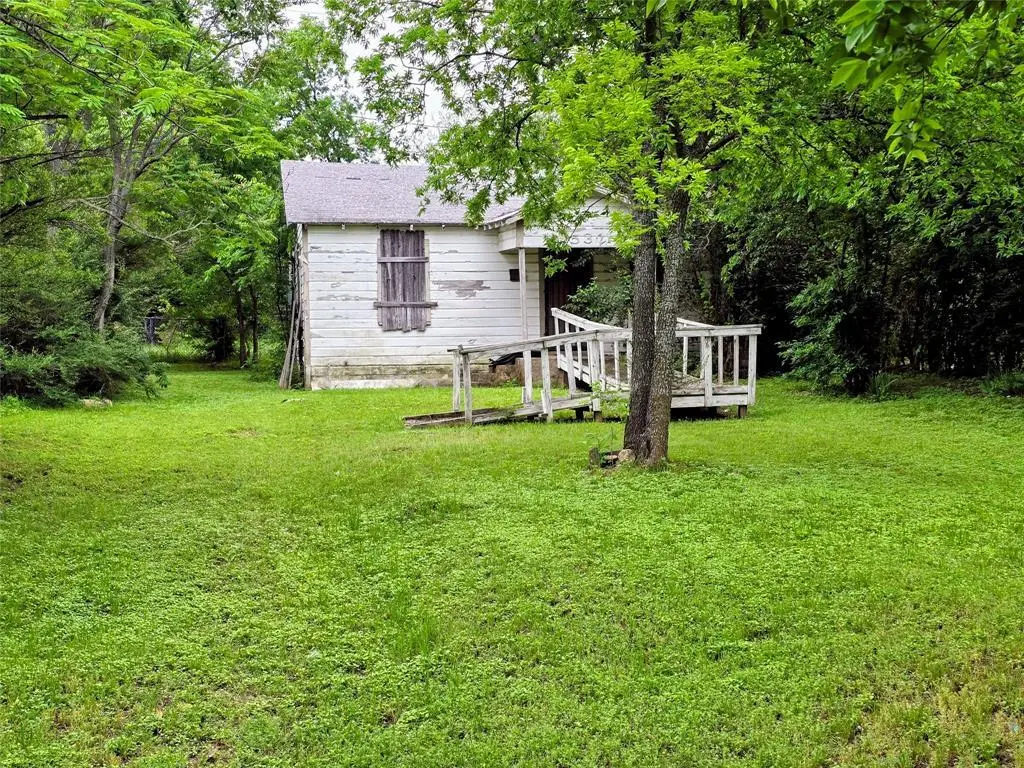
5321 Houghton Ave · Fort Worth, TX
Flood risk 1/10 · Minimal
- FEMA flood zone
- X (unshaded)
- Chance of flooding over 30 yrs
- 0.0%
- Est. flood insurance / yr
- $507 – $1,088
Fire risk 1/10 · Minimal
- Est. fire insurance / yr
- $1,222 – $2,270
Heat risk 8/10 · Major
- Hot days now (above 108°F)
- 7 days/yr
- Hot days in 30 yrs
- 24 days/yr
Wind risk 4/10 · Minor
- Chance of severe wind over 30 yrs
- 24.0%
Air-quality risk 3/10 · Minor
- Unhealthy air days now
- 2 days/yr
- Unhealthy air days in 30 yrs
- 3 days/yr
Risk factors via First Street. Map © Google.
Why this score? — see what drove the B+ grade
The composite is a weighted blend of 9 inputs, each scored 0–100. Each bar is that input's sub-score; the figure is the points it added to the 100-point composite (weight × sub-score).
- Cash flow +30.0/30.0
- ARV discount +15.0/15.0
- DSCR +10.0/10.0
- 1% rule +9.8/10.0
- Livability +4.0/5.0
- Rent growth +3.2/5.0
- Condition / age +2.5/5.0
- Schools +2.0/10.0
- Appreciation +0.0/10.0
$89,999
🖨 Deal sheet 📄 Offer letter ✓ Due diligence
Listing remarks MLS
ATTENTION INVESTORS!!!!! Great investment opportunity! NEW water and gas meters installed in the last year. Conveniently located near: downtown Fort Worth, Camp Bowie, restaurants and entertainment. All information is deemed reliable. Buyers and buyers agents to due their own due diligence.
Key facts
- Downtown fort worth
- Camp bowie
- 6,273 sq ft lot
Tags
Neighborhood map
What this means for you Summary
Snapshot
- This is a 2-bed/1.0-bath single-family listed at $90k.
Deal economics
- At list price, monthly cash flow is $447 ($5k/yr) — positive.
- The deal already cash-flows at list — no discount required.
- Meets the 1% rule at list price ($1k rent vs $90k).
- Recommended offer: $87k (3.0% below list) — sets the bar for market timing.
- Cap rate 12.2% vs local median 3.9% in Fort Worth — top-decile yield for the area; either an underpriced asset or a hidden risk that comps aren't pricing in. Stress-test before assuming the spread holds.
Location & tenants
- Location reads 80/100 on livability (#49 in TX, #1,954 nationally) — a professional / high-income tenant draw. Strengths: amenities A+, cost of living A+, housing A+; Watch: schools D+, crime F.
- Fort Worth ISD (urban): math 18% / reading 28% proficiency, ranked #742 of 826 in TX (top 90%) — low school quality limits family demand, transient renter base, plan for 1-2y turnover; 73% free/reduced lunch — lower-income household profile, screen leases tightly.
- Market conditions: Rents rising (+2.9%/yr); 271 active listings in the ZIP; 40 comparable units currently listed for rent nearby; rentals leasing fast (median 13d on market — plan ~1-2 weeks tenant-placement turnaround); solid renter incomes; 18,938 units permitted in Tarrant County in 2024 (8,336 in 5+ unit buildings).
Forward outlook
- Local home prices are declining (-3.0%/yr); year-one equity from $622 of loan paydown is wiped out by about $3k of value loss. Plan a longer hold.
- Tarrant County population projected at +41% by 2050 — long-run rental-demand tailwind backs the buy-and-hold thesis.
- At projected returns (-3.0% appreciation + 2.9% rent growth), your $25k cash investment doubles in ~6 years — after that, you're playing with house money.
Negotiation context
- It's been on market 46 days — a 3% lower offer ($87k) is reasonable based on typical stale-listing flexibility.
- 2 sale attempts since 15y ago; this cycle's ask has dropped $5k (5%) from the opening price — seller is motivated, your offer sets the floor, not the list.
Risks & watch-outs
- Watch-outs: built in 1951 — expect roof / HVAC / electrical / plumbing capex.
- Climate carrying-cost: extreme-heat days projected 7→24/yr by 2055 (HVAC capex compounding) — expect insurance premiums to compound above CPI over the hold.
Questions for the listing agent
- It's been on market 46 days. Have you received any prior offers? Is the seller open to a 3% concession, seller financing, or rate buy-down credit?
- Built in 1951 — when were the roof, HVAC, electrical panel, plumbing, and water heater last replaced?
- Is there a deadline driving the sale (1031 exchange, divorce, estate, relocation)? That informs how much negotiation room exists.
- Schools are D-rated, which usually means shorter tenancies and higher turnover. Who's the typical renter profile here, and what's been the actual vacancy rate?
- Crime grade is F in this area — have there been break-ins, vandalism, or insurance claims at this property in the last 3 years? What carrier currently insures it and at what premium?
- What's the average days-on-market for RENTAL listings here right now (not sales)? A rising rental-DOM trend means longer vacancies and softer asking-rent achievability than the comps imply.
- What's the recent tenant-quality profile in this submarket — average credit score on applications, eviction rate, late-payment / NSF rate, and stable-employment percentage? A property-management company in the area should have these aggregated.
- How much new for-sale + rental construction is in the pipeline within 1–3 miles? Heavy new supply typically softens prices + rents 12–24 months out; constrained supply supports both.
Investment metrics
- 1% rule
- 1.48% ✓
- Cap rate
- 12.25%
- Cash-on-cash
- 21.27%
- DSCR
- 1.95
- GRM
- 5.6
CMA / ARV
- ARV (median comp)
- $149,069
- List price
- $89,999
- Delta
- -39.63%
- Verdict
- UNDERPRICED
- Comps
- 12 within 1.0 mi
Projected returns pro-forma
-3.0% appreciation · 2.94% rent growth · sell at horizon
- IRR
- 13.7%
- Equity multiple
- 1.55×
- Total profit
- $13,791
- Equity at exit
- $13,419
- IRR
- 22.5%
- Equity multiple
- 2.92×
- Total profit
- $48,349
- Equity at exit
- $7,781
Cash invested: $25,200 (down + closing). Projections, not guarantees.
Landlord ↔ Tenant lean methodology
- Overall (STATE)
- 87 Strongly Landlord-Friendly
- State Texas
- 87 Strongly Landlord-Friendly · R+5
- County
- — inherits STATE
- City
- — inherits STATE
ZIP-level market 76107
- Rents YoY
- 2.9%
- Active inventory
- 271
- Price-to-rent
- 5.6×
Monthly cashflow live
- Estimated rent
- $1,333 high interval (Pro) →
- Mortgage (P&I)
- −$472
- Tax from tax record
- −$97 /mo · $1,163/yr
- Insurance
- −$37
- HOA
- −$0
- Vacancy / Maint / Mgmt
- −$280
- Net cashflow
- $447
Break-even live
UW: 25.0% down · 7.5% · 30yr · 1.5% tax · 5.0% vac · 8.0% maint · 8.0% mgmt
Financing live
Cash to close
- Down payment
- $22,500
- Closing costs
- $2,700
- Reserves months
- —
- Total cash needed
- —
Loan-product check · same deal, 3 products live
Conventional
25% down · 7.5% · 30yr
- Down + closing
- —
- Monthly P&I
- —
- Monthly cashflow
- —
- DSCR
- —
- Eligible?
- —
Personal DTI + credit; lowest rate.
DSCR
20% down · 8.5% · 30yr
- Down + closing
- —
- Monthly P&I
- —
- Monthly cashflow
- —
- DSCR
- —
- Eligible?
- —
No personal income docs; deal must DSCR.
Hard money
10% down · 12.0% · 12mo
- Down + closing
- —
- Monthly P&I
- —
- Monthly cashflow
- —
- DSCR
- —
- Eligible?
- —
Short-term bridge; refi at stabilization.
Rent comps 40 comps
| Address | Beds | Baths | Sqft | Rent | $/sqft | DOM | Units | Dist |
|---|---|---|---|---|---|---|---|---|
| 5209 Kilpatrick Ave Fort Worth, TX | 2.0 | 1.0 | 650 | $1,500 | $2.31 | 43d | 1 | 0.29mi |
| 5201 Curzon Ave Unit 9 Fort Worth, TX | 1.0 | 1.0 | 650 | $1,350 | $2.08 | 43d | 1 | 0.32mi |
| 5201 Curzon Ave #3 Fort Worth, TX | 1.0 | 1.0 | 650 | $1,200 | $1.85 | 4d | 1 | 0.33mi |
| 4901 Curzon Ave Unit 105 Fort Worth, TX | 1.0 | 1.0 | 716 | $1,375 | $1.92 | 43d | 1 | 0.56mi |
| 4720 Wellesley Ave Fort Worth, TX | 1.0 | 1.0 | 570 | $1,100 | $1.93 | 43d | 1 | 0.64mi |
| 4720 Wellesley Ave Fort Worth, TX | 1.0–2.0 | 1.0 | 745 | $1,175 | $1.58 | 24d | 1 | 0.64mi |
| 5928 Fletcher Ave Fort Worth, TX | 1.0 | 1.0 | 588 | $1,150 | $1.96 | 43d | 1 | 0.65mi |
| 5928 Fletcher Ave Fort Worth, TX | 1.0 | 1.0 | 588 | $1,050 | $1.78 | 24d | 3 | 0.65mi |
| 5928 Fletcher Ave Unit 16 Fort Worth, TX | 1.0 | 1.0 | 588 | $1,100 | $1.87 | 24d | 1 | 0.65mi |
| 5928 Fletcher Ave Apt 20 Fort Worth, TX | 1.0 | 1.0 | 588 | $999 | $1.70 | 24d | 1 | 0.65mi |
| 4727 Wellesley Ave Fort Worth, TX | 2.0 | 1.0–2.0 | 786 | $1,430 | $1.82 | 10d | 15 | 0.66mi |
| 5825 Calmont Ave Unit 1101 Fort Worth, TX | 1.0 | 1.0 | 605 | $1,199 | $1.98 | 5d | 1 | 0.75mi |
| 3601 Westridge Ave Unit 3616 Fort Worth, TX | 1.0 | 1.0 | 610 | $1,219 | $2.00 | 2d | 1 | 0.77mi |
| 3601 Westridge Ave Fort Worth, TX | 1.0 | 1.0 | 610 | $1,211 | $1.99 | 12d | 1 | 0.77mi |
| 3601 Westridge Ave Unit 3622 Fort Worth, TX | 1.0 | 1.0 | 610 | $1,266 | $2.08 | 13d | 1 | 0.77mi |
| 5885 Calmont Ave Fort Worth, TX | 1.0–3.0 | 1.0–2.5 | 1214 | $2,389 | $1.97 | 1d | 151 | 0.77mi |
| 4928 El Campo Ave Fort Worth, TX | 1.0–2.0 | 1.0 | 800 | $1,350 | $1.69 | 1d | 5 | 0.88mi |
| 4000 Hulen Pl Fort Worth, TX | 1.0 | 1.0 | 672 | $1,175 | $1.75 | 13d | 1 | 0.89mi |
| 4000 Hulen St Fort Worth, TX | 1.0 | 1.0 | 600 | $1,469 | $2.45 | 24d | 1 | 0.90mi |
| 4000 Hulen Pl Unit 4051 Fort Worth, TX | 1.0 | 1.0 | 672 | $1,175 | $1.75 | 12d | 1 | 0.91mi |
| 4000 Hulen Pl Unit 4021 Fort Worth, TX | 1.0 | 1.0 | 672 | $1,272 | $1.89 | 2d | 1 | 0.91mi |
| 4000 Hulen Pl Unit 4021 Fort Worth, TX | 1.0 | 1.0 | 672 | $1,180 | $1.76 | 13d | 1 | 0.91mi |
| 4000 Hulen Pl Unit 4074 Fort Worth, TX | 1.0 | 1.0 | 672 | $1,180 | $1.76 | 12d | 1 | 0.91mi |
| 4716 Littlepage St Fort Worth, TX | 2.0 | 1.0 | 748 | $1,195 | $1.60 | 24d | 1 | 0.95mi |
| 4900 Bryant Irvin Rd N Fort Worth, TX | 1.0 | 1.0 | 645 | $824 | $1.28 | 12d | 1 | 1.03mi |
| 4900 Bryant Irvin Rd N Unit 2121 Fort Worth, TX | 2.0 | 2.0 | 750 | $1,257 | $1.68 | 2d | 1 | 1.03mi |
| 4900 Bryant Irvin Rd N Unit 4921 Fort Worth, TX | 1.0 | 1.0 | 596 | $1,045 | $1.75 | 13d | 1 | 1.03mi |
| 4900 Bryant Irvin Rd N Unit 1121 Fort Worth, TX | 1.0 | 1.0 | 645 | $875 | $1.36 | 11d | 1 | 1.03mi |
| 4900 Bryant Irvin Rd N Unit 4921 Fort Worth, TX | 1.0 | 1.0 | 645 | $832 | $1.29 | 2d | 1 | 1.03mi |
| 4900 Bryant Irvin Rd N Unit 4951 Fort Worth, TX | 1.0 | 1.0 | 596 | $1,040 | $1.74 | 43d | 1 | 1.06mi |
| 4900 Bryant Irvin Rd N Unit 4957 Fort Worth, TX | 2.0 | 2.0 | 750 | $1,300 | $1.73 | 11d | 1 | 1.06mi |
| 4945 Gage Ave Fort Worth, TX | 3.0 | 1.0–3.0 | 1217 | $3,381 | $2.78 | 1d | 45 | 1.17mi |
| 4900 Gage Ave Fort Worth, TX | 1.0–3.0 | 1.0–2.0 | 1128 | $4,238 | $3.76 | 1d | 42 | 1.22mi |
| 4538 Byers Ave Unit 2 Fort Worth, TX | 1.0 | 1.0 | 600 | $1,150 | $1.92 | 14d | 1 | 1.23mi |
| 2500 River Park Dr Fort Worth, TX | 1.0–2.0 | 1.0–2.0 | 1006 | $2,686 | $2.67 | 1d | 19 | 1.37mi |
| 3285 Clover Ln Fort Worth, TX | 1.0 | 1.0 | 500 | $2,100 | $4.20 | 4d | 1 | 1.39mi |
| 2200 Taxco Rd Fort Worth, TX | 1.0 | 1.0 | 750 | $999 | $1.33 | 3d | 2 | 1.42mi |
| 2501 Oak Hill Cir Fort Worth, TX | 1.0–3.0 | 1.0–2.0 | 921 | $1,606 | $1.74 | 1d | 43 | 1.47mi |
| 2450 Oak Hill Cir Fort Worth, TX | 1.0–4.0 | 1.0–2.5 | 1120 | $1,867 | $1.67 | 1d | 80 | 1.47mi |
| 2294 Ridgmar Plz Unit 108 Fort Worth, TX | 1.0 | 1.0 | 750 | $840 | $1.12 | 43d | 1 | 1.47mi |
Listing history 12 events
-
2026-06-01days on market $89,999 Active 46 DOM
-
2026-05-31days on market $89,999 Active 45 DOM
-
2026-04-28price $89,999 293-char remark
Show marketing remark (293 chars)
ATTENTION INVESTORS!!!!! Great investment opportunity! NEW water and gas meters installed in the last year. Conveniently located near: downtown Fort Worth, Camp Bowie, restaurants and entertainment. All information is deemed reliable. Buyers and buyers agents to due their own due diligence.
-
2026-04-16$94,999 Active 293-char remark
Show marketing remark (293 chars)
ATTENTION INVESTORS!!!!! Great investment opportunity! NEW water and gas meters installed in the last year. Conveniently located near: downtown Fort Worth, Camp Bowie, restaurants and entertainment. All information is deemed reliable. Buyers and buyers agents to due their own due diligence.
-
2011-03-18status Pending 209-char remark
Show marketing remark (209 chars)
Optimal Opportunity. Property is already tenant occupied! Steady cash flow. This is a Fannie Mae Homepath Property! Newer heating unit installed. Close to Lake Como. Email agent for additional interior photos.
-
2011-03-18soldstatus Closed 209-char remark
Show marketing remark (209 chars)
Optimal Opportunity. Property is already tenant occupied! Steady cash flow. This is a Fannie Mae Homepath Property! Newer heating unit installed. Close to Lake Como. Email agent for additional interior photos.
-
2011-03-10historical Active Option Contract 209-char remark
Show marketing remark (209 chars)
Optimal Opportunity. Property is already tenant occupied! Steady cash flow. This is a Fannie Mae Homepath Property! Newer heating unit installed. Close to Lake Como. Email agent for additional interior photos.
-
2011-03-01price $9,900 209-char remark
Show marketing remark (209 chars)
Optimal Opportunity. Property is already tenant occupied! Steady cash flow. This is a Fannie Mae Homepath Property! Newer heating unit installed. Close to Lake Como. Email agent for additional interior photos.
-
2011-01-27$12,500 Active 209-char remark
Show marketing remark (209 chars)
Optimal Opportunity. Property is already tenant occupied! Steady cash flow. This is a Fannie Mae Homepath Property! Newer heating unit installed. Close to Lake Como. Email agent for additional interior photos.
-
2007-05-16soldstatus
-
1996-09-12soldstatus
-
1984-09-27soldstatus
ⓘ Source: listings_history table (triggers on properties + properties_extension) + one-shot
backfill from property_details.listing_events for pre-trigger history.
Tax reassessment forecast TX · Resets to sale price
- Current annual tax
- $1,163 · $97/mo
- Projected year-2 tax
- $1,647 · $137/mo
- Expected delta
- +$484/yr (+$40/mo · 41.7%)
ⓘ Screening estimate from a state-policy table — verify with the county assessor before closing.
Climate risk First Street
- Flood 1/10 Low FEMA zone X (unshaded) · 0% chance over 30 yrs
- Wildfire 1/10 Low
- Heat 8/10 Severe 7 d/yr ≥108°F today · 24 d/yr by 30 yrs out
- Wind 4/10 Moderate 24% chance of damaging wind over 30 yrs
- Air quality 3/10 Moderate 2 unhealthy d/yr today · 3 by 30 yrs out
Nearby sold comps map
Loading sold comps map…
Walkable amenities ~0.75 mi
Loading nearby amenities…
Taxation est. · year 1
- Rental income
- $15,994
- − Mortgage interest
- −$5,041
- − Property taxes
- −$1,163
- − Insurance
- −$450
- − Repairs & maintenance
- −$1,280
- − Management
- −$1,280
- − Depreciation
- −$2,618
- Taxable income
- $4,163
- Est. tax owed @ 24.0%
- −$999
- After-tax cash flow
- $4,360/yr
For passive investors: Depreciation is non-cash, so a rental often shows a tax loss while cash-flowing — sheltering income. Rental losses are passive: they offset passive income freely, and up to $25,000/yr can offset ordinary (W-2) income if you actively participate and your MAGI is under $100k (phasing out to $0 by $150k); unused losses carry forward. On sale, claimed depreciation is recaptured at up to 25%, and gains may owe capital-gains tax (a 1031 exchange can defer both). Figures are a year-1 estimate at your 24.0% rate — not tax advice; consult a CPA.
Schools (NCES district)
- District
- Fort Worth ISD
- NCES district ID
- 4819700
- Math proficiency
- 18% ▼ -16.00%
- Reading proficiency
- 28% ▼ -6.00%
- Median HH income
- $42,109
- Composite
- 19.61/100
- National rank
- #8753
- State rank
- #742 of 826 in TX
Livability — Fort Worth
- Score
- 80/100
- State rank
- #49
- US rank
- #1954
Category grades
Schools grade is shown separately in the Schools card above.
Census & demographics
- Census place
- Fort Worth, TX
- County
- Tarrant County · 2,033,669 people
- City population
- 911,619
- Metro
- Dallas-Fort Worth-Arlington, TX
- Population (ZIP)
- 30,994
- Household income
- $79,990
- Rent vs Own
- Severe rent burden
- 2303.0
Population outlook (Tarrant County) Hauer SSP2
- Today (2025)
- 2,380,417 people
- By 2030
- 2,578,900 · +8.3%
- By 2040
- 2,974,995 · +25.0%
- By 2050
- 3,350,489 · +40.8%
- By 2075
- 4,216,909 · +77.2%
- By 2100
- 4,741,527 · +99.2%
Race, ethnicity, and origin ACS 2023
- Neighborhood character
- Diverse neighborhood (Simpson 0.58)
- Race & ethnicity
- White 59% Hispanic / Latino 20% Black 15% Two or more races 8% Asian 3%
- Hispanic origin (detail)
- Mexican 17%
- Common ancestry
- Slovak 3% Lithuanian 2% Romanian 1%
- Foreign-born
- 9% · Canada, China, Vietnam
- Languages at home
- 82% English-only · Spanish 14% French/Haitian/Cajun 1% Chinese 1%
Political lean MEDSL · Tarrant
- 2024 margin
- Lean R (+5.1) · D 46.7% · R 51.9% · Other 1.4%
- 2008→2024 swing
- +6.6pp toward D · 2008: -11.7pp · 2024: -5.1pp
- All cycles
- 2024: R+5.1 2020: D+0.2 2016: R+8.7 2012: R+15.7 2008: R+11.7
Not yet ingested
- Civics
- —
Market trends
- HPI YoY
- ▼ -447.90%
- Current HPI
- 296.4355
- Rent YoY
- ▲ 2.94%
- Metro
- Dallas-Fort Worth-Arlington, TX
- State GDP YoY
- ▲ 3.95%
- F500 in state
- 110
Industry mix (Fortune 500 HQ in TX)
| Industry | F500 HQs | Revenue |
|---|---|---|
| Energy | 16 | $1,198B |
|
||
| Technology | 5 | $198B |
|
||
| Engineering / Construction | 4 | $72B |
|
||
| Energy Services | 3 | $60B |
|
||
| Utilities | 3 | $41B |
|
||
| Healthcare | 2 | $330B |
|
||
Price history
+620.0% since first listed10 events — show timeline
- 2026-04-28 Price Changed $89,999 NTREIS
- 2026-04-16 Listed $94,999 NTREIS
- 2011-03-18 Pending — NTREIS
- 2011-03-18 Sold (MLS) — NTREIS
- 2011-03-10 Contingent — NTREIS
- 2011-03-01 Price Changed $9,900 NTREIS
- 2011-01-27 Listed $12,500 NTREIS
- 2007-05-16 Sold (Public Records) — Public Records
- 1996-09-12 Sold (Public Records) — Public Records
- 1984-09-27 Sold (Public Records) — Public Records
Property tax history
+6.6%/yrLatest (2025): $1,163 · -22.1% YoY. Source: county tax records.
Cash-flow waterfall
monthlySold comps — $/sqft
last 12 mo · ≤1 miLoading sold comps…