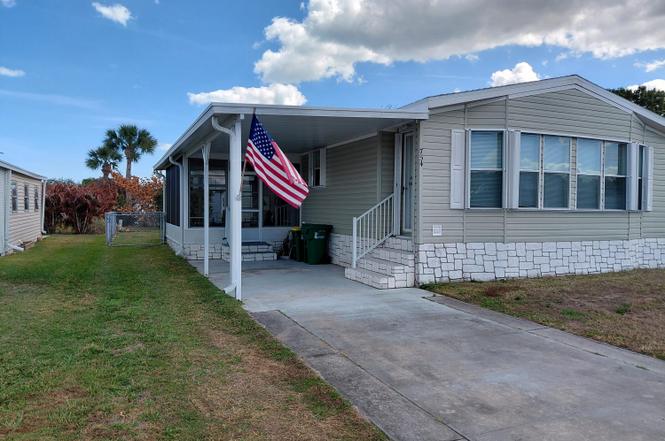
754 Lark Dr · Micco, FL
Flood risk 1/10 · Minimal
- FEMA flood zone
- X (unshaded)
- Chance of flooding over 30 yrs
- 0.0%
- Est. flood insurance / yr
- $507 – $1,088
Fire risk 6/10 · Moderate
- Est. fire insurance / yr
- $947 – $1,759
Heat risk 10/10 · Severe
- Hot days now (above 106°F)
- 7 days/yr
- Hot days in 30 yrs
- 24 days/yr
Wind risk 10/10 · Severe
- Chance of severe wind over 30 yrs
- 99.0%
Air-quality risk 1/10 · Minimal
- Unhealthy air days now
- 0 days/yr
- Unhealthy air days in 30 yrs
- 0 days/yr
Risk factors via First Street. Map © Google.
Why this score? — see what drove the D- grade
The composite is a weighted blend of 9 inputs, each scored 0–100. Each bar is that input's sub-score; the figure is the points it added to the 100-point composite (weight × sub-score).
- Cash flow +11.5/30.0
- ARV discount +7.5/15.0
- Schools +4.7/10.0
- 1% rule +3.8/10.0
- DSCR +3.4/10.0
- Livability +3.2/5.0
- Rent growth +2.5/5.0
- Condition / age +2.5/5.0
- Appreciation +0.0/10.0
$205,000
🖨 Deal sheet 📄 Offer letter ✓ Due diligence
Listing remarks MLS
Over 1400 sq. ft. inside. 2006 model within walking distance to banks, golf and pool. Bright front Florida room plus side screen porch for relaxing and entertaining. Interior laundry room includes washer & dryer. Enormous master suite runs full width of home. Tax amount includes annual HOA dues. One time $525 membership fee due at closing.
Key facts
- Many updates
- Front veranda room
- Fully furnished home
Tags
Property features AI
Exterior
- Parking: Attached carport (1 space)
- Utilities: Public sewer; Electricity connected; Water connected; Sewer connected
- Home design: Manufactured home; Faces north
- Construction: Frame construction; Vinyl siding
- Exterior features: Storm shutters; Chain link fenced yard; Fenced
Interior
- Kitchen: Dishwasher; Electric range; Microwave; Refrigerator; Ice maker; Electric water heater
- Bedrooms: 2 bedrooms
- Bathrooms: 2 full bathrooms
- Heating & cooling: Central heating (electric); Central air conditioning (electric)
- Interior features: 8 total rooms; Raised porch
- Laundry & utility: Washer and dryer included
Neighborhood map
What this means for you Summary
Snapshot
- This is a 2-bed/2.0-bath manufactured listed at $205k.
Deal economics
- At list price, monthly cash flow is $-66 ($-791/yr) — negative.
- To cash-flow at today's rent, offer at most $193k (5.7% below list).
- To meet the 1% rule (rent ≥ 1% of price), the offer needs to be $180k (12.4% below list).
- Recommended offer: $180k (12.4% below list) — sets the bar for 1% rule.
Location & tenants
- Location reads 65/100 on livability (#633 in FL) — a middle-class / working-renter tenant base. Strengths: cost of living A+, housing A+; Watch: employment D, amenities F, commute F.
- Brevard (suburban): math 53% / reading 57% proficiency, ranked #19 of 73 in FL (top 26%) — acceptable for families but not a draw, mixed tenant base, ~2y average lease.
- Zoned schools: Sunrise Elementary School (math 52% / reading 57%, grade C, #892 of 2,144 statewide, top 44%, 759 students, 58% FRL); Southwest Middle School (math 40% / reading 39%, grade F, #373 of 571 statewide, top 66%, 920 students, 58% FRL); Bayside High School (math 27% / reading 40%, grade F, #400 of 667 statewide, top 61%, 1,854 students, 51% FRL).
- Zoned-school proficiency averages 42% at this address vs 55% district-wide (-12 pts) — the specific schools serving this property underperform the Brevard average; the district grade overstates school quality for this exact location.
- Market conditions: 185 active listings in the ZIP; 19 comparable units currently listed for rent nearby; rentals at typical pace (median 24d on market — plan ~3-4 weeks tenant-placement turnaround); 4,602 units permitted in Brevard County in 2024 (702 in 5+ unit buildings).
Forward outlook
- Local home prices are declining (-3.0%/yr); year-one equity from $1k of loan paydown is wiped out by about $6k of value loss. Plan a longer hold.
- Brevard County population projected at +15% by 2050 — modest demand growth; plan on rents tracking national, not racing it.
Negotiation context
- It's been on market 107 days — a 9% lower offer ($187k) is reasonable based on typical stale-listing flexibility.
- 3 sale attempts since 12y ago; this cycle's ask has dropped $30k (13%) from the opening price — seller is motivated, your offer sets the floor, not the list.
- Current owner paid $110k; list at $205k implies a 86% gain — meaningful room to come down on a strong offer.
Risks & watch-outs
- Climate carrying-cost: severe wind risk, 99% chance of damaging wind over 30y; major wildfire risk; extreme-heat days projected 7→24/yr by 2055 (HVAC capex compounding) — expect insurance premiums to compound above CPI over the hold.
Questions for the listing agent
- What do current leases actually rent for vs. the listed asking? Can we see a recent rent roll and the last 12 months of T-12 income?
- It's been on market 107 days. Have you received any prior offers? Is the seller open to a 12% concession, seller financing, or rate buy-down credit?
- Why hasn't it sold? Are there any deal-killer items the seller is aware of (foundation, flood, title, zoning, code violations)?
- Is there a deadline driving the sale (1031 exchange, divorce, estate, relocation)? That informs how much negotiation room exists.
- Schools are F-rated, which usually means shorter tenancies and higher turnover. Who's the typical renter profile here, and what's been the actual vacancy rate?
- The area grade is low — what's the realistic commute time and amenity access for the typical tenant pool here? Any planned neighborhood developments (good or bad) we should know about?
- What's the average days-on-market for RENTAL listings here right now (not sales)? A rising rental-DOM trend means longer vacancies and softer asking-rent achievability than the comps imply.
- What's the recent tenant-quality profile in this submarket — average credit score on applications, eviction rate, late-payment / NSF rate, and stable-employment percentage? A property-management company in the area should have these aggregated.
- How much new for-sale + rental construction is in the pipeline within 1–3 miles? Heavy new supply typically softens prices + rents 12–24 months out; constrained supply supports both.
Investment metrics
- 1% rule
- 0.88% ✗
- Cap rate
- 5.91%
- Cash-on-cash
- -1.38%
- DSCR
- 0.94
- GRM
- 9.5
CMA / ARV
No comps found within radius.
Projected returns pro-forma
-3.0% appreciation · 3.0% rent growth · sell at horizon
- IRR
- -18.5%
- Equity multiple
- 0.35×
- Total profit
- $-37,348
- Equity at exit
- $30,566
- IRR
- -10.8%
- Equity multiple
- 0.34×
- Total profit
- $-37,649
- Equity at exit
- $17,725
Cash invested: $57,400 (down + closing). Projections, not guarantees.
Landlord ↔ Tenant lean methodology
- Overall (STATE)
- 87 Strongly Landlord-Friendly
- State Florida
- 87 Strongly Landlord-Friendly · R+3
- County
- — inherits STATE
- City
- — inherits STATE
ZIP-level market 32976
- Home prices YoY
- -18.6%
- Active inventory
- 185
- Price-to-rent
- 9.5×
Monthly cashflow live
- Estimated rent
- $1,796 high interval (Pro) →
- Mortgage (P&I)
- −$1,075
- Tax from tax record
- −$324 /mo · $3,888/yr
- Insurance
- −$85
- HOA
- −$0
- Vacancy / Maint / Mgmt
- −$377
- Net cashflow
- $-66
Break-even live
UW: 25.0% down · 7.5% · 30yr · 1.5% tax · 5.0% vac · 8.0% maint · 8.0% mgmt
Financing live
Cash to close
- Down payment
- $51,250
- Closing costs
- $6,150
- Reserves months
- —
- Total cash needed
- —
Loan-product check · same deal, 3 products live
Conventional
25% down · 7.5% · 30yr
- Down + closing
- —
- Monthly P&I
- —
- Monthly cashflow
- —
- DSCR
- —
- Eligible?
- —
Personal DTI + credit; lowest rate.
DSCR
20% down · 8.5% · 30yr
- Down + closing
- —
- Monthly P&I
- —
- Monthly cashflow
- —
- DSCR
- —
- Eligible?
- —
No personal income docs; deal must DSCR.
Hard money
10% down · 12.0% · 12mo
- Down + closing
- —
- Monthly P&I
- —
- Monthly cashflow
- —
- DSCR
- —
- Eligible?
- —
Short-term bridge; refi at stabilization.
Rent comps 19 comps
| Address | Beds | Baths | Sqft | Rent | $/sqft | DOM | Units | Dist |
|---|---|---|---|---|---|---|---|---|
| 914 Pecan Cir Sebastian, FL | 2.0 | 1.0 | 1000 | $1,600 | $1.60 | 23d | 1 | 0.12mi |
| 805 Beech Ct Sebastian, FL | 2.0 | 2.0 | 1556 | $1,995 | $1.28 | 23d | 1 | 0.22mi |
| 702 Lark Dr Sebastian, FL | 3.0 | 2.0 | 1296 | $1,775 | $1.37 | 23d | 1 | 0.28mi |
| 1207 Marigold Dr Sebastian, FL | 2.0 | 2.0 | 1104 | $1,500 | $1.36 | 23d | 1 | 0.33mi |
| 904 Red Bud Rd Sebastian, FL | 3.0 | 2.0 | 1278 | $1,500 | $1.17 | 23d | 1 | 0.37mi |
| 909 Sequoia St Sebastian, FL | 2.0 | 2.0 | 1156 | $1,845 | $1.60 | 23d | 1 | 0.42mi |
| 621 Hyacinth Cir Sebastian, FL | 2.0 | 2.0 | 1324 | $1,850 | $1.40 | 23d | 1 | 0.53mi |
| 706 Hyacinth Cir Sebastian, FL | 2.0 | 2.0 | 1062 | $1,750 | $1.65 | 23d | 1 | 0.66mi |
| 1112 Pocatella Dr Sebastian, FL | 2.0 | 2.0 | 1370 | $1,900 | $1.39 | 23d | 1 | 0.67mi |
| 629 W Marlin Cir Unit NA Sebastian, FL | 2.0 | 2.0 | 1104 | $1,400 | $1.27 | 14d | 1 | 0.71mi |
| 1315 Barefoot Cir Sebastian, FL | 2.0 | 2.0 | 1167 | $2,300 | $1.97 | 23d | 1 | 0.83mi |
| 7419 Tourmaline Dr Unit Annual Grant-Valkaria, FL | 3.0 | 2.0 | 1676 | $2,200 | $1.31 | 23d | 1 | 0.87mi |
| 415 Plover Dr Sebastian, FL | 3.0 | 2.0 | 1200 | $2,400 | $2.00 | 23d | 1 | 0.92mi |
| 7349 Tourmaline Dr Grant, FL | 3.0 | 2.0 | 1735 | $2,200 | $1.27 | 23d | 1 | 0.93mi |
| 7629 Chasta Rd Sebastian, FL | 2.0 | 2.0 | 958 | $1,600 | $1.67 | 23d | 1 | 0.95mi |
| 7606 Cedar Bark Rd Sebastian, FL | 2.0 | 2.0 | 1273 | $1,800 | $1.41 | 23d | 1 | 0.97mi |
| 7597 Cedar Bark Rd Sebastian, FL | 2.0 | 2.0 | 902 | $1,700 | $1.88 | 23d | 1 | 0.99mi |
| 830 Lychee Dr Sebastian, FL | 2.0 | 2.0 | 1269 | $2,000 | $1.58 | 23d | 1 | 1.01mi |
| 7181 Blue Shore Rd Grant, FL | 3.0 | 2.0 | 1598 | $1,995 | $1.25 | 23d | 1 | 1.22mi |
Listing history 26 events
-
2026-06-18days on market $205,000 Active 107 DOM
-
2026-06-17days on market $205,000 Active 106 DOM
-
2026-06-16days on market $205,000 Active 105 DOM
-
2026-06-15price $205,000 Active 104 DOM
-
2026-06-15days on market $235,000 Active 104 DOM
-
2026-06-14days on market $235,000 Active 102 DOM
-
2026-06-10days on market $235,000 Active 99 DOM
-
2026-06-08days on market $235,000 Active 97 DOM
-
2026-06-07days on market $235,000 Active 96 DOM
-
2026-06-05days on market $235,000 Active 93 DOM
-
2026-06-03days on market $235,000 Active 92 DOM
-
2026-06-02days on market $235,000 Active 91 DOM
-
2026-06-01days on market $235,000 Active 90 DOM
-
2026-05-31days on market $235,000 Active 89 DOM
-
2026-05-31days on market $235,000 Active 88 DOM
-
2026-03-03price $235,000
-
2026-02-21$234,900 Active
-
2015-04-03soldstatus $110,000
-
2015-03-31soldstatus $110,000 347-char remark
Show marketing remark (347 chars)
Over 1400 sq. ft. inside. 2006 model within walking distance to banks, golf and pool. Bright front Florida room plus side screen porch for relaxing and entertaining. Interior laundry room includes washer & dryer. Enormous master suite runs full width of home. Tax amount includes annual HOA dues. One time $525 membership fee due at closing.
-
2015-01-15historical
-
2014-10-13$119,900
-
2014-10-02$119,900 347-char remark
Show marketing remark (347 chars)
Over 1400 sq. ft. inside. 2006 model within walking distance to banks, golf and pool. Bright front Florida room plus side screen porch for relaxing and entertaining. Interior laundry room includes washer & dryer. Enormous master suite runs full width of home. Tax amount includes annual HOA dues. One time $525 membership fee due at closing.
-
1986-12-01soldstatus $40,300
-
1980-01-01soldstatus $41,500
-
1978-04-01soldstatus $31,000
ⓘ Source: listings_history table (triggers on properties + properties_extension) + one-shot
backfill from property_details.listing_events for pre-trigger history.
Tax reassessment forecast FL · Resets to sale price
- Current annual tax
- $3,888 · $324/mo
- Projected year-2 tax
- $3,888 · $324/mo
- Expected delta
- $0/yr ($0/mo · 0.0%)
ⓘ Screening estimate from a state-policy table — verify with the county assessor before closing.
Climate risk First Street
- Flood 1/10 Low FEMA zone X (unshaded) · 0% chance over 30 yrs
- Wildfire 6/10 Major
- Heat 10/10 Extreme 7 d/yr ≥106°F today · 24 d/yr by 30 yrs out
- Wind 10/10 Extreme 99% chance of damaging wind over 30 yrs
- Air quality 1/10 Low 0 unhealthy d/yr today · 0 by 30 yrs out
Nearby sold comps map
Loading sold comps map…
Walkable amenities ~0.75 mi
Loading nearby amenities…
Taxation est. · year 1
- Rental income
- $21,548
- − Mortgage interest
- −$11,483
- − Property taxes
- −$3,888
- − Insurance
- −$1,025
- − Repairs & maintenance
- −$1,724
- − Management
- −$1,724
- − Depreciation
- −$5,964
- Taxable loss
- −$4,260
- Est. tax savings @ 24.0%
- +$1,022
- After-tax cash flow
- $231/yr
For passive investors: Depreciation is non-cash, so a rental often shows a tax loss while cash-flowing — sheltering income. Rental losses are passive: they offset passive income freely, and up to $25,000/yr can offset ordinary (W-2) income if you actively participate and your MAGI is under $100k (phasing out to $0 by $150k); unused losses carry forward. On sale, claimed depreciation is recaptured at up to 25%, and gains may owe capital-gains tax (a 1031 exchange can defer both). Figures are a year-1 estimate at your 24.0% rate — not tax advice; consult a CPA.
Schools (NCES district)
- District
- Brevard
- NCES district ID
- 1200150
- Math proficiency
- 53% ▼ -9.00%
- Reading proficiency
- 57% ▼ -4.00%
- Median HH income
- $49,426
- Composite
- 46.86/100
- National rank
- #2370
- State rank
- #19 of 73 in FL
Livability — Micco
- Score
- 65/100
- State rank
- #633
- US rank
- #12408
Category grades
Schools grade is shown separately in the Schools card above.
Census & demographics
- Census place
- Micco, FL
- Population (ZIP)
- 9,237
Population outlook (Brevard County) Hauer SSP2
- Today (2025)
- 623,254 people
- By 2030
- 648,420 · +4.0%
- By 2040
- 690,009 · +10.7%
- By 2050
- 715,669 · +14.8%
- By 2075
- 775,744 · +24.5%
- By 2100
- 776,687 · +24.6%
Race, ethnicity, and origin ACS 2023
- Neighborhood character
- Predominantly White (93%)
- Race & ethnicity
- White 93% Hispanic / Latino 4% Two or more races 1% Asian 1%
- Common ancestry
- Lithuanian 5% Romanian 4% Iranian 2%
- Foreign-born
- 4% · Canada, Jamaica
- Languages at home
- 95% English-only · Spanish 3%
Political lean MEDSL · Brevard
- 2024 margin
- Strong R (+20.8) · D 39.1% · R 59.9% · Other 1.0%
- 2008→2024 swing
- -10.4pp toward R · 2008: -10.4pp · 2024: -20.8pp
- All cycles
- 2024: R+20.8 2020: R+16.4 2016: R+19.8 2012: R+12.7 2008: R+10.4
Not yet ingested
- Civics
- —
Market trends
- HPI YoY
- ▼ -73.57%
- Current HPI
- 321.5196
- Rent YoY
- —
- Metro
- —
- State GDP YoY
- ▲ 3.28%
- F500 in state
- 36
Industry mix (Fortune 500 HQ in FL)
| Industry | F500 HQs | Revenue |
|---|---|---|
| Industrial Technology | 2 | $29B |
|
||
| Insurance | 2 | $17B |
|
||
| Retail | 1 | $60B |
|
||
| Technology Distribution | 1 | $58B |
|
||
| Homebuilding | 1 | $35B |
|
||
| Technology Manufacturing | 1 | $35B |
|
||
Price history
+658.1% since first listed11 events — show timeline
- 2026-03-03 Price Changed $235,000 SCMLS
- 2026-02-21 Listed $234,900 SCMLS
- 2015-04-03 Sold (Public Records) $110,000 Public Records
- 2015-03-31 Sold (MLS) $110,000 RAIRCMLS
- 2015-03-31 Sold (MLS) $110,000 SCMLS
- 2015-01-15 Listing Removed — Beaches MLS
- 2014-10-13 Listed $119,900 Beaches MLS
- 2014-10-02 Listed $119,900 SCMLS
- 1986-12-01 Sold (Public Records) $40,300 Public Records
- 1980-01-01 Sold (Public Records) $41,500 Public Records
- 1978-04-01 Sold (Public Records) $31,000 Public Records
Property tax history
+19.1%/yrLatest (2025): $3,888 · +1.8% YoY. Source: county tax records.
Cash-flow waterfall
monthlySold comps — $/sqft
last 12 mo · ≤1 miLoading sold comps…