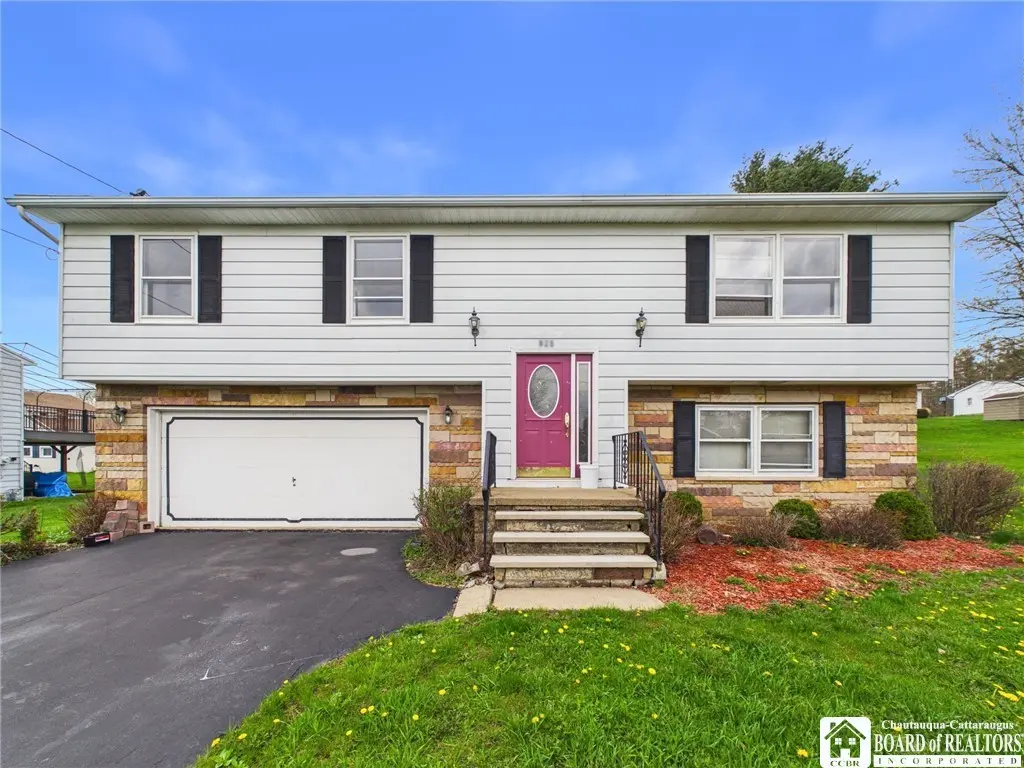
925 Forness Ave · Olean, NY
Flood risk 1/10 · Minimal
- FEMA flood zone
- X
- Chance of flooding over 30 yrs
- 0.0%
- Est. flood insurance / yr
- $473 – $860
Fire risk 2/10 · Minimal
- Est. fire insurance / yr
- $691 – $1,283
Heat risk 2/10 · Minimal
- Hot days now (above 90°F)
- 8 days/yr
- Hot days in 30 yrs
- 18 days/yr
Wind risk 1/10 · Minimal
- Chance of severe wind over 30 yrs
- —
Air-quality risk 1/10 · Minimal
- Unhealthy air days now
- 0 days/yr
- Unhealthy air days in 30 yrs
- 0 days/yr
Risk factors via First Street. Map © Google.
Why this score? — see what drove the D+ grade
The composite is a weighted blend of 9 inputs, each scored 0–100. Each bar is that input's sub-score; the figure is the points it added to the 100-point composite (weight × sub-score).
- ARV discount +15.0/15.0
- Cash flow +11.4/30.0
- 1% rule +4.2/10.0
- Livability +3.6/5.0
- Schools +3.5/10.0
- DSCR +3.3/10.0
- Rent growth +2.5/5.0
- Condition / age +2.5/5.0
- Appreciation +0.0/10.0
$149,900
🖨 Deal sheet (PDF) 📄 Offer letter ✓ Due diligence
Listing remarks
Opportunity Knocks on Forness Ave — A Solid Split-Level with Serious Potential. Don't miss your chance to own this spacious split-level home in one of Olean's most sought-after locations — a spot that's genuinely tough to find on the market. With strong bones, a great layout, and some of the most desirable features buyers are looking for, this property is ready for someone with a vision to make it shine. The upper level offers three well-proportioned bedrooms, while the lower level presents a versatile fourth room that works perfectly as an additional bedroom, home office, or flex space — whatever fits your lifestyle. Central air conditioning keeps things comfortable all s
Key facts
- Split-level
- 0.38 acre lot
- 2 garage spots
Tags
Property features AI
Exterior
- Parking: Attached garage with garage door opener; Underground garage access; Two garage spaces
- Utilities: Public water connected; Sewer connected; Cable available; High-speed Internet available; Circuit breaker electric
- Home design: Single-story property; Existing construction
- Construction: Aluminum siding; Block foundation; Partially finished walk-out basement; Below-grade finished area
- Exterior features: Blacktop driveway; Deck; Rectangular residential lot; City street frontage
Interior
- Kitchen: Dishwasher; Electric oven; Electric range; Microwave; Refrigerator
- Bedrooms: Three main-level bedrooms
- Flooring: Carpet; Luxury vinyl; Varies
- Bathrooms: One full bathroom; One half bathroom; One main-level bathroom
- Heating & cooling: Gas forced-air heating; Central air conditioning
- Interior features: Separate/formal dining room; Entrance foyer; Sliding glass doors; Bedroom on main level; Primary bedroom with private bath
- Laundry & utility: Laundry in basement; Gas water heater
Neighborhood map
What this means for you Summary
Snapshot
- This is a 3-bed/1.5-bath single-family listed at $150k.
Deal economics
- At list price, monthly cash flow is $-53 ($-633/yr) — negative.
- To cash-flow at today's rent, offer at most $141k (6.2% below list).
- To meet the 1% rule (rent ≥ 1% of price), the offer needs to be $139k (7.5% below list).
- Recommended offer: $139k (7.5% below list) — sets the bar for 1% rule.
- Cap rate 5.9% vs local median 8.1% in Olean — below-typical yield; the buyer is paying a premium for something (appreciation thesis, condition, location) that the cap rate doesn't capture.
Location & tenants
- Location reads 72/100 on livability (#353 in NY) — a middle-class / working-renter tenant base. Strengths: cost of living A+, housing A+, health & safety A+; Watch: crime F, amenities F, commute F.
- Olean City School District (town): math 40% / reading 43% proficiency, ranked #511 of 590 in NY (top 87%) — families likely to look elsewhere, expect single-tenant / working-renter base with shorter leases.
- Zoned schools: East View Elementary School (math 44% / reading 54%, grade D, #1,085 of 2,108 statewide, top 56%, 337 students, 49% FRL); Olean Intermediate-Middle School (math 23% / reading 36%, 564 students, 58% FRL); Olean Senior High School (math 77% / reading 67%, grade B+, #677 of 1,100 statewide, top 63%, 659 students, 49% FRL).
- Market conditions: 143 active listings in the ZIP; 128 units permitted in Cattaraugus County in 2024 (21 in 5+ unit buildings).
Forward outlook
- Local home prices are declining (-3.0%/yr); year-one equity from $1k of loan paydown is wiped out by about $4k of value loss. Plan a longer hold.
- Cattaraugus County population projected at -28% by 2050 — secular population decline; favor cash flow + early exit over multi-decade hold.
Negotiation context
- Only 7 days on market — expect competitive offers; lowballing is unlikely to land.
Questions for the listing agent
- What do current leases actually rent for vs. the listed asking? Can we see a recent rent roll and the last 12 months of T-12 income?
- Built in 1972 — when were the roof, HVAC, electrical panel, plumbing, and water heater last replaced?
- Is there a deadline driving the sale (1031 exchange, divorce, estate, relocation)? That informs how much negotiation room exists.
- Schools are B-rated — typically a magnet for longer-tenancy family renters. What's the average tenant stay here, and is there a school-zone premium baked into asking?
- Crime grade is F in this area — have there been break-ins, vandalism, or insurance claims at this property in the last 3 years? What carrier currently insures it and at what premium?
- The area grade is low — what's the realistic commute time and amenity access for the typical tenant pool here? Any planned neighborhood developments (good or bad) we should know about?
- What's the average days-on-market for RENTAL listings here right now (not sales)? A rising rental-DOM trend means longer vacancies and softer asking-rent achievability than the comps imply.
- What's the recent tenant-quality profile in this submarket — average credit score on applications, eviction rate, late-payment / NSF rate, and stable-employment percentage? A property-management company in the area should have these aggregated.
- How much new for-sale + rental construction is in the pipeline within 1–3 miles? Heavy new supply typically softens prices + rents 12–24 months out; constrained supply supports both.
Investment metrics
- 1% rule
- 0.92% ✗
- Cap rate
- 5.87%
- Cash-on-cash
- -1.51%
- DSCR
- 0.93
- GRM
- 9.0
CMA / ARV
- ARV (on-the-fly)
- $204,010
- Comps found
- 11
Show comp detail 11 sales within ~0.75 mi
| Address | Dist | Beds/Ba | Sqft | Sold | Price | $/sf | Match |
|---|---|---|---|---|---|---|---|
| 611 Gulf St | 0.10mi | 3/2.5 | 1,664 (-6%) | 2mo | $275,000 | $165 | 79 |
| 935 Forness Ave | 0.02mi | 3/1.5 | 1,920 (+8%) | 13mo | $200,000 | $104 | 74 |
| 1005 King St | 0.21mi | 2/2.5 (-1) | 1,716 (-3%) | 13mo | $190,900 | $111 | 65 |
| 935 Queen St | 0.33mi | 4/2.5 (+1) | 1,956 (+10%) | 2mo | $240,000 | $123 | 57 |
| 944 Kingston Dr | 0.25mi | 3/1.5 | 1,614 (-9%) | 20mo | $185,000 | $115 | 57 |
| 1315 Seneca Ave | 0.49mi | 4/2.0 (+1) | 1,668 (-6%) | 12mo | $160,000 | $96 | 50 |
| 524 King St | 0.20mi | 4/1.5 (+1) | 1,510 (-15%) | 16mo | $165,000 | $109 | 47 |
| 1240 Brook St | 0.35mi | 4/2.5 (+1) | 1,645 (-7%) | 24mo | $285,000 | $173 | 43 |
| 1698 Park Avenue Ave | 0.45mi | 3/2.5 | 1,568 (-12%) | 21mo | $279,900 | $179 | 38 |
| 1978 Layfield | 0.52mi | 2/2.0 (-1) | 1,552 (-12%) | 19mo | $220,000 | $142 | 32 |
| 118 King St | 0.50mi | 4/1.0 (+1) | 1,540 (-13%) | 21mo | $49,000 | $32 | 30 |
Match score weights: distance 35% · size 25% · config 20% · recency 20%. Top-matched comps best support the ARV.
Projected returns pro-forma
-3.0% appreciation · 3.0% rent growth · sell at horizon
- IRR
- -18.7%
- Equity multiple
- 0.34×
- Total profit
- $-27,562
- Equity at exit
- $22,351
- IRR
- -11.0%
- Equity multiple
- 0.33×
- Total profit
- $-27,964
- Equity at exit
- $12,961
Cash invested: $41,972 (down + closing). Projections, not guarantees.
Landlord ↔ Tenant lean methodology
- Overall (STATE)
- 15 Strongly Tenant-Friendly
- State New York
- 15 Strongly Tenant-Friendly · D+10
- County
- — inherits STATE
- City
- — inherits STATE
ZIP-level market 14760
- Home prices YoY
- -7.7%
- Active inventory
- 143
- Price-to-rent
- 9.0×
Monthly cashflow live
- Estimated rent
- $1,386 medium interval (Pro) →
- Mortgage (P&I)
- −$786
- Tax from tax record
- −$300 /mo · $3,594/yr
- Insurance
- −$62
- HOA
- −$0
- Vacancy / Maint / Mgmt
- −$291
- Net cashflow
- $-53
Break-even live
Sensitivity live
| Price | -10% $32 | -5% $-10 | +0% $-53 | +5% $-95 | +10% $-138 |
|---|---|---|---|---|---|
| Rent | -10% $-162 | -5% $-108 | +0% $-53 | +5% $2 | +10% $57 |
| Rate | -1.0pp $23 | -0.5pp $-15 | base $-53 | +0.5pp $-92 | +1.0pp $-131 |
UW: 25.0% down · 7.5% · 30yr · 1.5% tax · 5.0% vac · 8.0% maint · 8.0% mgmt
Financing live
Cash to close
- Down payment
- $37,475
- Closing costs
- $4,497
- Reserves months
- —
- Total cash needed
- —
Loan-product check · same deal, 3 products live
Conventional
25% down · 7.5% · 30yr
- Down + closing
- —
- Monthly P&I
- —
- Monthly cashflow
- —
- DSCR
- —
- Eligible?
- —
Personal DTI + credit; lowest rate.
DSCR
20% down · 8.5% · 30yr
- Down + closing
- —
- Monthly P&I
- —
- Monthly cashflow
- —
- DSCR
- —
- Eligible?
- —
No personal income docs; deal must DSCR.
Hard money
10% down · 12.0% · 12mo
- Down + closing
- —
- Monthly P&I
- —
- Monthly cashflow
- —
- DSCR
- —
- Eligible?
- —
Short-term bridge; refi at stabilization.
Listing history 1 events
-
2026-05-20$149,900 Active
ⓘ Source: listings_history table (triggers on properties + properties_extension) + one-shot
backfill from property_details.listing_events for pre-trigger history.
Tax reassessment forecast NY · Partial reset (capped growth)
- Current annual tax
- $3,594 · $300/mo
- Projected year-2 tax
- $3,594 · $300/mo
- Expected delta
- $0/yr ($0/mo · 0.0%)
ⓘ Screening estimate from a state-policy table — verify with the county assessor before closing.
Climate risk First Street
- Flood 1/10 Low FEMA zone X · 0% chance over 30 yrs
- Wildfire 2/10 Low
- Heat 2/10 Low 8 d/yr ≥90°F today · 18 d/yr by 30 yrs out
- Wind 1/10 Low
- Air quality 1/10 Low 0 unhealthy d/yr today · 0 by 30 yrs out
Nearby sold comps map
Loading sold comps map…
Walkable amenities ~0.75 mi
Loading nearby amenities…
Taxation est. · year 1
- Rental income
- $16,637
- − Mortgage interest
- −$8,397
- − Property taxes
- −$3,594
- − Insurance
- −$750
- − Repairs & maintenance
- −$1,331
- − Management
- −$1,331
- − Depreciation
- −$4,361
- Taxable loss
- −$3,126
- Est. tax savings @ 24.0%
- +$750
- After-tax cash flow
- $117/yr
For passive investors: Depreciation is non-cash, so a rental often shows a tax loss while cash-flowing — sheltering income. Rental losses are passive: they offset passive income freely, and up to $25,000/yr can offset ordinary (W-2) income if you actively participate and your MAGI is under $100k (phasing out to $0 by $150k); unused losses carry forward. On sale, claimed depreciation is recaptured at up to 25%, and gains may owe capital-gains tax (a 1031 exchange can defer both). Figures are a year-1 estimate at your 24.0% rate — not tax advice; consult a CPA.
Schools (NCES district)
- District
- Olean City School District
- NCES district ID
- 3621720
- Math proficiency
- 40% ▼ -10.00%
- Reading proficiency
- 43% ▼ -3.00%
- Median HH income
- $40,365
- Composite
- 34.81/100
- National rank
- #5104
- State rank
- #511 of 590 in NY
Livability — Olean
- Score
- 72/100
- State rank
- #353
- US rank
- #5930
Category grades
Schools grade is shown separately in the Schools card above.
Census & demographics
- Census place
- Olean, NY
- City population
- 17,272
- Population (ZIP)
- 17,272
Population outlook (Cattaraugus County) Hauer SSP2
- Today (2025)
- 71,623 people
- By 2030
- 67,751 · -5.4%
- By 2040
- 59,488 · -16.9%
- By 2050
- 51,601 · -28.0%
- By 2075
- 35,025 · -51.1%
- By 2100
- 21,243 · -70.3%
Race, ethnicity, and origin ACS 2023
- Neighborhood character
- Predominantly White (89%)
- Race & ethnicity
- White 89% Two or more races 5% Black 2% Asian 2% Hispanic / Latino 1%
- Common ancestry
- Romanian 10% Iranian 2% Lithuanian 1%
- Foreign-born
- 3% · Canada
- Languages at home
- 97% English-only · Other Indo-European 1%
Political lean MEDSL · Cattaraugus
- 2024 margin
- Solid R (+32.8) · D 33.6% · R 66.4%
- 2008→2024 swing
- -22.2pp toward R · 2008: -10.6pp · 2024: -32.8pp
- All cycles
- 2024: R+32.8 2020: R+29.5 2016: R+34.4 2012: R+13.4 2008: R+10.6
Not yet ingested
- Civics
- —
Market trends
- HPI YoY
- ▼ -19.85%
- Current HPI
- 237.327
- Rent YoY
- —
- Metro
- —
- State GDP YoY
- ▲ 2.60%
- F500 in state
- 92
Industry mix (Fortune 500 HQ in NY)
| Industry | F500 HQs | Revenue |
|---|---|---|
| Financial Services | 10 | $950B |
|
||
| Consumer Goods | 9 | $162B |
|
||
| Insurance | 4 | $225B |
|
||
| Telecommunications | 2 | $144B |
|
||
| Pharmaceuticals | 2 | $112B |
|
||
| Media / Entertainment | 2 | $69B |
|
||
Price history
1 event — show timeline
- 2026-05-20 Listed $149,900 UNYREIS
Property tax history
+2.1%/yrLatest (2025): $3,594 · -38.9% YoY. Source: county tax records.
Cash-flow waterfall
monthlySold comps — $/sqft
last 12 mo · ≤1 miLoading sold comps…