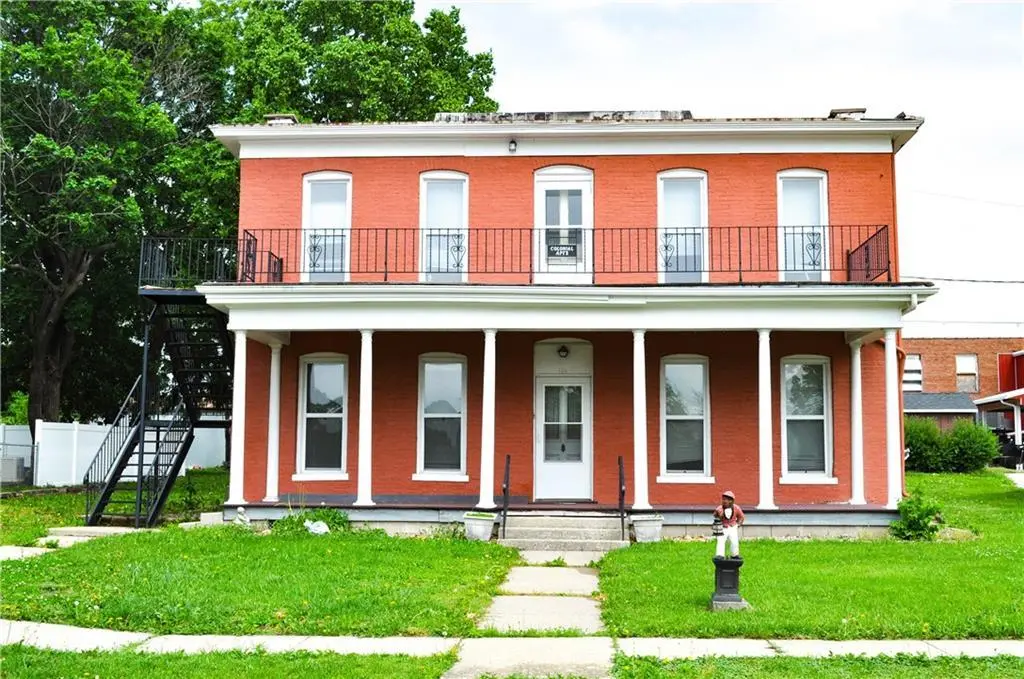
106 Prospect St · King City, MO
Flood risk 1/10 · Minimal
- FEMA flood zone
- X (unshaded)
- Chance of flooding over 30 yrs
- 0.0%
- Est. flood insurance / yr
- $507 – $1,088
Fire risk 3/10 · Minor
- Est. fire insurance / yr
- $1,054 – $1,958
Heat risk 4/10 · Minor
- Hot days now (above 105°F)
- 7 days/yr
- Hot days in 30 yrs
- 15 days/yr
Wind risk 2/10 · Minimal
- Chance of severe wind over 30 yrs
- —
Air-quality risk 3/10 · Minor
- Unhealthy air days now
- 2 days/yr
- Unhealthy air days in 30 yrs
- 3 days/yr
Risk factors via First Street. Map © Google.
Why this score? — see what drove the B grade
The composite is a weighted blend of 9 inputs, each scored 0–100. Each bar is that input's sub-score; the figure is the points it added to the 100-point composite (weight × sub-score).
- Cash flow +28.9/30.0
- DSCR +10.0/10.0
- ARV discount +7.5/15.0
- 1% rule +7.4/10.0
- Appreciation +5.0/10.0
- Schools +4.2/10.0
- Livability +3.0/5.0
- Rent growth +2.5/5.0
- Condition / age +2.5/5.0
$109,900
🖨 Deal sheet 📄 Offer letter ✓ Due diligence
Listing remarks
Historic Duplex in King City, MO! Discover a rare gem in the heart of King City with this beautiful historic duplex, dating back to the 1880s. This property not only embodies the charm and character of a past era but also presents an exciting opportunity for anyone seeking an investment venture. Property Features: Spacious Design: The building consists of two apartments: * Lower Unit: This inviting space includes 2 bedrooms and 1.5 bathrooms, ideal for anyone seeking comfort and convenience. * Upper Unit: Featuring 2 bedrooms and 2 bathrooms, this apartment also features a charming balcony, perfect for enjoying sunsets and outdoor relaxation. * Rich Historical Significance * * :
Key facts
- Strong rental market
- Historic duplex
- Prime location
Tags
Property features AI
Finance
- Other: Lot size approximately 0.26 acres; Directions: From the intersection of 169 Hwy and Vermont Street go west 1 block to Prospect St, turn north; property is on the east side of the road.
- Financial info: Annual tax information available
- HOA & community: No association fees
Exterior
- Parking: Off-street parking; Other parking
- Utilities: Public water; Public sewer
- Home design: Residential property; Other subtype; 2-story layout; Approximately 2,058 above-grade finished area
- Construction: Brick construction; Tar/gravel roof; Crawl space foundation; Property is over 100 years old
- Exterior features: Not in a flood plain
Interior
- Kitchen: Eat-in kitchen
- Bedrooms: 4 bedrooms
- Bathrooms: 3 full bathrooms; 1 half bathroom
- Heating & cooling: Baseboard heating; Propane heating; Electric cooling; Window unit(s)
- Interior features: Eat-in kitchen; Crawl space basement
- Laundry & utility: Dryer hookup (electric)
Neighborhood map
What this means for you Summary
Snapshot
- This is a 4-bed/3.0-bath other listed at $110k.
Deal economics
- At list price, monthly cash flow is $371 ($4k/yr) — positive.
- The deal already cash-flows at list — no discount required.
- Meets the 1% rule at list price ($1k rent vs $110k).
Location & tenants
- Location reads 60/100 on livability (#510 in MO) — a middle-class / working-renter tenant base. Strengths: cost of living A+, housing A+; Watch: crime F, amenities F, commute F.
- King City R-I (rural): math 45% / reading 50% proficiency, ranked #157 of 535 in MO (top 29%) — families likely to look elsewhere, expect single-tenant / working-renter base with shorter leases.
- Market conditions: 12 active listings in the ZIP; 3 units permitted in Gentry County in 2024 (0 in 5+ unit buildings).
Forward outlook
- In year one you build about $761 of equity ($760 loan paydown + $1 appreciation (0.0% local appreciation)).
- At projected returns (0.0% appreciation + 3.0% rent growth), your $31k cash investment doubles in ~6 years — after that, you're playing with house money.
Negotiation context
- Only 1 days on market — expect competitive offers; lowballing is unlikely to land.
Risks & watch-outs
- Watch-outs: built in 1900 — expect roof / HVAC / electrical / plumbing capex.
Questions for the listing agent
- Built in 1900 — when were the roof, HVAC, electrical panel, plumbing, and water heater last replaced?
- Is there a deadline driving the sale (1031 exchange, divorce, estate, relocation)? That informs how much negotiation room exists.
- Crime grade is F in this area — have there been break-ins, vandalism, or insurance claims at this property in the last 3 years? What carrier currently insures it and at what premium?
- What's the average days-on-market for RENTAL listings here right now (not sales)? A rising rental-DOM trend means longer vacancies and softer asking-rent achievability than the comps imply.
- What's the recent tenant-quality profile in this submarket — average credit score on applications, eviction rate, late-payment / NSF rate, and stable-employment percentage? A property-management company in the area should have these aggregated.
- How much new for-sale + rental construction is in the pipeline within 1–3 miles? Heavy new supply typically softens prices + rents 12–24 months out; constrained supply supports both.
Investment metrics
- 1% rule
- 1.24% ✓
- Cap rate
- 10.35%
- Cash-on-cash
- 14.48%
- DSCR
- 1.64
- GRM
- 6.7
CMA / ARV
No comps found within radius.
Projected returns pro-forma
0.0% appreciation · 3.0% rent growth · sell at horizon
- IRR
- 13.8%
- Equity multiple
- 1.66×
- Total profit
- $20,416
- Equity at exit
- $31,916
- IRR
- 18.5%
- Equity multiple
- 3.03×
- Total profit
- $62,584
- Equity at exit
- $38,368
Cash invested: $30,772 (down + closing). Projections, not guarantees.
Landlord ↔ Tenant lean methodology
- Overall (STATE)
- 81 Strongly Landlord-Friendly
- State Missouri
- 81 Strongly Landlord-Friendly · R+10
- County
- — inherits STATE
- City
- — inherits STATE
ZIP-level market 64463
- Home prices YoY
- 0.0%
- Active inventory
- 12
- Price-to-rent
- 6.7×
Monthly cashflow live
- Estimated rent
- $1,359 medium interval (Pro) →
- Mortgage (P&I)
- −$576
- Tax from tax record
- −$80 /mo · $966/yr
- Insurance
- −$46
- HOA
- −$0
- Vacancy / Maint / Mgmt
- −$285
- Net cashflow
- $371
Break-even live
UW: 25.0% down · 7.5% · 30yr · 1.5% tax · 5.0% vac · 8.0% maint · 8.0% mgmt
Financing live
Cash to close
- Down payment
- $27,475
- Closing costs
- $3,297
- Reserves months
- —
- Total cash needed
- —
Loan-product check · same deal, 3 products live
Conventional
25% down · 7.5% · 30yr
- Down + closing
- —
- Monthly P&I
- —
- Monthly cashflow
- —
- DSCR
- —
- Eligible?
- —
Personal DTI + credit; lowest rate.
DSCR
20% down · 8.5% · 30yr
- Down + closing
- —
- Monthly P&I
- —
- Monthly cashflow
- —
- DSCR
- —
- Eligible?
- —
No personal income docs; deal must DSCR.
Hard money
10% down · 12.0% · 12mo
- Down + closing
- —
- Monthly P&I
- —
- Monthly cashflow
- —
- DSCR
- —
- Eligible?
- —
Short-term bridge; refi at stabilization.
Listing history 1 events
-
2026-05-22$109,900 Active
ⓘ Source: listings_history table (triggers on properties + properties_extension) + one-shot
backfill from property_details.listing_events for pre-trigger history.
Tax reassessment forecast MO · Resets to sale price
- Current annual tax
- $966 · $80/mo
- Projected year-2 tax
- $1,066 · $89/mo
- Expected delta
- +$100/yr (+$8/mo · 10.4%)
ⓘ Screening estimate from a state-policy table — verify with the county assessor before closing.
Climate risk First Street
- Flood 1/10 Low FEMA zone X (unshaded) · 0% chance over 30 yrs
- Wildfire 3/10 Moderate
- Heat 4/10 Moderate 7 d/yr ≥105°F today · 15 d/yr by 30 yrs out
- Wind 2/10 Low
- Air quality 3/10 Moderate 2 unhealthy d/yr today · 3 by 30 yrs out
Nearby sold comps map
Loading sold comps map…
Walkable amenities ~0.75 mi
Loading nearby amenities…
Taxation est. · year 1
- Rental income
- $16,311
- − Mortgage interest
- −$6,156
- − Property taxes
- −$966
- − Insurance
- −$550
- − Repairs & maintenance
- −$1,305
- − Management
- −$1,305
- − Depreciation
- −$3,197
- Taxable income
- $2,833
- Est. tax owed @ 24.0%
- −$680
- After-tax cash flow
- $3,775/yr
For passive investors: Depreciation is non-cash, so a rental often shows a tax loss while cash-flowing — sheltering income. Rental losses are passive: they offset passive income freely, and up to $25,000/yr can offset ordinary (W-2) income if you actively participate and your MAGI is under $100k (phasing out to $0 by $150k); unused losses carry forward. On sale, claimed depreciation is recaptured at up to 25%, and gains may owe capital-gains tax (a 1031 exchange can defer both). Figures are a year-1 estimate at your 24.0% rate — not tax advice; consult a CPA.
Schools (NCES district)
- District
- King City R-I
- NCES district ID
- 2916590
- Math proficiency
- 45% ▲ 5.00%
- Reading proficiency
- 50% ▬ 0.00%
- Median HH income
- $43,836
- Composite
- 42.23/100
- National rank
- #6995
- State rank
- #157 of 535 in MO
Livability — King City
- Score
- 60/100
- State rank
- #510
- US rank
- #19525
Category grades
Schools grade is shown separately in the Schools card above.
Census & demographics
- Census place
- King City, MO
- Population (ZIP)
- 1,239
Population outlook (Gentry County) Hauer SSP2
- Today (2025)
- 6,612 people
- By 2030
- 6,572 · -0.6%
- By 2040
- 6,521 · -1.4%
- By 2050
- 6,457 · -2.3%
- By 2075
- 6,346 · -4.0%
- By 2100
- 6,036 · -8.7%
Race, ethnicity, and origin ACS 2023
- Neighborhood character
- Predominantly White (95%)
- Race & ethnicity
- White 95% Asian 2% Two or more races 2% Hispanic / Latino 1%
- Common ancestry
- Lithuanian 2% Italian 2% Iranian 1%
- Foreign-born
- 2% · China
Political lean MEDSL · Gentry
- 2024 margin
- Solid R (+61.8) · D 18.7% · R 80.5%
- 2008→2024 swing
- -39.7pp toward R · 2008: -22.1pp · 2024: -61.8pp
- All cycles
- 2024: R+61.8 2020: R+60.8 2016: R+56.0 2012: R+35.0 2008: R+22.1
Not yet ingested
- Civics
- —
Market trends
- HPI YoY
- ▬ 0.00%
- Current HPI
- 176.4826
- Rent YoY
- —
- Metro
- —
- State GDP YoY
- ▲ 1.84%
- F500 in state
- 20
Industry mix (Fortune 500 HQ in MO)
| Industry | F500 HQs | Revenue |
|---|---|---|
| Healthcare | 1 | $163B |
|
||
| Insurance | 1 | $21B |
|
||
| Industrial Technology | 1 | $17B |
|
||
| Retail | 1 | $16B |
|
||
| Industrial Distribution | 1 | $10B |
|
||
| Utilities | 1 | $9B |
|
||
Price history
1 event — show timeline
- 2026-05-22 Listed $109,900 Heartland MLS as Distributed by MLS Grid
Property tax history
+1.7%/yrLatest (2025): $966 · +11.5% YoY. Source: county tax records.
Cash-flow waterfall
monthlySold comps — $/sqft
last 12 mo · ≤1 miLoading sold comps…