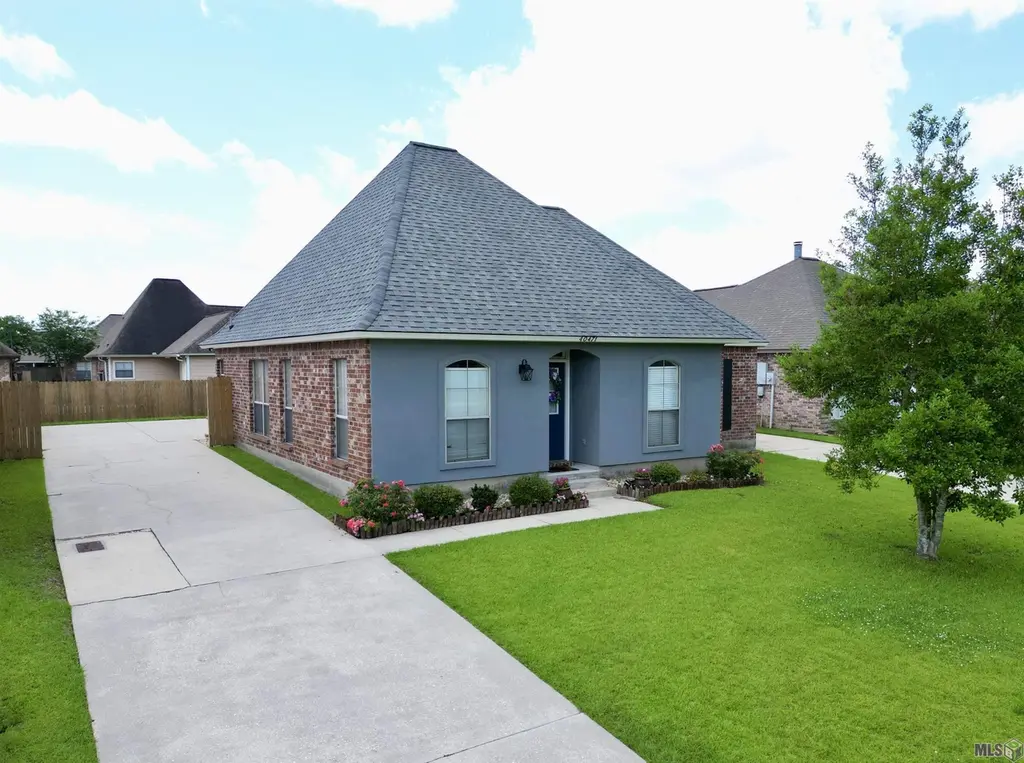
40471 Cross Creek Ave · Prairieville, LA
Flood risk 1/10 · Minimal
- FEMA flood zone
- X
- Chance of flooding over 30 yrs
- 0.0%
- Est. flood insurance / yr
- $507 – $1,088
Fire risk 1/10 · Minimal
- Est. fire insurance / yr
- $1,269 – $2,357
Heat risk 8/10 · Major
- Hot days now (above 108°F)
- 7 days/yr
- Hot days in 30 yrs
- 22 days/yr
Wind risk 9/10 · Severe
- Chance of severe wind over 30 yrs
- 99.0%
Air-quality risk 2/10 · Minimal
- Unhealthy air days now
- 2 days/yr
- Unhealthy air days in 30 yrs
- 2 days/yr
Risk factors via First Street. Map © Google.
Why this score? — see what drove the D grade
The composite is a weighted blend of 9 inputs, each scored 0–100. Each bar is that input's sub-score; the figure is the points it added to the 100-point composite (weight × sub-score).
- Cash flow +13.1/30.0
- ARV discount +7.6/15.0
- Schools +4.7/10.0
- DSCR +3.9/10.0
- Livability +3.5/5.0
- Rent growth +3.3/5.0
- 1% rule +3.0/10.0
- Condition / age +2.5/5.0
- Appreciation +0.0/10.0
$249,900
🖨 Deal sheet (PDF) 📄 Offer letter ✓ Due diligence
Listing remarks MLS
Spacious 3-bedroom, 2-bathroom home featuring an open-concept floor plan. The exterior offers a long driveway, and a carport for ample parking. The kitchen features extensive cabinet storage. The primary bedroom features a private, fully tiled en-suite bathroom. A second full bathroom includes a bathtub and standard fixtures. The property is situated in close proximity to area schools, parks, and shopping centers, including a grocery store.
Key facts
- 6,011 sq ft lot
- 2 parking spots
- Built 2006
Tags
Property features AI
Finance
- Other: Located in Cross Creek subdivision; directions available
- HOA & community: Homeowners association with an annual fee of $140 (about $11.67/month)
Exterior
- Parking: Carport; 2 carport spaces (2 total parking spaces)
- Utilities: Public water service; Public sewer service
- Home design: Detached single-family residence; Residential property
- Construction: Brick construction; Slab foundation; Built area approximately 1,407 sq ft
- Exterior features: Public water; Public sewer; Lot in Cross Creek subdivision; Lot dimensions approximately 55 x 110
Interior
- Bathrooms: 2 full bathrooms
- Interior features: Central heating; Central air conditioning
Neighborhood map
What this means for you Summary
Snapshot
- This is a 3-bed/2.0-bath single-family listed at $250k.
Deal economics
- At list price, monthly cash flow is $-10 ($-123/yr) — negative.
- To cash-flow at today's rent, offer at most $248k (0.7% below list).
- To meet the 1% rule (rent ≥ 1% of price), the offer needs to be $201k (19.6% below list).
- Recommended offer: $201k (19.6% below list) — sets the bar for 1% rule.
- Cap rate 6.2% vs local median 4.4% in Prairieville — top-decile yield for the area; either an underpriced asset or a hidden risk that comps aren't pricing in. Stress-test before assuming the spread holds.
Location & tenants
- Location reads 69/100 on livability (#70 in LA) — a middle-class / working-renter tenant base. Strengths: employment A+, housing A+, crime B+; Watch: amenities F, commute F, health & safety F.
- Ascension Parish (suburban): math 48% / reading 58% proficiency, ranked #7 of 98 in LA (top 7%) — acceptable for families but not a draw, mixed tenant base, ~2y average lease.
- Zoned schools: Central Primary School (math 48% / reading 52%, grade D+, #125 of 646 statewide, top 20%, 474 students, 55% FRL); Central Middle School (math 40% / reading 54%, grade D+, #37 of 218 statewide, top 18%, 747 students, 50% FRL); East Ascension High School (math 47% / reading 49%, grade D, #43 of 265 statewide, top 16%, 2,098 students, 55% FRL).
- Market conditions: Rents rising (+3.3%/yr); 571 active listings in the ZIP; 4 comparable units currently listed for rent nearby; rentals at typical pace (median 25d on market — plan ~3-4 weeks tenant-placement turnaround); solid renter incomes; 579 units permitted in Ascension Parish in 2024 (0 in 5+ unit buildings).
Forward outlook
- Local home prices are declining (-3.0%/yr); year-one equity from $2k of loan paydown is wiped out by about $7k of value loss. Plan a longer hold.
- Ascension County population projected at +43% by 2050 — long-run rental-demand tailwind backs the buy-and-hold thesis.
Negotiation context
- It's been on market 23 days — a 2% lower offer ($246k) is reasonable based on typical stale-listing flexibility.
- 14 sale attempts since 20y ago with the ask held roughly flat each time — persistent listings suggest the price (not the market) is what's stuck; bring a comps-based counter.
Risks & watch-outs
- Climate carrying-cost: severe wind risk, 99% chance of damaging wind over 30y; extreme-heat days projected 7→22/yr by 2055 (HVAC capex compounding) — expect insurance premiums to compound above CPI over the hold.
Questions for the listing agent
- What do current leases actually rent for vs. the listed asking? Can we see a recent rent roll and the last 12 months of T-12 income?
- What does the HOA fee cover, when was the last increase, and are there any pending special assessments or reserve-fund shortfalls?
- Is there a deadline driving the sale (1031 exchange, divorce, estate, relocation)? That informs how much negotiation room exists.
- Schools are A-rated — typically a magnet for longer-tenancy family renters. What's the average tenant stay here, and is there a school-zone premium baked into asking?
- The area grade is low — what's the realistic commute time and amenity access for the typical tenant pool here? Any planned neighborhood developments (good or bad) we should know about?
- What's the average days-on-market for RENTAL listings here right now (not sales)? A rising rental-DOM trend means longer vacancies and softer asking-rent achievability than the comps imply.
- What's the recent tenant-quality profile in this submarket — average credit score on applications, eviction rate, late-payment / NSF rate, and stable-employment percentage? A property-management company in the area should have these aggregated.
- How much new for-sale + rental construction is in the pipeline within 1–3 miles? Heavy new supply typically softens prices + rents 12–24 months out; constrained supply supports both.
Investment metrics
- 1% rule
- 0.80% ✗
- Cap rate
- 6.24%
- Cash-on-cash
- -0.18%
- DSCR
- 0.99
- GRM
- 10.4
CMA / ARV
- ARV (on-the-fly)
- $250,446
- Comps found
- 12
Show comp detail 12 sales within ~0.75 mi
| Address | Dist | Beds/Ba | Sqft | Sold | Price | $/sf | Match |
|---|---|---|---|---|---|---|---|
| 40462 Cross Creek Ave | 0.04mi | 3/2.0 | 1,404 (-0%) | 3mo | $249,900 | $178 | 96 |
| 40489 Cross Creek Ave | 0.03mi | 3/2.0 | 1,408 (+0%) | 7mo | $250,000 | $178 | 92 |
| 40435 Cross Ridge Ave | 0.09mi | 3/2.0 | 1,420 (+1%) | 3mo | $253,000 | $178 | 92 |
| 40445 Fox Run Dr | 0.11mi | 3/2.0 | 1,421 (+1%) | 2mo | $255,000 | $179 | 92 |
| 40414 Fox Run Dr | 0.14mi | 3/2.0 | 1,445 (+3%) | 2mo | $262,000 | $181 | 88 |
| 40428 Fox Run Dr | 0.11mi | 3/2.0 | 1,395 (-1%) | 7mo | $232,500 | $167 | 87 |
| 40363 Creekway Cove Ct | 0.23mi | 3/2.0 | 1,408 (+0%) | 4mo | $255,000 | $181 | 85 |
| 40330 Coldwater Landing Ave | 0.28mi | 3/2.0 | 1,404 (-0%) | 2mo | $175,000 | $125 | 85 |
| 40312 Crestridge Dr | 0.33mi | 3/2.0 | 1,408 (+0%) | 2mo | $250,000 | $178 | 83 |
| 40445 Sagefield Ct | 0.12mi | 3/2.0 | 1,321 (-6%) | 5mo | $190,000 | $144 | 80 |
| 14452 Tanya Dr | 0.33mi | 3/2.0 | 1,565 (+11%) | 3mo | $265,000 | $169 | 64 |
| 40167 Trace Ave | 0.56mi | 3/2.0 | 1,551 (+10%) | 7mo | $272,000 | $175 | 51 |
Match score weights: distance 35% · size 25% · config 20% · recency 20%. Top-matched comps best support the ARV.
Projected returns pro-forma
-3.0% appreciation · 3.26% rent growth · sell at horizon
- IRR
- -16.4%
- Equity multiple
- 0.42×
- Total profit
- $-40,671
- Equity at exit
- $37,261
- IRR
- -7.7%
- Equity multiple
- 0.51×
- Total profit
- $-34,285
- Equity at exit
- $21,607
Cash invested: $69,972 (down + closing). Projections, not guarantees.
Landlord ↔ Tenant lean methodology
- Overall (STATE)
- 90 Strongly Landlord-Friendly
- State Louisiana
- 90 Strongly Landlord-Friendly · R+12
- County
- — inherits STATE
- City
- — inherits STATE
ZIP-level market 70737
- Rents YoY
- 3.3%
- Active inventory
- 571
- Price-to-rent
- 10.4×
Monthly cashflow live
- Estimated rent
- $2,009 medium interval (Pro) →
- Mortgage (P&I)
- −$1,311
- Tax from tax record
- −$170 /mo · $2,045/yr
- Insurance
- −$104
- HOA
- −$12
- Vacancy / Maint / Mgmt
- −$422
- Net cashflow
- $-10
Break-even live
Sensitivity live
| Price | -10% $131 | -5% $60 | +0% $-10 | +5% $-81 | +10% $-152 |
|---|---|---|---|---|---|
| Rent | -10% $-169 | -5% $-90 | +0% $-10 | +5% $69 | +10% $148 |
| Rate | -1.0pp $116 | -0.5pp $53 | base $-10 | +0.5pp $-75 | +1.0pp $-141 |
UW: 25.0% down · 7.5% · 30yr · 1.5% tax · 5.0% vac · 8.0% maint · 8.0% mgmt
Financing live
Cash to close
- Down payment
- $62,475
- Closing costs
- $7,497
- Reserves months
- —
- Total cash needed
- —
Loan-product check · same deal, 3 products live
Conventional
25% down · 7.5% · 30yr
- Down + closing
- —
- Monthly P&I
- —
- Monthly cashflow
- —
- DSCR
- —
- Eligible?
- —
Personal DTI + credit; lowest rate.
DSCR
20% down · 8.5% · 30yr
- Down + closing
- —
- Monthly P&I
- —
- Monthly cashflow
- —
- DSCR
- —
- Eligible?
- —
No personal income docs; deal must DSCR.
Hard money
10% down · 12.0% · 12mo
- Down + closing
- —
- Monthly P&I
- —
- Monthly cashflow
- —
- DSCR
- —
- Eligible?
- —
Short-term bridge; refi at stabilization.
Rent comps 4 comps
| Address | Beds | Baths | Sqft | Rent | $/sqft | DOM | Units | Dist |
|---|---|---|---|---|---|---|---|---|
| 40300 Creek Bend Dr Gonzales, LA | 3.0 | 2.0 | 1381 | $2,000 | $1.45 | 16d | 1 | 0.32mi |
| 41437 Cozy Way Gonzales, LA | 3.0 | 2.0 | 1825 | $2,300 | $1.26 | 25d | 1 | 1.17mi |
| 14039 Young Rd Gonzales, LA | 2.0 | 1.5 | 1385 | $1,600 | $1.16 | 45d | 1 | 1.29mi |
| 14086 Airline Hwy Gonzales, LA | 1.0–3.0 | 1.0–2.0 | 1171 | $1,779 | $1.52 | 16d | 1 | 1.41mi |
HOA detail
- Monthly dues
- $12 · $144/yr
Listing history 17 events
-
2026-06-21days on market $249,900 Active 23 DOM
-
2026-06-18days on market $249,900 Active 20 DOM
-
2026-06-17days on market $249,900 Active 19 DOM
-
2026-06-16days on market $249,900 Active 18 DOM
-
2026-06-15days on market $249,900 Active 17 DOM
-
2026-06-14days on market $249,900 Active 15 DOM
-
2026-06-10days on market $249,900 Active 12 DOM
-
2026-06-09days on market $249,900 Active 11 DOM
-
2026-06-08days on market $249,900 Active 10 DOM
-
2026-06-07days on market $249,900 Active 9 DOM
-
2026-06-05days on market $249,900 Active 6 DOM
-
2026-06-03days on market $249,900 Active 5 DOM
-
2026-06-02days on market $249,900 Active 4 DOM
-
2026-06-01days on market $249,900 Active 3 DOM
-
2026-05-31days on market $249,900 Active 2 DOM
-
2026-05-31remarks 445-char remark
-
2026-05-31$249,900 Active 1 DOM
ⓘ Source: listings_history table (triggers on properties + properties_extension) + one-shot
backfill from property_details.listing_events for pre-trigger history.
Tax reassessment forecast LA · Resets to sale price
- Current annual tax
- $2,045 · $170/mo
- Projected year-2 tax
- $2,045 · $170/mo
- Expected delta
- $0/yr ($0/mo · 0.0%)
ⓘ Screening estimate from a state-policy table — verify with the county assessor before closing.
Climate risk First Street
- Flood 1/10 Low FEMA zone X · 0% chance over 30 yrs
- Wildfire 1/10 Low
- Heat 8/10 Severe 7 d/yr ≥108°F today · 22 d/yr by 30 yrs out
- Wind 9/10 Extreme 99% chance of damaging wind over 30 yrs
- Air quality 2/10 Low 2 unhealthy d/yr today · 2 by 30 yrs out
Nearby sold comps map
Loading sold comps map…
Walkable amenities ~0.75 mi
Loading nearby amenities…
Taxation est. · year 1
- Rental income
- $24,103
- − Mortgage interest
- −$13,998
- − Property taxes
- −$2,045
- − Insurance
- −$1,250
- − Repairs & maintenance
- −$1,928
- − Management
- −$1,928
- − HOA
- −$144
- − Depreciation
- −$7,270
- Taxable loss
- −$4,460
- Est. tax savings @ 24.0%
- +$1,070
- After-tax cash flow
- $947/yr
For passive investors: Depreciation is non-cash, so a rental often shows a tax loss while cash-flowing — sheltering income. Rental losses are passive: they offset passive income freely, and up to $25,000/yr can offset ordinary (W-2) income if you actively participate and your MAGI is under $100k (phasing out to $0 by $150k); unused losses carry forward. On sale, claimed depreciation is recaptured at up to 25%, and gains may owe capital-gains tax (a 1031 exchange can defer both). Figures are a year-1 estimate at your 24.0% rate — not tax advice; consult a CPA.
Schools (NCES district)
- District
- Ascension Parish
- NCES district ID
- 2200090
- Math proficiency
- 48% ▼ -31.00%
- Reading proficiency
- 58% ▼ -25.00%
- Median HH income
- $68,423
- Composite
- 47.0/100
- National rank
- #2347
- State rank
- #7 of 98 in LA
Livability — Prairieville
- Score
- 69/100
- State rank
- #70
- US rank
- #8507
Category grades
Schools grade is shown separately in the Schools card above.
Census & demographics
- County
- Ascension Parish · 98,362 people
- City population
- 49,278
- Metro
- Baton Rouge, LA
- Population (ZIP)
- 49,084
- Household income
- $82,521
- Rent vs Own
- Severe rent burden
- 863.0
Population outlook (Ascension County) Hauer SSP2
- Today (2025)
- 145,480 people
- By 2030
- 158,329 · +8.8%
- By 2040
- 183,741 · +26.3%
- By 2050
- 207,615 · +42.7%
- By 2075
- 260,244 · +78.9%
- By 2100
- 289,576 · +99.0%
Race, ethnicity, and origin ACS 2023
- Neighborhood character
- Diverse neighborhood (Simpson 0.57)
- Race & ethnicity
- White 59% Black 26% Hispanic / Latino 10% Two or more races 7%
- Hispanic origin (detail)
- Mexican 6%
- Common ancestry
- Lithuanian 15% Serbian 1% Slovak 1%
- Foreign-born
- 7% · Canada
- Languages at home
- 89% English-only · Spanish 9% French/Haitian/Cajun 1% Other Indo-European 1%
Political lean MEDSL · Ascension
- 2024 margin
- Solid R (+34.0) · D 32.2% · R 66.1% · Other 1.7%
- 2008→2024 swing
- +1.7pp toward D · 2008: -35.7pp · 2024: -34.0pp
- All cycles
- 2024: R+34.0 2020: R+32.5 2016: R+36.0 2012: R+34.3 2008: R+35.7
Not yet ingested
- Civics
- —
Market trends
- HPI YoY
- ▼ -89.49%
- Current HPI
- 145.3384
- Rent YoY
- ▲ 3.26%
- Metro
- Baton Rouge, LA
- State GDP YoY
- ▲ 3.29%
- F500 in state
- 10
Industry mix (Fortune 500 HQ in LA)
| Industry | F500 HQs | Revenue |
|---|---|---|
| Telecommunications | 2 | $23B |
|
||
| Utilities | 1 | $12B |
|
||
| Wholesale / Distribution | 1 | $5B |
|
||
| Advertising | 1 | $2B |
|
||
Price history
+87.2% since first listed27 events — show timeline
- 2026-05-29 Listed $249,900 GBRMLS
- 2026-05-29 Listed $249,900 AcadianaMLS
- 2022-10-05 Sold (Public Records) $225,000 Public Records
- 2022-09-30 Sold (MLS) — GBRMLS
- 2022-08-21 Contingent — GBRMLS
- 2022-08-19 Listed $225,000 AcadianaMLS
- 2022-08-19 Listed $225,000 GBRMLS
- 2018-04-05 Sold (Public Records) $180,000 Public Records
- 2018-04-05 Sold (MLS) — GBRMLS
- 2018-02-24 Pending — GBRMLS
- 2018-01-31 Listed $180,000 AcadianaMLS
- 2018-01-31 Listed $180,000 GBRMLS
- 2014-06-26 Sold (Public Records) $167,000 Public Records
- 2014-06-23 Sold (MLS) — GBRMLS
- 2014-05-04 Listed $168,500 GBRMLS
- 2014-05-04 Listed $168,500 AcadianaMLS
- 2011-08-18 Sold (Public Records) $149,000 Public Records
- 2011-08-08 Sold (MLS) — GBRMLS
- 2010-08-03 Listed $154,900 AcadianaMLS
- 2010-08-03 Listed $154,900 GBRMLS
- 2007-10-02 Sold (Public Records) $154,000 Public Records
- 2007-09-28 Sold (MLS) — GBRMLS
- 2007-08-02 Listed $152,900 GBRMLS
- 2007-08-02 Listed $152,900 AcadianaMLS
- 2006-11-02 Listed $160,000 AcadianaMLS
- 2006-11-02 Listed $160,000 GBRMLS
- 2006-03-18 Sold (Public Records) $133,515 Public Records
Property tax history
+2.7%/yrLatest (2025): $2,045 · -1.8% YoY. Source: county tax records.
Cash-flow waterfall
monthlySold comps — $/sqft
last 12 mo · ≤1 miLoading sold comps…