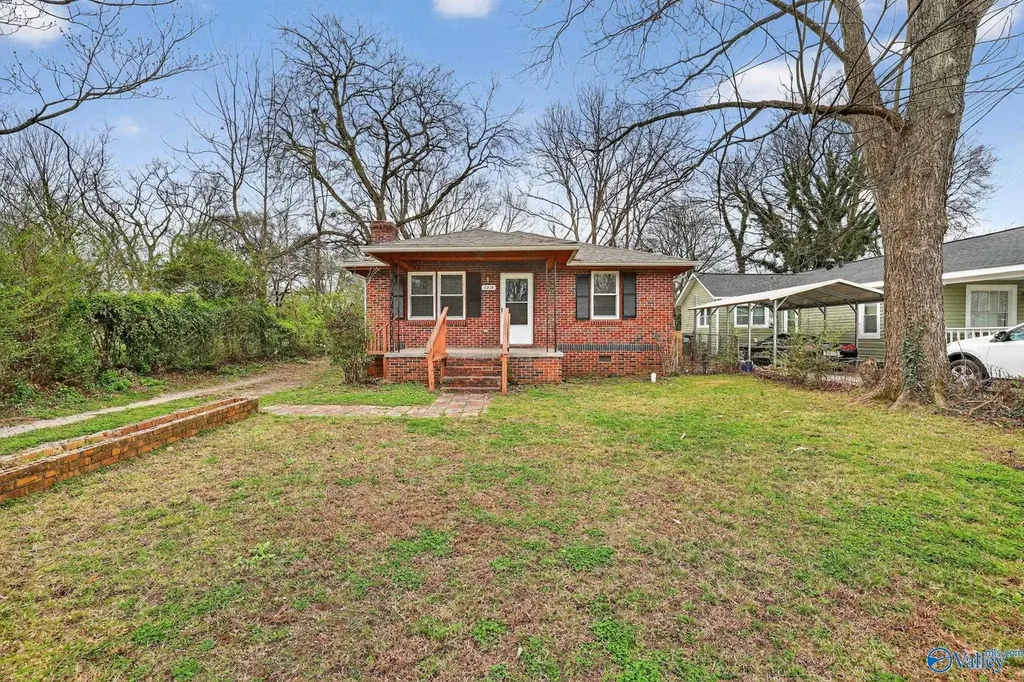
2214 Kildare St NW · Huntsville, AL
Flood risk 1/10 · Minimal
- FEMA flood zone
- X (unshaded)
- Chance of flooding over 30 yrs
- 0.0%
- Est. flood insurance / yr
- $507 – $1,088
Fire risk 3/10 · Minor
- Est. fire insurance / yr
- $916 – $1,700
Heat risk 6/10 · Moderate
- Hot days now (above 104°F)
- 7 days/yr
- Hot days in 30 yrs
- 19 days/yr
Wind risk 4/10 · Minor
- Chance of severe wind over 30 yrs
- 17.0%
Air-quality risk 2/10 · Minimal
- Unhealthy air days now
- 1 days/yr
- Unhealthy air days in 30 yrs
- 1 days/yr
Risk factors via First Street. Map © Google.
Why this score? — see what drove the C+ grade
The composite is a weighted blend of 9 inputs, each scored 0–100. Each bar is that input's sub-score; the figure is the points it added to the 100-point composite (weight × sub-score).
- Cash flow +22.9/30.0
- ARV discount +10.4/15.0
- DSCR +7.3/10.0
- 1% rule +5.3/10.0
- Rent growth +4.2/5.0
- Livability +4.1/5.0
- Schools +2.9/10.0
- Condition / age +2.5/5.0
- Appreciation +1.4/10.0
$144,900
🖨 Deal sheet 📄 Offer letter ✓ Due diligence
Listing remarks MLS
Charming brick 1-story home featuring 3 bedrooms and 1 bathroom with great curb appeal! Enjoy relaxing on the covered front porch overlooking the lovely yard. Inside, the home offers a large living room filled with natural light and finished in neutral colors, creating a warm and inviting atmosphere. The kitchen includes a refrigerator, range, and dishwasher and opens to the dining room—perfect for everyday living and entertaining. Laminate flooring runs through the main living areas, while the bedrooms are comfortably carpeted. The updated bathroom features a tile shower/tub combo and a classic pedestal sink. Step outside to a wonderful fenced yard offering plenty of space to relax, play, o
Key facts
- Covered front porch
- Fenced yard
- Large living room
Tags
Neighborhood map
What this means for you Summary
Snapshot
- This is a 3-bed/1.0-bath single-family listed at $145k.
Deal economics
- At list price, monthly cash flow is $254 ($3k/yr) — positive.
- The deal already cash-flows at list — no discount required.
- Meets the 1% rule at list price ($1k rent vs $145k).
- Recommended offer: $136k (6.0% below list) — sets the bar for market timing.
- Cap rate 8.4% vs local median 3.8% in Huntsville — top-decile yield for the area; either an underpriced asset or a hidden risk that comps aren't pricing in. Stress-test before assuming the spread holds.
Location & tenants
- Location reads 82/100 on livability (#3 in AL, #1,082 nationally) — a professional / high-income tenant draw. Strengths: commute A+, cost of living A+, housing A+; Watch: crime F.
- Huntsville City (urban): math 21% / reading 46% proficiency, ranked #48 of 129 in AL (top 37%) — families likely to look elsewhere, expect single-tenant / working-renter base with shorter leases.
- Market conditions: Rents rising fast (+6.8%/yr); 560 active listings in the ZIP; 40 comparable units currently listed for rent nearby; rentals lingering (median 44d on market — plan ~5-8 weeks vacancy on turnover, expect pricing pressure); 58% of comp listings sitting > 30 days — soft ceiling on asking rent; solid renter incomes; 4,709 units permitted in Madison County in 2024 (1,186 in 5+ unit buildings).
Forward outlook
- Local home prices are declining (-3.0%/yr); year-one equity from $1k of loan paydown is wiped out by about $4k of value loss. Plan a longer hold.
- Madison County population projected at +18% by 2050 — long-run rental-demand tailwind backs the buy-and-hold thesis.
- At projected returns (-3.0% appreciation + 6.8% rent growth), your $41k cash investment doubles in ~9 years — after that, you're playing with house money.
Negotiation context
- It's been on market 89 days — a 6% lower offer ($136k) is reasonable based on typical stale-listing flexibility.
- 2 sale attempts since 5y ago with the ask held roughly flat each time — persistent listings suggest the price (not the market) is what's stuck; bring a comps-based counter.
- Current owner paid $120k; 21% above their basis — modest negotiation headroom, anchor on the comps not their cost.
Risks & watch-outs
- Climate carrying-cost: extreme-heat days projected 7→19/yr by 2055 (HVAC capex compounding) — expect insurance premiums to compound above CPI over the hold.
Questions for the listing agent
- It's been on market 89 days. Have you received any prior offers? Is the seller open to a 6% concession, seller financing, or rate buy-down credit?
- Built in 1964 — when were the roof, HVAC, electrical panel, plumbing, and water heater last replaced?
- Why hasn't it sold? Are there any deal-killer items the seller is aware of (foundation, flood, title, zoning, code violations)?
- Is there a deadline driving the sale (1031 exchange, divorce, estate, relocation)? That informs how much negotiation room exists.
- Crime grade is F in this area — have there been break-ins, vandalism, or insurance claims at this property in the last 3 years? What carrier currently insures it and at what premium?
- What's the average days-on-market for RENTAL listings here right now (not sales)? A rising rental-DOM trend means longer vacancies and softer asking-rent achievability than the comps imply.
- What's the recent tenant-quality profile in this submarket — average credit score on applications, eviction rate, late-payment / NSF rate, and stable-employment percentage? A property-management company in the area should have these aggregated.
- How much new for-sale + rental construction is in the pipeline within 1–3 miles? Heavy new supply typically softens prices + rents 12–24 months out; constrained supply supports both.
Investment metrics
- 1% rule
- 1.03% ✓
- Cap rate
- 8.39%
- Cash-on-cash
- 7.50%
- DSCR
- 1.33
- GRM
- 8.1
CMA / ARV
- ARV (median comp)
- $154,838
- List price
- $144,900
- Delta
- -6.42%
- Verdict
- FAIR
- Comps
- 20 within 1.0 mi
Show comp detail 12 sales within ~0.75 mi
| Address | Dist | Beds/Ba | Sqft | Sold | Price | $/sf | Match |
|---|---|---|---|---|---|---|---|
| 116 Mccormick Dr NW | 0.16mi | 3/2.0 | 1,274 (+2%) | 3mo | $178,250 | $140 | 83 |
| 619 Kennan Rd | 0.71mi | 3/2.0 | 1,246 (-0%) | 1mo | $170,000 | $136 | 62 |
| 2602 Waltham Dr NE | 0.73mi | 3/1.0 | 1,263 (+1%) | 8mo | $140,000 | $111 | 58 |
| 410 Oshaughnessy Ave NE | 0.70mi | 3/1.5 | 1,176 (-6%) | 1mo | $110,000 | $94 | 54 |
| 1002 Mckinley Ave NE | 0.64mi | 3/2.0 | 1,208 (-3%) | 12mo | $375,000 | $310 | 51 |
| 2204 E Arbor Dr NW | 0.46mi | 3/2.0 | 1,402 (+12%) | 9mo | $190,800 | $136 | 46 |
| 1121 Mckinley Ave | 0.73mi | 2/1.0 (-1) | 1,315 (+5%) | 8mo | $225,000 | $171 | 45 |
| 720 Stevens Ave | 0.70mi | 3/2.0 | 1,381 (+11%) | 1mo | $485,000 | $351 | 45 |
| 2310 Lee High Dr | 0.49mi | 2/1.0 (-1) | 1,089 (-13%) | 10mo | $190,000 | $174 | 42 |
| 412 Oshaughnessy Ave NE | 0.70mi | 3/2.0 | 1,400 (+12%) | 5mo | $215,000 | $154 | 39 |
| 409 Mccullough Ave | 0.74mi | 3/2.0 | 1,376 (+10%) | 11mo | $280,000 | $203 | 35 |
| 801 Halsey Ave | 0.60mi | 2/1.5 (-1) | 1,072 (-14%) | 12mo | $130,000 | $121 | 32 |
Match score weights: distance 35% · size 25% · config 20% · recency 20%. Top-matched comps best support the ARV.
Projected returns pro-forma
-3.0% appreciation · 6.81% rent growth · sell at horizon
- IRR
- -0.9%
- Equity multiple
- 0.96×
- Total profit
- $-1,431
- Equity at exit
- $21,605
- IRR
- 12.2%
- Equity multiple
- 2.13×
- Total profit
- $45,723
- Equity at exit
- $12,528
Cash invested: $40,572 (down + closing). Projections, not guarantees.
Landlord ↔ Tenant lean methodology
- Overall (STATE)
- 90 Strongly Landlord-Friendly
- State Alabama
- 90 Strongly Landlord-Friendly · R+15
- County
- — inherits STATE
- City
- — inherits STATE
ZIP-level market 35811
- Home prices YoY
- -2.1%
- Rents YoY
- 6.8%
- Active inventory
- 560
- Price-to-rent
- 8.1×
Monthly cashflow live
- Estimated rent
- $1,487 high interval (Pro) →
- Mortgage (P&I)
- −$760
- Tax from tax record
- −$101 /mo · $1,212/yr
- Insurance
- −$60
- HOA
- −$0
- Vacancy / Maint / Mgmt
- −$312
- Net cashflow
- $254
Break-even live
UW: 25.0% down · 7.5% · 30yr · 1.5% tax · 5.0% vac · 8.0% maint · 8.0% mgmt
Financing live
Cash to close
- Down payment
- $36,225
- Closing costs
- $4,347
- Reserves months
- —
- Total cash needed
- —
Loan-product check · same deal, 3 products live
Conventional
25% down · 7.5% · 30yr
- Down + closing
- —
- Monthly P&I
- —
- Monthly cashflow
- —
- DSCR
- —
- Eligible?
- —
Personal DTI + credit; lowest rate.
DSCR
20% down · 8.5% · 30yr
- Down + closing
- —
- Monthly P&I
- —
- Monthly cashflow
- —
- DSCR
- —
- Eligible?
- —
No personal income docs; deal must DSCR.
Hard money
10% down · 12.0% · 12mo
- Down + closing
- —
- Monthly P&I
- —
- Monthly cashflow
- —
- DSCR
- —
- Eligible?
- —
Short-term bridge; refi at stabilization.
Rent comps 40 comps
| Address | Beds | Baths | Sqft | Rent | $/sqft | DOM | Units | Dist |
|---|---|---|---|---|---|---|---|---|
| 2032 Front St NE Huntsville, AL | 4.0 | 2.0 | 1304 | $1,400 | $1.07 | 43d | 1 | 0.18mi |
| 304 Wind Ave NW Huntsville, AL | 2.0 | 1.0 | 960 | $1,095 | $1.14 | 43d | 1 | 0.33mi |
| 2115 Lee High Dr NE Huntsville, AL | 3.0 | 1.0 | 870 | $1,245 | $1.43 | 13d | 1 | 0.36mi |
| 415 Halsey Ave NE Huntsville, AL | 2.0 | 1.0–2.0 | 818 | $1,760 | $2.15 | 13d | 20 | 0.38mi |
| 2601 Academy Dr NW Huntsville, AL | 2.0–4.0 | 1.0–2.0 | 971 | $1,262 | $1.30 | 43d | 1 | 0.48mi |
| 522 Lisa Ln NW Huntsville, AL | 4.0 | 3.0 | 1025 | $1,695 | $1.65 | 43d | 1 | 0.63mi |
| 2809 Academy Dr NW Huntsville, AL | 2.0 | 1.5 | 900 | $950 | $1.06 | 43d | 1 | 0.64mi |
| 1114 Oakwood Ave NE Unit A Huntsville, AL | 2.0 | 1.0 | 1000 | $995 | $0.99 | 13d | 1 | 0.70mi |
| 1107 England St NE Unit A Huntsville, AL | 2.0 | 1.0 | 956 | $1,200 | $1.26 | 43d | 1 | 0.70mi |
| 410 McCullough Ave NE Huntsville, AL | 3.0 | 1.0 | 1143 | $1,500 | $1.31 | 23d | 1 | 0.75mi |
| 202 Beirne Ave NE Huntsville, AL | 3.0 | 1.5 | 1145 | $1,450 | $1.27 | 43d | 1 | 0.78mi |
| 621 Murray Rd NW Huntsville, AL | 3.0 | 1.5 | 1008 | $1,325 | $1.31 | 13d | 1 | 0.79mi |
| 1224 Halsey Ave NE Huntsville, AL | 3.0 | 2.0 | 1229 | $2,000 | $1.63 | 23d | 1 | 0.84mi |
| 611 Ofallon Rd NW Huntsville, AL | 3.0 | 2.0 | 1350 | $3,000 | $2.22 | 23d | 1 | 0.85mi |
| 218 Ward Ave NE Huntsville, AL | 2.0 | 2.0 | 932 | $1,450 | $1.56 | 13d | 1 | 0.85mi |
| 2212 Old Blue Spring Rd NW Unit B Huntsville, AL | 2.0 | 1.0 | 759 | $870 | $1.15 | 23d | 1 | 0.86mi |
| 2212 Old Blue Spring Rd NW Unit A Huntsville, AL | 2.0 | 1.0 | 970 | $970 | $1.00 | 23d | 1 | 0.86mi |
| 1000 Hampton Fall Blvd Huntsville, AL | 1.0–3.0 | 1.0–2.0 | 1177 | $1,451 | $1.23 | 43d | 4 | 0.87mi |
| 3058 Boswell Dr NW Huntsville, AL | 4.0 | 2.0 | 1450 | $1,398 | $0.96 | 43d | 1 | 0.87mi |
| 401 Pratt Ave NE Huntsville, AL | 2.0 | 1.0–2.0 | 929 | $2,290 | $2.47 | 13d | 64 | 0.91mi |
| 1236 Oshaughnessy Ave NE Huntsville, AL | 3.0 | 1.0 | 950 | $1,450 | $1.53 | 23d | 1 | 0.96mi |
| 212 White St NE Huntsville, AL | 2.0 | 1.0 | 960 | $1,095 | $1.14 | 43d | 1 | 0.96mi |
| 402 Walker Ave NE Unit C Huntsville, AL | 2.0 | 1.0 | 960 | $1,000 | $1.04 | 43d | 1 | 0.97mi |
| 1504 Oakwood Ave NE Apt 4 Huntsville, AL | 2.0 | 1.0 | 800 | $995 | $1.24 | 43d | 1 | 1.00mi |
| 510 Lacy St NE Huntsville, AL | 2.0 | 1.0 | 900 | $1,395 | $1.55 | 43d | 1 | 1.02mi |
| 1529 McKinley Ave NE Huntsville, AL | 2.0 | 1.0 | 884 | $1,400 | $1.58 | 43d | 1 | 1.03mi |
| 1423 Stevens Ave NE Huntsville, AL | 2.0 | 1.0 | 1020 | $1,450 | $1.42 | 43d | 1 | 1.03mi |
| 1503 Rison Ave NE Huntsville, AL | 2.0 | 1.0 | 1070 | $1,395 | $1.30 | 43d | 1 | 1.04mi |
| 2640 Blue Spring Rd NW Huntsville, AL | 1.0–3.0 | 1.0–2.0 | 944 | $1,149 | $1.22 | 43d | 3 | 1.06mi |
| 1511 Humes Ave NE Huntsville, AL | 3.0 | 1.0 | 1053 | $1,675 | $1.59 | 23d | 1 | 1.11mi |
| 1602 Rison Ave NE Huntsville, AL | 3.0 | 2.0 | 1422 | $1,750 | $1.23 | 13d | 1 | 1.12mi |
| 1334 Oshaughnessy Ave NE Apt B4 Huntsville, AL | 2.0 | 1.0 | 732 | $800 | $1.09 | 43d | 1 | 1.12mi |
| 203 N Plymouth Rd NW Huntsville, AL | 2.0 | 1.0 | 796 | $1,310 | $1.65 | 13d | 1 | 1.16mi |
| 2416 Hanover Dr NW Huntsville, AL | 3.0 | 2.0 | 1300 | $1,395 | $1.07 | 43d | 1 | 1.17mi |
| 2401 Mount Vernon Rd NW Huntsville, AL | 3.0 | 1.0 | 950 | $1,045 | $1.10 | 43d | 1 | 1.18mi |
| 2211 Penhall Dr NE Huntsville, AL | 3.0 | 1.5 | 1274 | $1,650 | $1.30 | 43d | 1 | 1.19mi |
| 1112 Wellman Ave NE Huntsville, AL | 2.0 | 2.0 | 957 | $1,475 | $1.54 | 13d | 1 | 1.20mi |
| 1122 Wellman Ave NE Unit 4 Huntsville, AL | 2.0 | 1.0 | 830 | $1,645 | $1.98 | 43d | 1 | 1.21mi |
| 1605 McCullough Ave NE Huntsville, AL | 2.0 | 2.0 | 1100 | $2,200 | $2.00 | 13d | 1 | 1.22mi |
| 2219 Jonathan Dr NW Apt C Huntsville, AL | 2.0 | 1.5 | 850 | $850 | $1.00 | 43d | 1 | 1.23mi |
Listing history 16 events
-
2026-06-14status $144,900 Pending 89 DOM
-
2026-06-10days on market $144,900 Active 89 DOM
-
2026-06-09days on market $144,900 Active 88 DOM
-
2026-06-08days on market $144,900 Active 87 DOM
-
2026-06-07days on market $144,900 Active 86 DOM
-
2026-06-03days on market $144,900 Active 82 DOM
-
2026-06-02days on market $144,900 Active 81 DOM
-
2026-06-01days on market $144,900 Active 80 DOM
-
2026-05-31days on market $144,900 Active 79 DOM
-
2026-05-30days on market $144,900 Active 78 DOM
-
2026-03-13$144,900 Active 706-char remark
Show marketing remark (706 chars)
Charming brick 1-story home featuring 3 bedrooms and 1 bathroom with great curb appeal! Enjoy relaxing on the covered front porch overlooking the lovely yard. Inside, the home offers a large living room filled with natural light and finished in neutral colors, creating a warm and inviting atmosphere. The kitchen includes a refrigerator, range, and dishwasher and opens to the dining room—perfect for everyday living and entertaining. Laminate flooring runs through the main living areas, while the bedrooms are comfortably carpeted. The updated bathroom features a tile shower/tub combo and a classic pedestal sink. Step outside to a wonderful fenced yard offering plenty of space to relax, play, o
-
2021-12-16soldstatus $120,000
-
2021-12-15soldstatus $120,000 Sold 81-char remark
Show marketing remark (81 chars)
Brick home near historic 5 points! Convenient to downtown, shopping, and dining!
-
2021-12-04status Pending 81-char remark
Show marketing remark (81 chars)
Brick home near historic 5 points! Convenient to downtown, shopping, and dining!
-
2021-11-18$139,900 Active 81-char remark
Show marketing remark (81 chars)
Brick home near historic 5 points! Convenient to downtown, shopping, and dining!
-
2017-09-22soldstatus $47,000
ⓘ Source: listings_history table (triggers on properties + properties_extension) + one-shot
backfill from property_details.listing_events for pre-trigger history.
Tax reassessment forecast AL · Resets to sale price
- Current annual tax
- $1,212 · $101/mo
- Projected year-2 tax
- $1,212 · $101/mo
- Expected delta
- $0/yr ($0/mo · 0.0%)
ⓘ Screening estimate from a state-policy table — verify with the county assessor before closing.
Climate risk First Street
- Flood 1/10 Low FEMA zone X (unshaded) · 0% chance over 30 yrs
- Wildfire 3/10 Moderate
- Heat 6/10 Major 7 d/yr ≥104°F today · 19 d/yr by 30 yrs out
- Wind 4/10 Moderate 17% chance of damaging wind over 30 yrs
- Air quality 2/10 Low 1 unhealthy d/yr today · 1 by 30 yrs out
Nearby sold comps map
Loading sold comps map…
Walkable amenities ~0.75 mi
Loading nearby amenities…
Taxation est. · year 1
- Rental income
- $17,847
- − Mortgage interest
- −$8,117
- − Property taxes
- −$1,212
- − Insurance
- −$724
- − Repairs & maintenance
- −$1,428
- − Management
- −$1,428
- − Depreciation
- −$4,215
- Taxable income
- $723
- Est. tax owed @ 24.0%
- −$173
- After-tax cash flow
- $2,870/yr
For passive investors: Depreciation is non-cash, so a rental often shows a tax loss while cash-flowing — sheltering income. Rental losses are passive: they offset passive income freely, and up to $25,000/yr can offset ordinary (W-2) income if you actively participate and your MAGI is under $100k (phasing out to $0 by $150k); unused losses carry forward. On sale, claimed depreciation is recaptured at up to 25%, and gains may owe capital-gains tax (a 1031 exchange can defer both). Figures are a year-1 estimate at your 24.0% rate — not tax advice; consult a CPA.
Schools (NCES district)
- District
- Huntsville City
- NCES district ID
- 0101800
- Math proficiency
- 21% ▼ -23.00%
- Reading proficiency
- 46% ▬ 0.00%
- Median HH income
- $48,264
- Composite
- 28.84/100
- National rank
- #6647
- State rank
- #48 of 129 in AL
Livability — Huntsville
- Score
- 82/100
- State rank
- #3
- US rank
- #1082
Category grades
Schools grade is shown separately in the Schools card above.
Census & demographics
- Census place
- Huntsville, AL
- County
- Madison County · 380,832 people
- City population
- 220,435
- Metro
- Huntsville, AL
- Population (ZIP)
- 31,008
- Household income
- $90,812
- Rent vs Own
- Severe rent burden
- 517.0
Population outlook (Madison County) Hauer SSP2
- Today (2025)
- 392,086 people
- By 2030
- 409,788 · +4.5%
- By 2040
- 440,557 · +12.4%
- By 2050
- 460,990 · +17.6%
- By 2075
- 502,872 · +28.3%
- By 2100
- 513,623 · +31.0%
Race, ethnicity, and origin ACS 2023
- Neighborhood character
- Majority White (64%)
- Race & ethnicity
- White 64% Black 27% Two or more races 5% Hispanic / Latino 3% Asian 2%
- Common ancestry
- Slovak 2% Italian 2% Serbian 2%
- Foreign-born
- 4% · Canada, Vietnam, China
- Languages at home
- 95% English-only · Spanish 3% Vietnamese 1%
Political lean MEDSL · Madison
- 2024 margin
- Lean R (+9.0) · D 44.7% · R 53.7% · Other 1.6%
- 2008→2024 swing
- +6.0pp toward D · 2008: -14.9pp · 2024: -9.0pp
- All cycles
- 2024: R+9.0 2020: R+8.0 2016: R+16.8 2012: R+18.7 2008: R+14.9
Not yet ingested
- Civics
- —
Market trends
- HPI YoY
- ▼ -7.13%
- Current HPI
- 332.9423
- Rent YoY
- ▲ 6.81%
- Metro
- Huntsville, AL
- State GDP YoY
- ▲ 2.94%
- F500 in state
- 4
Industry mix (Fortune 500 HQ in AL)
| Industry | F500 HQs | Revenue |
|---|---|---|
| Financial Services | 1 | $8B |
|
||
| Healthcare | 1 | $5B |
|
||
Price history
+208.3% since first listed6 events — show timeline
- 2026-03-13 Listed $144,900 VMLS
- 2021-12-16 Sold (Public Records) $120,000 Public Records
- 2021-12-15 Sold (MLS) $120,000 VMLS
- 2021-12-04 Pending — VMLS
- 2021-11-18 Listed $139,900 VMLS
- 2017-09-22 Sold (Public Records) $47,000 Public Records
Property tax history
+12.2%/yrLatest (2024): $1,212 · +8.1% YoY. Source: county tax records.
Cash-flow waterfall
monthlySold comps — $/sqft
last 12 mo · ≤1 miLoading sold comps…