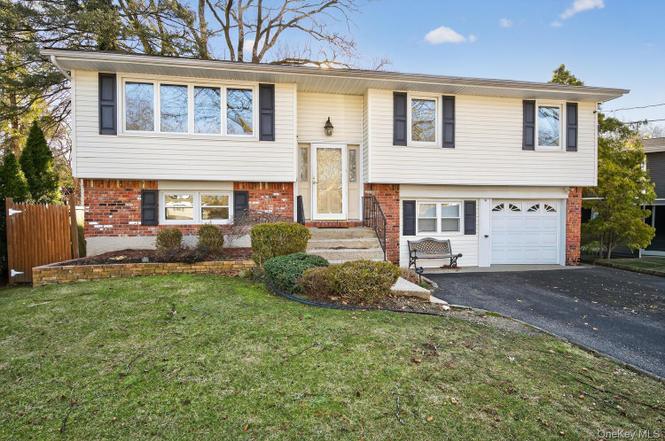
8 Stern Ct · Huntington Station, NY
Flood risk 1/10 · Minimal
- FEMA flood zone
- X (unshaded)
- Chance of flooding over 30 yrs
- 0.0%
- Est. flood insurance / yr
- $473 – $860
Fire risk 1/10 · Minimal
- Est. fire insurance / yr
- $691 – $1,283
Heat risk 5/10 · Moderate
- Hot days now (above 97°F)
- 7 days/yr
- Hot days in 30 yrs
- 15 days/yr
Wind risk 8/10 · Major
- Chance of severe wind over 30 yrs
- 80.0%
Air-quality risk 4/10 · Minor
- Unhealthy air days now
- 4 days/yr
- Unhealthy air days in 30 yrs
- 6 days/yr
Risk factors via First Street. Map © Google.
Why this score? — see what drove the D+ grade
The composite is a weighted blend of 9 inputs, each scored 0–100. Each bar is that input's sub-score; the figure is the points it added to the 100-point composite (weight × sub-score).
- ARV discount +15.0/15.0
- Cash flow +11.5/30.0
- Schools +4.6/10.0
- Livability +4.0/5.0
- Rent growth +3.6/5.0
- DSCR +3.4/10.0
- 1% rule +3.1/10.0
- Condition / age +2.5/5.0
- Appreciation +0.0/10.0
$649,000
🖨 Deal sheet 📄 Offer letter ✓ Due diligence
Listing remarks
Four Bedroom, 2 Full Bath Hi-Ranch located on a cul-de-sac. Updated vinyl siding, roof and windows. Updated deck. New Oil Tank. Wall units in all bedrooms
Key facts
- 6,098 sq ft lot
- Garage
- Built 1963
Neighborhood map
What this means for you Summary
Snapshot
- This is a 4-bed/2.0-bath single-family listed at $649k.
Deal economics
- At list price, monthly cash flow is $-215 ($-3k/yr) — negative.
- To cash-flow at today's rent, offer at most $611k (5.8% below list).
- To meet the 1% rule (rent ≥ 1% of price), the offer needs to be $524k (19.3% below list).
- Recommended offer: $524k (19.3% below list) — sets the bar for 1% rule.
- Cap rate 5.9% vs local median 4.1% in Huntington Station — top-decile yield for the area; either an underpriced asset or a hidden risk that comps aren't pricing in. Stress-test before assuming the spread holds.
Location & tenants
- Location reads 79/100 on livability (#126 in NY, #2,028 nationally) — a middle-class / working-renter tenant base. Strengths: commute A+, employment A+, housing A+; Watch: amenities D, cost of living F.
- Huntington Union Free School District (suburban): math 45% / reading 52% proficiency, ranked #328 of 590 in NY (top 56%) — families likely to look elsewhere, expect single-tenant / working-renter base with shorter leases.
- Zoned schools: Jefferson School (math 42% / reading 52%, grade D-, #1,195 of 2,108 statewide, top 60%, 286 students, 57% FRL); J Taylor Finley Middle School (math 25% / reading 44%, grade F, #483 of 729 statewide, top 68%, 623 students, 58% FRL); Huntington High School (math 91% / reading 92%, grade A+, #197 of 1,100 statewide, top 18%, 1,410 students, 56% FRL) — zoned schools average 57% FRL vs 34% district-wide (24 pts higher); higher-poverty schools than district average — tighter screening recommended.
- Market conditions: Rents rising fast (+4.5%/yr); 308 active listings in the ZIP; 2 comparable units currently listed for rent nearby; high-income renter base; 1,366 units permitted in Suffolk County in 2024 (216 in 5+ unit buildings).
- This rent runs 38% of the median local income ($165k/yr) — at the standard rent-burdened threshold; future hikes will face affordability resistance.
Forward outlook
- Local home prices are declining (-3.0%/yr); year-one equity from $4k of loan paydown is wiped out by about $19k of value loss. Plan a longer hold.
- Suffolk County population projected to shrink 5% by 2050 — rents likely to lag national; underwrite the cash flow, not the appreciation.
Negotiation context
- Only 13 days on market — expect competitive offers; lowballing is unlikely to land.
- Current owner paid $164k; list at $649k implies a 296% gain — meaningful room to come down on a strong offer.
Risks & watch-outs
- Climate carrying-cost: severe wind risk, 80% chance of damaging wind over 30y; extreme-heat days projected 7→15/yr by 2055 (HVAC capex compounding) — expect insurance premiums to compound above CPI over the hold.
Questions for the listing agent
- What do current leases actually rent for vs. the listed asking? Can we see a recent rent roll and the last 12 months of T-12 income?
- Built in 1963 — when were the roof, HVAC, electrical panel, plumbing, and water heater last replaced?
- Is there a deadline driving the sale (1031 exchange, divorce, estate, relocation)? That informs how much negotiation room exists.
- Schools are D-rated, which usually means shorter tenancies and higher turnover. Who's the typical renter profile here, and what's been the actual vacancy rate?
- The area grade is low — what's the realistic commute time and amenity access for the typical tenant pool here? Any planned neighborhood developments (good or bad) we should know about?
- What's the average days-on-market for RENTAL listings here right now (not sales)? A rising rental-DOM trend means longer vacancies and softer asking-rent achievability than the comps imply.
- What's the recent tenant-quality profile in this submarket — average credit score on applications, eviction rate, late-payment / NSF rate, and stable-employment percentage? A property-management company in the area should have these aggregated.
- How much new for-sale + rental construction is in the pipeline within 1–3 miles? Heavy new supply typically softens prices + rents 12–24 months out; constrained supply supports both.
Investment metrics
- 1% rule
- 0.81% ✗
- Cap rate
- 5.90%
- Cash-on-cash
- -1.42%
- DSCR
- 0.94
- GRM
- 10.3
CMA / ARV
- ARV (on-the-fly)
- $818,800
- Comps found
- 11
Show comp detail 11 sales within ~0.75 mi
| Address | Dist | Beds/Ba | Sqft | Sold | Price | $/sf | Match |
|---|---|---|---|---|---|---|---|
| 8 Stern Ct | 0.00mi | 4/2.0 | 2,300 (0%) | 1mo | $685,000 | $298 | 100 |
| 12 Terrace Dr | 0.11mi | 4/2.0 | 2,174 (-6%) | 7mo | $775,000 | $356 | 80 |
| 40 Panorama Dr | 0.34mi | 4/1.5 | 2,209 (-4%) | 8mo | $805,000 | $364 | 68 |
| 214 Crombie St | 0.43mi | 4/3.0 | 2,263 (-2%) | 12mo | $690,000 | $305 | 63 |
| 30 Rancher Pl | 0.49mi | 4/2.5 | 2,100 (-9%) | 0mo | $1,325,000 | $631 | 60 |
| 237 Oakwood Rd | 0.42mi | 3/2.0 (-1) | 2,135 (-7%) | 4mo | $740,000 | $347 | 60 |
| 121 Columbia St | 0.33mi | 4/2.0 | 2,200 (-4%) | 23mo | $450,000 | $205 | 58 |
| 19 Skyline Dr | 0.56mi | 4/2.5 | 2,400 (+4%) | 10mo | $950,000 | $396 | 56 |
| 24 Royal Oak Dr | 0.34mi | 4/2.5 | 2,000 (-13%) | 12mo | $1,080,000 | $540 | 51 |
| 6 Rolling Hills Dr | 0.33mi | 4/2.0 | 1,996 (-13%) | 16mo | $690,000 | $346 | 49 |
| 32 Chestnut St | 0.70mi | 3/2.0 (-1) | 2,000 (-13%) | 13mo | $950,000 | $475 | 29 |
Match score weights: distance 35% · size 25% · config 20% · recency 20%. Top-matched comps best support the ARV.
Projected returns pro-forma
-3.0% appreciation · 4.54% rent growth · sell at horizon
- IRR
- -17.0%
- Equity multiple
- 0.39×
- Total profit
- $-110,594
- Equity at exit
- $96,768
- IRR
- -6.4%
- Equity multiple
- 0.57×
- Total profit
- $-79,024
- Equity at exit
- $56,114
Cash invested: $181,720 (down + closing). Projections, not guarantees.
Landlord ↔ Tenant lean methodology
- Overall (STATE)
- 15 Strongly Tenant-Friendly
- State New York
- 15 Strongly Tenant-Friendly · D+10
- County
- — inherits STATE
- City
- — inherits STATE
ZIP-level market 11746
- Rents YoY
- 4.5%
- Active inventory
- 308
- Price-to-rent
- 10.3×
Monthly cashflow live
- Estimated rent
- $5,237 medium interval (Pro) →
- Mortgage (P&I)
- −$3,403
- Tax from tax record
- −$678 /mo · $8,131/yr
- Insurance
- −$270
- HOA
- −$0
- Vacancy / Maint / Mgmt
- −$1,100
- Net cashflow
- $-215
Break-even live
UW: 25.0% down · 7.5% · 30yr · 1.5% tax · 5.0% vac · 8.0% maint · 8.0% mgmt
Financing live
Cash to close
- Down payment
- $162,250
- Closing costs
- $19,470
- Reserves months
- —
- Total cash needed
- —
Loan-product check · same deal, 3 products live
Conventional
25% down · 7.5% · 30yr
- Down + closing
- —
- Monthly P&I
- —
- Monthly cashflow
- —
- DSCR
- —
- Eligible?
- —
Personal DTI + credit; lowest rate.
DSCR
20% down · 8.5% · 30yr
- Down + closing
- —
- Monthly P&I
- —
- Monthly cashflow
- —
- DSCR
- —
- Eligible?
- —
No personal income docs; deal must DSCR.
Hard money
10% down · 12.0% · 12mo
- Down + closing
- —
- Monthly P&I
- —
- Monthly cashflow
- —
- DSCR
- —
- Eligible?
- —
Short-term bridge; refi at stabilization.
Rent comps 2 comps
| Address | Beds | Baths | Sqft | Rent | $/sqft | DOM | Units | Dist |
|---|---|---|---|---|---|---|---|---|
| 245 Main St Unit 1 Huntington, NY | 3.0 | 2.0 | 1600 | $5,995 | $3.75 | 1d | 1 | 1.35mi |
| 1700 E 5th St Huntington Station, NY | 1.0–3.0 | 1.0–2.0 | 1277 | $5,037 | $3.94 | 1d | 1 | 1.37mi |
Listing history 5 events
-
2026-04-01status Pending
-
2026-03-10$649,000 Active
-
2026-03-03historical $649,000
-
1992-07-08soldstatus $164,000
-
1982-12-08soldstatus $76,000
ⓘ Source: listings_history table (triggers on properties + properties_extension) + one-shot
backfill from property_details.listing_events for pre-trigger history.
Tax reassessment forecast NY · Partial reset (capped growth)
- Current annual tax
- $8,131 · $678/mo
- Projected year-2 tax
- $9,549 · $796/mo
- Expected delta
- +$1,419/yr (+$118/mo · 17.4%)
ⓘ Screening estimate from a state-policy table — verify with the county assessor before closing.
Climate risk First Street
- Flood 1/10 Low FEMA zone X (unshaded) · 0% chance over 30 yrs
- Wildfire 1/10 Low
- Heat 5/10 Major 7 d/yr ≥97°F today · 15 d/yr by 30 yrs out
- Wind 8/10 Severe 80% chance of damaging wind over 30 yrs
- Air quality 4/10 Moderate 4 unhealthy d/yr today · 6 by 30 yrs out
Nearby sold comps map
Loading sold comps map…
Walkable amenities ~0.75 mi
Loading nearby amenities…
Taxation est. · year 1
- Rental income
- $62,839
- − Mortgage interest
- −$36,354
- − Property taxes
- −$8,131
- − Insurance
- −$3,245
- − Repairs & maintenance
- −$5,027
- − Management
- −$5,027
- − Depreciation
- −$18,880
- Taxable loss
- −$13,825
- Est. tax savings @ 24.0%
- +$3,318
- After-tax cash flow
- $744/yr
For passive investors: Depreciation is non-cash, so a rental often shows a tax loss while cash-flowing — sheltering income. Rental losses are passive: they offset passive income freely, and up to $25,000/yr can offset ordinary (W-2) income if you actively participate and your MAGI is under $100k (phasing out to $0 by $150k); unused losses carry forward. On sale, claimed depreciation is recaptured at up to 25%, and gains may owe capital-gains tax (a 1031 exchange can defer both). Figures are a year-1 estimate at your 24.0% rate — not tax advice; consult a CPA.
Schools (NCES district)
- District
- Huntington Union Free School District
- NCES district ID
- 3615090
- Math proficiency
- 45% ▼ -8.00%
- Reading proficiency
- 52% ▼ -1.00%
- Median HH income
- $93,547
- Composite
- 45.68/100
- National rank
- #2578
- State rank
- #328 of 590 in NY
Livability — Huntington Station
- Score
- 79/100
- State rank
- #126
- US rank
- #2028
Category grades
Schools grade is shown separately in the Schools card above.
Census & demographics
- Census place
- Huntington Station, NY
- County
- Suffolk County · 679,920 people
- Metro
- New York-Newark-Jersey City, NY-NJ-PA
- Population (ZIP)
- 65,747
- Household income
- $164,589
- Rent vs Own
- Severe rent burden
- 627.0
Population outlook (Suffolk County) Hauer SSP2
- Today (2025)
- 1,505,262 people
- By 2030
- 1,498,318 · -0.5%
- By 2040
- 1,471,101 · -2.3%
- By 2050
- 1,424,848 · -5.3%
- By 2075
- 1,337,157 · -11.2%
- By 2100
- 1,217,720 · -19.1%
Race, ethnicity, and origin ACS 2023
- Neighborhood character
- Diverse neighborhood (Simpson 0.58)
- Race & ethnicity
- White 61% Hispanic / Latino 19% Two or more races 10% Asian 8% Black 7% Native American 1%
- Hispanic origin (detail)
- Mexican 2% Puerto Rican 2%
- Common ancestry
- Romanian 5% Scotch-Irish 3% Italian 1%
- Foreign-born
- 20% · Canada, China, Jamaica
- Languages at home
- 70% English-only · Spanish 15% Other Indo-European 6% Chinese 2%
Political lean MEDSL · Suffolk
- 2024 margin
- Lean R (+10.0) · D 45.0% · R 55.0%
- 2008→2024 swing
- -16.0pp toward R · 2008: 6.0pp · 2024: -10.0pp
- All cycles
- 2024: R+10.0 2020: R+0.0 2016: R+8.2 2012: D+2.9 2008: D+6.0
Not yet ingested
- Civics
- —
Market trends
- HPI YoY
- ▼ -715.60%
- Current HPI
- 317.5657
- Rent YoY
- ▲ 4.54%
- Metro
- New York-Newark-Jersey City, NY-NJ-PA
- State GDP YoY
- ▲ 2.60%
- F500 in state
- 92
Industry mix (Fortune 500 HQ in NY)
| Industry | F500 HQs | Revenue |
|---|---|---|
| Financial Services | 10 | $950B |
|
||
| Consumer Goods | 9 | $162B |
|
||
| Insurance | 4 | $225B |
|
||
| Telecommunications | 2 | $144B |
|
||
| Pharmaceuticals | 2 | $112B |
|
||
| Media / Entertainment | 2 | $69B |
|
||
Price history
+753.9% since first listed5 events — show timeline
- 2026-04-01 Pending — OneKey® MLS as Distributed by MLS Grid
- 2026-03-10 Listed $649,000 OneKey® MLS as Distributed by MLS Grid
- 2026-03-03 Coming Soon $649,000 OneKey® MLS as Distributed by MLS Grid
- 1992-07-08 Sold (Public Records) $164,000 Public Records
- 1982-12-08 Sold (Public Records) $76,000 Public Records
Property tax history
-0.1%/yrLatest (2025): $8,131 · +0.0% YoY. Source: county tax records.
Cash-flow waterfall
monthlySold comps — $/sqft
last 12 mo · ≤1 miLoading sold comps…