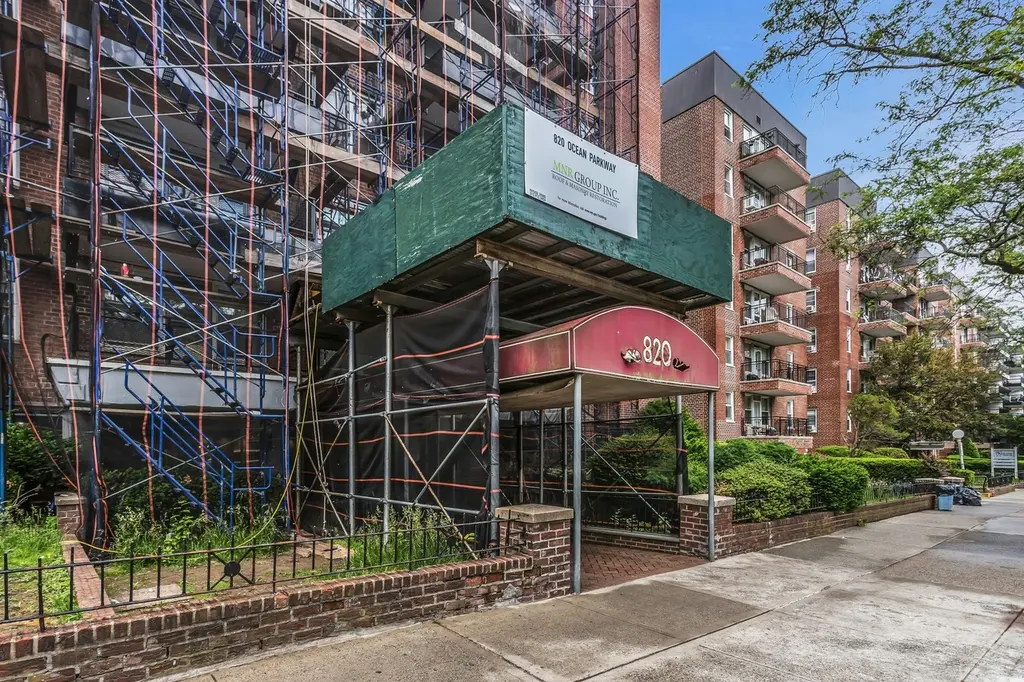
820 Ocean Pkwy #719 · New York, NY
Flood risk 7/10 · Major
- FEMA flood zone
- X (unshaded)
- Chance of flooding over 30 yrs
- 0.77%
- Est. flood insurance / yr
- $507 – $1,088
Fire risk 1/10 · Minimal
- Est. fire insurance / yr
- $691 – $1,283
Heat risk 6/10 · Moderate
- Hot days now (above 97°F)
- 7 days/yr
- Hot days in 30 yrs
- 16 days/yr
Wind risk 6/10 · Moderate
- Chance of severe wind over 30 yrs
- 64.0%
Air-quality risk 4/10 · Minor
- Unhealthy air days now
- 5 days/yr
- Unhealthy air days in 30 yrs
- 7 days/yr
Risk factors via First Street. Map © Google.
Why this score? — see what drove the D- grade
The composite is a weighted blend of 9 inputs, each scored 0–100. Each bar is that input's sub-score; the figure is the points it added to the 100-point composite (weight × sub-score).
- ARV discount +7.5/15.0
- Cash flow +7.4/30.0
- 1% rule +5.3/10.0
- Schools +5.0/10.0
- Rent growth +4.0/5.0
- Livability +3.8/5.0
- Condition / age +2.2/5.0
- DSCR +1.5/10.0
- Appreciation +0.0/10.0
$238,500
🖨 Deal sheet (PDF) 📄 Offer letter ✓ Due diligence
Listing remarks MLS
Affordable Spacious One Bedroom Apartment with Manhattan views in this 24 hours doorman building located in the Midwood Section of Brooklyn. .. Sold in "AS IS" Condition, Needs Updating (Kitchen/Bath). This unit offers a front entrance room with closet (can be a office /den), large living room, eat-in kitchen, spacious bedroom & a full bathroom. Apartment was just freshly painted, some new light fixtures, Beautiful hardwood floors & cleaned. Utilities included; Heating, Water/Sewer. Building has Garage/Bike Storage (Wait List), Live in Super & Elevator. Convenient to All including; F, B & Q Trains, Buses, Shopping, Night Life, etc. Must See! (Assessment: $93.33 per month)
Key facts
- Midwood section
- Manhattan views
- Front entrance room
Tags
Property features AI
Finance
- HOA & community: Additional monthly assessment of $93.33; Community features include sidewalks
Exterior
- Parking: Garage (waitlist)
- Security: Security: Other
- Utilities: Public sewer; Electricity available; Natural gas available; Water available; Sewer connected; Trash collection (private); See remarks for additional utility details
- Home design: Stock cooperative; One level (entry on level 7); 7-story building
- Construction: Brick construction
- Exterior features: Brick exterior; No waterfront; Sidewalks
Interior
- Kitchen: Appliances: Other
- Bedrooms: Total rooms: 4
- Flooring: Hardwood floors
- Bathrooms: 1 full bathroom
- Heating & cooling: Oil heating; Steam heating; No central cooling
- Interior features: Eat-in kitchen; Laundry room; No pets allowed; Plans used for living area
- Laundry & utility: Laundry room
Neighborhood map
What this means for you Summary
Snapshot
- This is a 1-bed/1.0-bath condo listed at $238k. Condition is rated fair.
Deal economics
- At list price, monthly cash flow is $-377 ($-5k/yr) — negative.
- The deal already cash-flows at list — no discount required.
- Meets the 1% rule at list price ($2k rent vs $238k).
- Recommended offer: $235k (1.5% below list) — sets the bar for market timing.
- Cap rate 4.7% vs local median 2.6% in New York — top-decile yield for the area; either an underpriced asset or a hidden risk that comps aren't pricing in. Stress-test before assuming the spread holds.
Location & tenants
- Location reads 75/100 on livability (#268 in NY, #4,188 nationally) — a middle-class / working-renter tenant base. Strengths: amenities A+, commute A+, health & safety A; Watch: crime F, cost of living F.
- Market conditions: Rents rising fast (+6.2%/yr); 212 active listings in the ZIP; 3 comparable units currently listed for rent nearby; rentals at typical pace (median 26d on market — plan ~3-4 weeks tenant-placement turnaround); 10,063 units permitted in Kings County in 2024 (9,789 in 5+ unit buildings).
- This rent runs 42% of the median local income ($70k/yr) — at the standard rent-burdened threshold; future hikes will face affordability resistance.
Forward outlook
- Local home prices are declining (-3.0%/yr); year-one equity from $2k of loan paydown is wiped out by about $7k of value loss. Plan a longer hold.
- Kings County population projected at +13% by 2050 — modest demand growth; plan on rents tracking national, not racing it.
Negotiation context
- It's been on market 24 days — a 2% lower offer ($235k) is reasonable based on typical stale-listing flexibility.
- 2 sale attempts with the ask held roughly flat each time — persistent listings suggest the price (not the market) is what's stuck; bring a comps-based counter.
Risks & watch-outs
- Watch-outs: flood insurance adds $66/mo; HOA is 24% of rent.
- Climate carrying-cost: major flood risk; major wind risk, 64% chance of damaging wind over 30y; extreme-heat days projected 7→16/yr by 2055 (HVAC capex compounding) — expect insurance premiums to compound above CPI over the hold.
Questions for the listing agent
- What do current leases actually rent for vs. the listed asking? Can we see a recent rent roll and the last 12 months of T-12 income?
- Have any recent inspections been done? Can we get a copy of the seller's disclosures and any deferred-maintenance estimates?
- Built in 1961 — when were the roof, HVAC, electrical panel, plumbing, and water heater last replaced?
- What's the actual annual flood-insurance premium (NFIP or private), and is the property in a SFHA with mandatory coverage?
- What does the HOA fee cover, when was the last increase, and are there any pending special assessments or reserve-fund shortfalls?
- Any open or pending special assessments — roof, HVAC, plumbing, elevator, façade? What's the per-unit balance and payoff schedule, and is the seller paying it off at close or rolling it to the buyer?
- Is there a deadline driving the sale (1031 exchange, divorce, estate, relocation)? That informs how much negotiation room exists.
- Schools are B-rated — typically a magnet for longer-tenancy family renters. What's the average tenant stay here, and is there a school-zone premium baked into asking?
- Crime grade is F in this area — have there been break-ins, vandalism, or insurance claims at this property in the last 3 years? What carrier currently insures it and at what premium?
- The area grade is low — what's the realistic commute time and amenity access for the typical tenant pool here? Any planned neighborhood developments (good or bad) we should know about?
- What's the average days-on-market for RENTAL listings here right now (not sales)? A rising rental-DOM trend means longer vacancies and softer asking-rent achievability than the comps imply.
- What's the recent tenant-quality profile in this submarket — average credit score on applications, eviction rate, late-payment / NSF rate, and stable-employment percentage? A property-management company in the area should have these aggregated.
- How much new apartment / multifamily construction is in the pipeline within 1–3 miles? Heavy new supply (>2% of stock underway) typically softens rents 12–24 months out; light construction supports rent growth.
Investment metrics
- 1% rule
- 1.03% ✓
- Cap rate
- 4.73%
- Cash-on-cash
- -5.57%
- DSCR
- 0.75
- GRM
- 8.1
CMA / ARV
No comps found within radius.
Projected returns pro-forma
-3.0% appreciation · 6.17% rent growth · sell at horizon
- IRR
- -22.7%
- Equity multiple
- 0.19×
- Total profit
- $-54,147
- Equity at exit
- $35,561
- IRR
- -8.2%
- Equity multiple
- 0.39×
- Total profit
- $-40,994
- Equity at exit
- $20,621
Cash invested: $66,780 (down + closing). Projections, not guarantees.
Landlord ↔ Tenant lean methodology
- Overall (CITY)
- 0 Strongly Tenant-Friendly
- State New York
- 15 Strongly Tenant-Friendly · D+10
- County
- — inherits STATE
- City New York
- 0 Strongly Tenant-Friendly · D+34
ZIP-level market 11230
- Rents YoY
- 6.2%
- Active inventory
- 212
- Price-to-rent
- 8.1×
Monthly cashflow live
- Estimated rent
- $2,446 medium interval (Pro) →
- Mortgage (P&I)
- −$1,251
- Tax est. 1.5%
- −$298 /mo · $3,578/yr
- Insurance
- −$99
- Flood insurance flood zone
- −$66 /mo · $798/yr
- HOA est. from 2 same-building comps
- −$594
- Vacancy / Maint / Mgmt
- −$514
- Net cashflow
- $-377
Break-even live
Sensitivity live
| Price | -10% $-212 | -5% $-294 | +0% $-377 | +5% $-459 | +10% $-541 |
|---|---|---|---|---|---|
| Rent | -10% $-570 | -5% $-473 | +0% $-377 | +5% $-280 | +10% $-183 |
| Rate | -1.0pp $-257 | -0.5pp $-316 | base $-377 | +0.5pp $-438 | +1.0pp $-501 |
UW: 25.0% down · 7.5% · 30yr · 1.5% tax · 5.0% vac · 8.0% maint · 8.0% mgmt
Financing live
Cash to close
- Down payment
- $59,625
- Closing costs
- $7,155
- Reserves months
- —
- Total cash needed
- —
Loan-product check · same deal, 3 products live
Conventional
25% down · 7.5% · 30yr
- Down + closing
- —
- Monthly P&I
- —
- Monthly cashflow
- —
- DSCR
- —
- Eligible?
- —
Personal DTI + credit; lowest rate.
DSCR
20% down · 8.5% · 30yr
- Down + closing
- —
- Monthly P&I
- —
- Monthly cashflow
- —
- DSCR
- —
- Eligible?
- —
No personal income docs; deal must DSCR.
Hard money
10% down · 12.0% · 12mo
- Down + closing
- —
- Monthly P&I
- —
- Monthly cashflow
- —
- DSCR
- —
- Eligible?
- —
Short-term bridge; refi at stabilization.
Rent comps 3 comps
| Address | Beds | Baths | Sqft | Rent | $/sqft | DOM | Units | Dist |
|---|---|---|---|---|---|---|---|---|
| 540 Ocean Pkwy Unit Main Brooklyn, NY | 1.0 | 1.0 | 825 | $2,200 | $2.67 | 21d | 1 | 0.49mi |
| 540 Ocean Pkwy Unit 6H Brooklyn, NY | 1.0 | 1.0 | 1000 | $2,850 | $2.85 | 25d | 1 | 0.49mi |
| 22 Tehama St Unit 2 Fl Brooklyn, NY | 2.0 | 1.0 | 700 | $2,980 | $4.26 | 25d | 1 | 1.27mi |
HOA detail condo
- Monthly dues
- $0 · $0/yr
- Likely covers
- watersewerdoorman
- Assessments
- None detected in remarks — confirm with the listing agent.
Listing history 15 events
-
2026-06-21days on market $238,500 Active 24 DOM
-
2026-06-18days on market $238,500 Active 21 DOM
-
2026-06-17days on market $238,500 Active 20 DOM
-
2026-06-16days on market $238,500 Active 19 DOM
-
2026-06-15days on market $238,500 Active 18 DOM
-
2026-06-13days on market $238,500 Active 16 DOM
-
2026-06-10days on market $238,500 Active 12 DOM
-
2026-06-08days on market $238,500 Active 11 DOM
-
2026-06-08days on market $238,500 Active 10 DOM
-
2026-06-04days on market $238,500 Active 7 DOM
-
2026-06-03days on market $238,500 Active 6 DOM
-
2026-06-02days on market $238,500 Active 5 DOM
-
2026-06-01days on market $238,500 Active 4 DOM
-
2026-05-31remarks 673-char remark
-
2026-05-31days on market $238,500 Active 3 DOM
ⓘ Source: listings_history table (triggers on properties + properties_extension) + one-shot
backfill from property_details.listing_events for pre-trigger history.
Climate risk First Street
- Flood 7/10 Severe FEMA zone X (unshaded) · 77% chance over 30 yrs
- Wildfire 1/10 Low
- Heat 6/10 Major 7 d/yr ≥97°F today · 16 d/yr by 30 yrs out
- Wind 6/10 Major 64% chance of damaging wind over 30 yrs
- Air quality 4/10 Moderate 5 unhealthy d/yr today · 7 by 30 yrs out
Nearby sold comps map
Loading sold comps map…
Walkable amenities ~0.75 mi
Loading nearby amenities…
Taxation est. · year 1
- Rental income
- $29,347
- − Mortgage interest
- −$13,360
- − Property taxes
- −$3,578
- − Insurance
- −$1,990
- − Repairs & maintenance
- −$2,348
- − Management
- −$2,348
- − HOA
- −$7,128
- − Depreciation
- −$6,938
- Taxable loss
- −$8,342
- Est. tax savings @ 24.0%
- +$2,002
- After-tax cash flow
- $-2,518/yr
For passive investors: Depreciation is non-cash, so a rental often shows a tax loss while cash-flowing — sheltering income. Rental losses are passive: they offset passive income freely, and up to $25,000/yr can offset ordinary (W-2) income if you actively participate and your MAGI is under $100k (phasing out to $0 by $150k); unused losses carry forward. On sale, claimed depreciation is recaptured at up to 25%, and gains may owe capital-gains tax (a 1031 exchange can defer both). Figures are a year-1 estimate at your 24.0% rate — not tax advice; consult a CPA.
Condition & rehab AI · 12 photos
This property requires moderate renovations to improve its condition and increase its value. Upgrading the kitchen and bathroom, refinishing the flooring, and repainting the exterior will significantly enhance its appeal.
Repairs flagged
- Major Kitchen cabinets — The kitchen cabinets are outdated and need replacement.
- Major Bathroom fixtures — The bathroom lacks modern fixtures and needs an update.
- Moderate Flooring — The hardwood flooring shows signs of wear and could benefit from refinishing or replacement.
- Major Exterior siding — The exterior siding is in poor condition and needs repainting or replacement.
- Moderate Windows — The windows may need new hardware or replacement to improve energy efficiency and appearance.
- Minor HVAC system — The HVAC system appears functional but may need a tune-up to ensure optimal performance.
Value-add opportunities
- Both Upgrading the kitchen cabinets and appliances — A modern kitchen will attract more buyers and renters.
- Both Updating the bathroom fixtures — A modern bathroom will enhance the home's appeal and functionality.
- Both Refinishing or replacing the hardwood flooring — New flooring will improve the home's appearance and increase its value.
- Both Repainting the exterior siding — A fresh coat of paint will improve the home's curb appeal and increase its value.
- Both Upgrading the HVAC system — An efficient HVAC system will improve the home's comfort and energy efficiency, attracting more buyers and renters.
Renovation cost estimate screening
| Repair item | Severity | Est. cost |
|---|---|---|
| Kitchen cabinets · The kitchen cabinets are outdated and need replacement. | Major | $15,000–50,000 |
| Bathroom fixtures · The bathroom lacks modern fixtures and needs an update. | Major | $15,000–50,000 |
| Flooring · The hardwood flooring shows signs of wear and could benefit from refinishing or replacement. | Moderate | $3,000–15,000 |
| Exterior siding · The exterior siding is in poor condition and needs repainting or replacement. | Major | $15,000–50,000 |
| Windows · The windows may need new hardware or replacement to improve energy efficiency and appearance. | Moderate | $3,000–15,000 |
| HVAC system · The HVAC system appears functional but may need a tune-up to ensure optimal performance. | Minor | $500–3,000 |
| Total estimated repair cost · 6 items | $51,500–183,000 |
Value-add ROI direction
- Both Upgrading the kitchen cabinets and appliances — A modern kitchen will attract more buyers and renters. ↑
- Both Updating the bathroom fixtures — A modern bathroom will enhance the home's appeal and functionality. ↑
- Both Refinishing or replacing the hardwood flooring — New flooring will improve the home's appearance and increase its value. ↑
- Both Repainting the exterior siding — A fresh coat of paint will improve the home's curb appeal and increase its value. ↑
- Both Upgrading the HVAC system — An efficient HVAC system will improve the home's comfort and energy efficiency, attracting more buyers and renters. ↑
ⓘ Cost ranges are severity-bucket heuristics (US national rule-of-thumb). Get contractor quotes + a written scope before underwriting a rehab budget.
Schools (NCES district)
No district data.
Livability — New York
- Score
- 75/100
- State rank
- #268
- US rank
- #4188
Category grades
Schools grade is shown separately in the Schools card above.
Census & demographics
- Census place
- New York, NY
- County
- Kings County · 2,614,986 people
- City population
- 7,731,280
- Metro
- New York-Newark-Jersey City, NY-NJ-PA
- Population (ZIP)
- 86,978
- Household income
- $70,027
- Rent vs Own
- Severe rent burden
- 6887.0
Population outlook (Kings County) Hauer SSP2
- Today (2025)
- 2,847,441 people
- By 2030
- 2,937,006 · +3.1%
- By 2040
- 3,095,491 · +8.7%
- By 2050
- 3,228,968 · +13.4%
- By 2075
- 3,321,723 · +16.7%
- By 2100
- 3,111,387 · +9.3%
Race, ethnicity, and origin ACS 2023
- Neighborhood character
- Diverse neighborhood (Simpson 0.62)
- Race & ethnicity
- White 57% Asian 17% Hispanic / Latino 13% Black 8% Two or more races 6%
- Hispanic origin (detail)
- Mexican 4% Puerto Rican 3% Dominican 1%
- Common ancestry
- Scotch-Irish 5% Subsaharan African 4% Romanian 2%
- Foreign-born
- 41% · Canada, China, Jamaica
- Languages at home
- 45% English-only · Russian/Polish/Slavic 16% Other Indo-European 10% Spanish 10%
Political lean MEDSL · Kings
- 2024 margin
- Solid D (+44.0) · D 72.0% · R 28.0%
- 2008→2024 swing
- -15.5pp toward R · 2008: 59.4pp · 2024: 44.0pp
- All cycles
- 2024: D+44.0 2020: D+54.8 2016: D+61.8 2012: D+63.9 2008: D+59.4
Not yet ingested
- Civics
- —
Market trends
- HPI YoY
- ▼ -606.25%
- Current HPI
- 314.7697
- Rent YoY
- ▲ 6.17%
- Metro
- New York-Newark-Jersey City, NY-NJ-PA
- State GDP YoY
- ▲ 2.60%
- F500 in state
- 92
Industry mix (Fortune 500 HQ in NY)
| Industry | F500 HQs | Revenue |
|---|---|---|
| Financial Services | 10 | $950B |
|
||
| Consumer Goods | 9 | $162B |
|
||
| Insurance | 4 | $225B |
|
||
| Telecommunications | 2 | $144B |
|
||
| Pharmaceuticals | 2 | $112B |
|
||
| Media / Entertainment | 2 | $69B |
|
||
Price history
+0.0% since first listed2 events — show timeline
- 2026-05-28 Listed $238,500 RLS at REBNY
- 2026-05-20 Listed $238,500 OneKey® MLS as Distributed by MLS Grid
Cash-flow waterfall
monthlySold comps — $/sqft
last 12 mo · ≤1 miLoading sold comps…