 🏗️ New Construction
Clayton Adrenaline B Plan · Holland, OH
Flood risk 4/10 · Minor
- FEMA flood zone
- X (unshaded)
- Chance of flooding over 30 yrs
- 0.2%
- Est. flood insurance / yr
- $507 – $1,088
Fire risk 1/10 · Minimal
- Est. fire insurance / yr
- $713 – $1,323
Heat risk 3/10 · Minor
- Hot days now (above 99°F)
- 7 days/yr
- Hot days in 30 yrs
- 16 days/yr
Wind risk 2/10 · Minimal
- Chance of severe wind over 30 yrs
- —
Air-quality risk 2/10 · Minimal
- Unhealthy air days now
- 1 days/yr
- Unhealthy air days in 30 yrs
- 1 days/yr
Risk factors via First Street. Map © Google.
Why this score? — see what drove the B grade
The composite is a weighted blend of 9 inputs, each scored 0–100. Each bar is that input's sub-score; the figure is the points it added to the 100-point composite (weight × sub-score).
- Cash flow +30.0/30.0
- 1% rule +10.0/10.0
- DSCR +10.0/10.0
- ARV discount +7.5/15.0
- Schools +4.5/10.0
- Livability +4.0/5.0
- Condition / age +4.0/5.0
- Rent growth +3.1/5.0
- Appreciation +0.0/10.0
$49,900
🖨 Deal sheet 📄 Offer letter ✓ Due diligence
Listing remarks
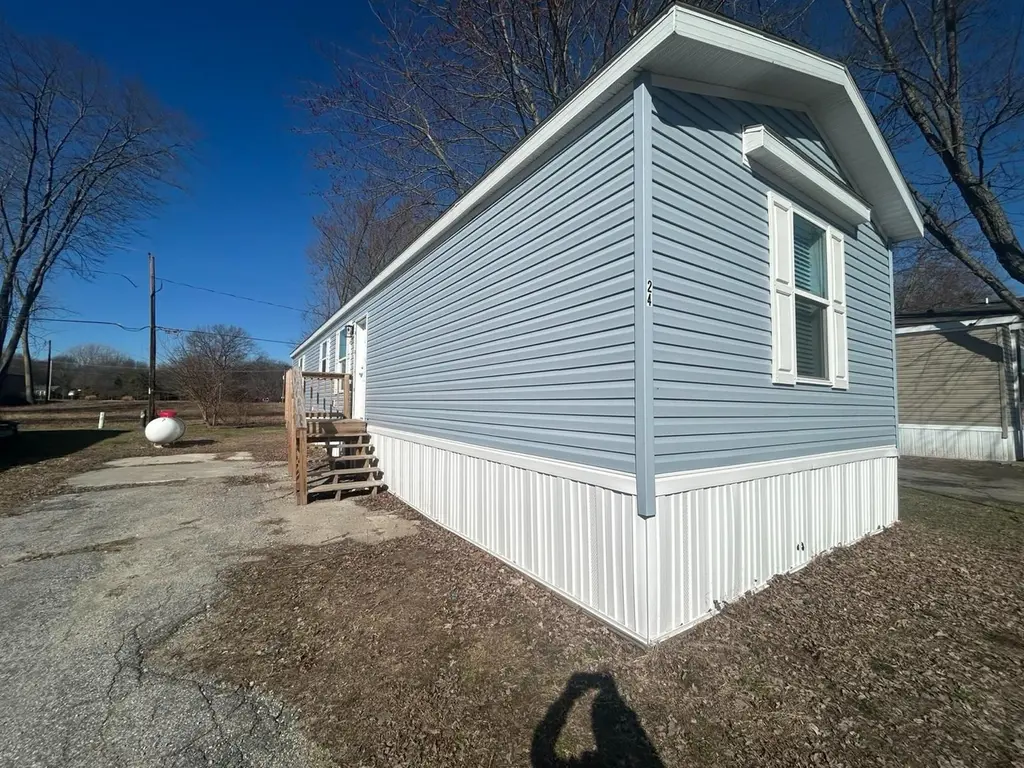
Welcome to this 3-bedroom, 2-bath home in Royal Village, Toledo, Ohio. With 990 sq ft of thoughtfully designed space, the Clayton Adrenaline model features an open-concept living, kitchen, and dining area, perfect for everyday living. The primary bedroom includes a private bath, while two additional bedrooms offer flexibility for guests or a home office. With modern finishes and low-maintenance living, this move-in ready home is a great opportunity in a convenient, well-maintained community.
Key facts
- Listed 64 days
Property features AI
Finance
- Other: Address: Clayton Adrenaline B Plan, Toledo, OH 43615; Listing status: Active
- Financial info: List price $49,900
Exterior
- Utilities: Forced air heating
- Home design: Plan: Clayton Adrenaline B; New construction plan
- Construction: Living area approximately 990; Shake roof
- Exterior features: Shake roof
Interior
- Bedrooms: 3 bedrooms
- Bathrooms: 2 full bathrooms
- Heating & cooling: Forced air heating
- Interior features: Forced air heating
Neighborhood map
What this means for you Summary
Snapshot
- This is a 3-bed/2.0-bath single-family listed at $50k. Condition is rated good.
Deal economics
- At list price, monthly cash flow is $664 ($8k/yr) — positive.
- The deal already cash-flows at list — no discount required.
- Meets the 1% rule at list price ($1k rent vs $50k).
- Recommended offer: $47k (6.0% below list) — sets the bar for market timing.
- Cap rate 22.3% vs local median 2.4% in Holland — top-decile yield for the area; either an underpriced asset or a hidden risk that comps aren't pricing in. Stress-test before assuming the spread holds.
Location & tenants
- Location reads 80/100 on livability (#110 in OH, #1,661 nationally) — a professional / high-income tenant draw. Strengths: cost of living A+, housing A+, health & safety A+; Watch: crime C-, commute F.
- Springfield Local (suburban): math 47% / reading 57% proficiency, ranked #404 of 656 in OH (top 62%) — acceptable for families but not a draw, mixed tenant base, ~2y average lease.
- Market conditions: Rents rising (+2.6%/yr); 114 active listings in the ZIP; 6 comparable units currently listed for rent nearby; rentals at typical pace (median 14d on market — plan ~3-4 weeks tenant-placement turnaround); 415 units permitted in Lucas County in 2024 (122 in 5+ unit buildings).
Forward outlook
- Local home prices are declining (-3.0%/yr); year-one equity from $345 of loan paydown is wiped out by about $1k of value loss. Plan a longer hold.
- Lucas County population projected at -16% by 2050 — secular population decline; favor cash flow + early exit over multi-decade hold.
- At projected returns (-3.0% appreciation + 2.6% rent growth), your $14k cash investment doubles in ~2 years — after that, you're playing with house money.
Negotiation context
- It's been on market 64 days — a 6% lower offer ($47k) is reasonable based on typical stale-listing flexibility.
Questions for the listing agent
- It's been on market 64 days. Have you received any prior offers? Is the seller open to a 6% concession, seller financing, or rate buy-down credit?
- Why hasn't it sold? Are there any deal-killer items the seller is aware of (foundation, flood, title, zoning, code violations)?
- Is there a deadline driving the sale (1031 exchange, divorce, estate, relocation)? That informs how much negotiation room exists.
- Schools are B-rated — typically a magnet for longer-tenancy family renters. What's the average tenant stay here, and is there a school-zone premium baked into asking?
- What's the average days-on-market for RENTAL listings here right now (not sales)? A rising rental-DOM trend means longer vacancies and softer asking-rent achievability than the comps imply.
- What's the recent tenant-quality profile in this submarket — average credit score on applications, eviction rate, late-payment / NSF rate, and stable-employment percentage? A property-management company in the area should have these aggregated.
- How much new for-sale + rental construction is in the pipeline within 1–3 miles? Heavy new supply typically softens prices + rents 12–24 months out; constrained supply supports both.
Investment metrics
- 1% rule
- 2.56% ✓
- Cap rate
- 22.27%
- Cash-on-cash
- 57.06%
- DSCR
- 3.54
- GRM
- 3.3
CMA / ARV
No comps found within radius.
Projected returns pro-forma
-3.0% appreciation · 2.59% rent growth · sell at horizon
- IRR
- 55.1%
- Equity multiple
- 3.41×
- Total profit
- $33,726
- Equity at exit
- $7,440
- IRR
- 60.0%
- Equity multiple
- 6.85×
- Total profit
- $81,801
- Equity at exit
- $4,314
Cash invested: $13,972 (down + closing). Projections, not guarantees.
Landlord ↔ Tenant lean methodology
- Overall (STATE)
- 73 Landlord-Friendly
- State Ohio
- 73 Landlord-Friendly · R+6
- County
- — inherits STATE
- City
- — inherits STATE
ZIP-level market 43615
- Home prices YoY
- -31.9%
- Rents YoY
- 2.6%
- Active inventory
- 114
- Price-to-rent
- 3.3×
Monthly cashflow live
- Estimated rent
- $1,278 high interval (Pro) →
- Mortgage (P&I)
- −$262
- Tax est. 1.5%
- −$62 /mo · $748/yr
- Insurance
- −$21
- HOA
- −$0
- Vacancy / Maint / Mgmt
- −$268
- Net cashflow
- $664
Break-even live
UW: 25.0% down · 7.5% · 30yr · 1.5% tax · 5.0% vac · 8.0% maint · 8.0% mgmt
Financing live
Cash to close
- Down payment
- $12,475
- Closing costs
- $1,497
- Reserves months
- —
- Total cash needed
- —
Loan-product check · same deal, 3 products live
Conventional
25% down · 7.5% · 30yr
- Down + closing
- —
- Monthly P&I
- —
- Monthly cashflow
- —
- DSCR
- —
- Eligible?
- —
Personal DTI + credit; lowest rate.
DSCR
20% down · 8.5% · 30yr
- Down + closing
- —
- Monthly P&I
- —
- Monthly cashflow
- —
- DSCR
- —
- Eligible?
- —
No personal income docs; deal must DSCR.
Hard money
10% down · 12.0% · 12mo
- Down + closing
- —
- Monthly P&I
- —
- Monthly cashflow
- —
- DSCR
- —
- Eligible?
- —
Short-term bridge; refi at stabilization.
Rent comps 6 comps
| Address | Beds | Baths | Sqft | Rent | $/sqft | DOM | Units | Dist |
|---|---|---|---|---|---|---|---|---|
| 1210 Country View Pl Toledo, OH | 2.0 | 1.0–2.0 | 966 | $1,130 | $1.17 | 14d | 1 | 0.59mi |
| 2150 N McCord Rd Toledo, OH | 1.0–2.0 | 1.0 | 765 | $1,315 | $1.72 | 14d | 6 | 1.04mi |
| 1800 N McCord Rd Toledo, OH | 2.0 | 1.0 | 934 | $900 | $0.96 | 14d | 1 | 1.07mi |
| 6633 W Bancroft St Toledo, OH | 1.0–3.0 | 1.0 | 941 | $1,179 | $1.25 | 14d | 1 | 1.08mi |
| 2130 Country Trace Pl Toledo, OH | 2.0 | 1.0–2.0 | 917 | $1,050 | $1.14 | 14d | 1 | 1.18mi |
| 6535 Dorr St Toledo, OH | 1.0–2.0 | 1.0–2.0 | 895 | $1,000 | $1.12 | 21d | 1 | 1.19mi |
Listing history 14 events
-
2026-06-18days on market $49,900 Active 64 DOM
-
2026-06-17days on market $49,900 Active 63 DOM
-
2026-06-16days on market $49,900 Active 62 DOM
-
2026-06-15days on market $49,900 Active 61 DOM
-
2026-06-14days on market $49,900 Active 59 DOM
-
2026-06-10days on market $49,900 Active 56 DOM
-
2026-06-09days on market $49,900 Active 55 DOM
-
2026-06-08days on market $49,900 Active 54 DOM
-
2026-06-07days on market $49,900 Active 53 DOM
-
2026-06-03days on market $49,900 Active 49 DOM
-
2026-06-02days on market $49,900 Active 48 DOM
-
2026-06-01days on market $49,900 Active 47 DOM
-
2026-05-31days on market $49,900 Active 46 DOM
-
2026-05-30days on market $49,900 Active 45 DOM
ⓘ Source: listings_history table (triggers on properties + properties_extension) + one-shot
backfill from property_details.listing_events for pre-trigger history.
Climate risk First Street
- Flood 4/10 Moderate FEMA zone X (unshaded) · 20% chance over 30 yrs
- Wildfire 1/10 Low
- Heat 3/10 Moderate 7 d/yr ≥99°F today · 16 d/yr by 30 yrs out
- Wind 2/10 Low
- Air quality 2/10 Low 1 unhealthy d/yr today · 1 by 30 yrs out
Nearby sold comps map
Loading sold comps map…
Walkable amenities ~0.75 mi
Loading nearby amenities…
Taxation est. · year 1
- Rental income
- $15,331
- − Mortgage interest
- −$2,795
- − Property taxes
- −$748
- − Insurance
- −$250
- − Repairs & maintenance
- −$1,226
- − Management
- −$1,226
- − Depreciation
- −$1,452
- Taxable income
- $7,633
- Est. tax owed @ 24.0%
- −$1,832
- After-tax cash flow
- $6,141/yr
For passive investors: Depreciation is non-cash, so a rental often shows a tax loss while cash-flowing — sheltering income. Rental losses are passive: they offset passive income freely, and up to $25,000/yr can offset ordinary (W-2) income if you actively participate and your MAGI is under $100k (phasing out to $0 by $150k); unused losses carry forward. On sale, claimed depreciation is recaptured at up to 25%, and gains may owe capital-gains tax (a 1031 exchange can defer both). Figures are a year-1 estimate at your 24.0% rate — not tax advice; consult a CPA.
Condition & rehab AI · 10 photos
This move-in ready home in Royal Village, Toledo, Ohio, features a modern kitchen, two bathrooms, and a well-maintained exterior. It is in good condition with minimal maintenance required.
Value-add opportunities
- Both Painting exterior siding — Fresh paint can enhance curb appeal and home value
- Both Landscaping improvements — Enhanced landscaping can increase curb appeal and home value
- Resale Kitchen appliances — Upgraded appliances can attract more buyers
- Resale Bathroom fixtures — Modern fixtures can attract more buyers
Renovation cost estimate screening
Value-add ROI direction
- Both Painting exterior siding — Fresh paint can enhance curb appeal and home value ↑
- Both Landscaping improvements — Enhanced landscaping can increase curb appeal and home value ↑
- Resale Kitchen appliances — Upgraded appliances can attract more buyers ↑
- Resale Bathroom fixtures — Modern fixtures can attract more buyers ↑
ⓘ Cost ranges are severity-bucket heuristics (US national rule-of-thumb). Get contractor quotes + a written scope before underwriting a rehab budget.
Schools (NCES district)
- District
- Springfield Local
- NCES district ID
- 3904822
- Math proficiency
- 47% ▼ -17.00%
- Reading proficiency
- 57% ▼ -11.00%
- Median HH income
- $54,807
- Composite
- 44.87/100
- National rank
- #2719
- State rank
- #404 of 656 in OH
Livability — Holland
- Score
- 80/100
- State rank
- #110
- US rank
- #1661
Category grades
Schools grade is shown separately in the Schools card above.
Census & demographics
- County
- Lucas County · 380,724 people
- City population
- 16,207
- Metro
- Toledo, OH
- Population (ZIP)
- 40,146
- Household income
- $57,713
- Rent vs Own
- Severe rent burden
- 1683.0
Population outlook (Lucas County) Hauer SSP2
- Today (2025)
- 420,751 people
- By 2030
- 410,187 · -2.5%
- By 2040
- 384,019 · -8.7%
- By 2050
- 355,125 · -15.6%
- By 2075
- 291,683 · -30.7%
- By 2100
- 233,670 · -44.5%
Race, ethnicity, and origin ACS 2023
- Neighborhood character
- Majority White (62%)
- Race & ethnicity
- White 62% Black 26% Two or more races 6% Hispanic / Latino 4% Asian 3%
- Common ancestry
- Romanian 7% Lithuanian 3% Slovak 2%
- Foreign-born
- 5% · China, Canada
- Languages at home
- 93% English-only · Arabic 2% Spanish 1% Chinese 1%
Political lean MEDSL · Lucas
- 2024 margin
- D (+12.6) · D 55.8% · R 43.2%
- 2008→2024 swing
- -18.9pp toward R · 2008: 31.4pp · 2024: 12.6pp
- All cycles
- 2024: D+12.6 2020: D+16.8 2016: D+17.4 2012: D+30.4 2008: D+31.4
Not yet ingested
- Civics
- —
Market trends
- HPI YoY
- ▼ -96.44%
- Current HPI
- 205.95
- Rent YoY
- ▲ 2.59%
- Metro
- Toledo, OH
- State GDP YoY
- ▲ 1.98%
- F500 in state
- 48
Industry mix (Fortune 500 HQ in OH)
| Industry | F500 HQs | Revenue |
|---|---|---|
| Insurance | 3 | $145B |
|
||
| Industrial Machinery | 3 | $49B |
|
||
| Financial Services | 3 | $24B |
|
||
| Consumer Goods | 2 | $93B |
|
||
| Aerospace / Defense | 2 | $47B |
|
||
| Utilities | 2 | $33B |
|
||
Cash-flow waterfall
monthlySold comps — $/sqft
last 12 mo · ≤1 miLoading sold comps…