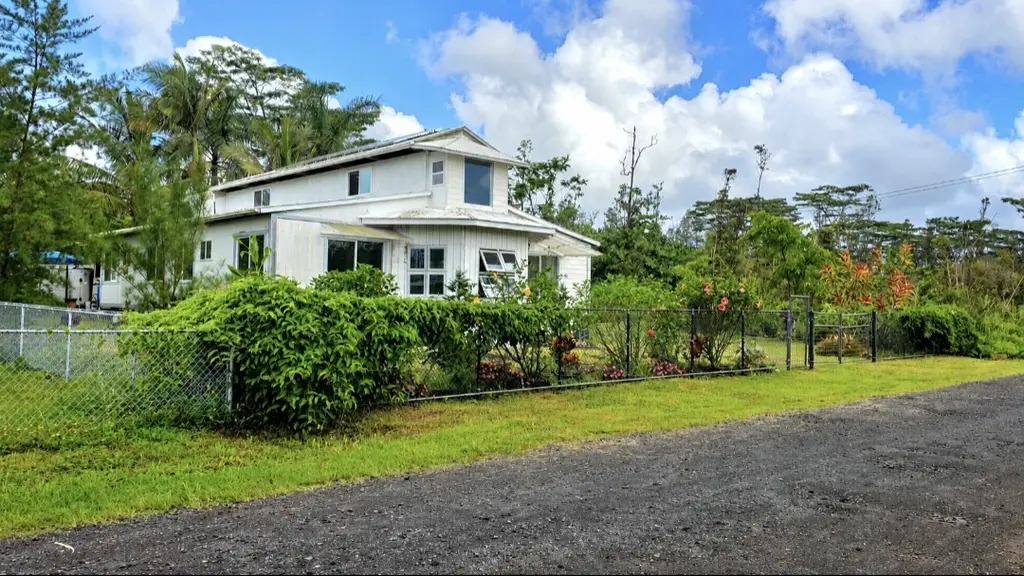
16-2122 Bamboo Dr · Ainaloa, HI
Flood risk 9/10 · Severe
- FEMA flood zone
- X (unshaded)
- Chance of flooding over 30 yrs
- 0.99%
- Est. flood insurance / yr
- $507 – $1,088
Fire risk No data
- Est. fire insurance / yr
- —
Heat risk No data
- Hot days now (above threshold)
- —
- Hot days in 30 yrs
- —
Wind risk No data
- Chance of severe wind over 30 yrs
- —
Air-quality risk 1/10 · Minimal
- Unhealthy air days now
- —
- Unhealthy air days in 30 yrs
- —
Risk factors via First Street. Map © Google.
Why this score? — see what drove the D grade
The composite is a weighted blend of 9 inputs, each scored 0–100. Each bar is that input's sub-score; the figure is the points it added to the 100-point composite (weight × sub-score).
- Cash flow +14.8/30.0
- ARV discount +7.5/15.0
- DSCR +4.5/10.0
- 1% rule +4.2/10.0
- Schools +3.7/10.0
- Livability +3.0/5.0
- Rent growth +2.5/5.0
- Condition / age +2.5/5.0
- Appreciation +0.0/10.0
$299,000
🖨 Deal sheet (PDF) 📄 Offer letter ✓ Due diligence
Listing remarks
Rare opportunity to purchase two connected lots in Ainaloa offering space, privacy, and incredible potential. Included in the sale is the adjoining rear parcel located on Orchid Drive, creating approximately 24,000 sqft of combined land with access from both Bamboo Drive and Orchid Drive. The property features a large off-grid unfinished home with a completed kitchen already in place, spacious living areas, and a beautiful oversized lanai perfect for enjoying the tropical surroundings. Part of the home has been designed with separate living potential, including an area prepped for a future wet bar or kitchenette setup, creating flexibility for extended family living or possible rental oppor
Key facts
- Completed kitchen
- Oversized lanai
- 0.28 acre lot
Tags
Property features AI
Finance
- Other: Not in use as a short-term vacation rental
- HOA & community: Association fee of $25; no common area expenses
Exterior
- Utilities: Photovoltaic power; Electricity available; Phone available; Catchment water; Cesspool sewer; No solid waste disposal service
- Home design: Property is attached; Full ownership (fee simple); Zoned A-1A; Lava zone 3
- Construction: Unpermitted improvements reported
- Exterior features: Wire fencing; Fairly level topography; Interior lot; Road/street frontage; Private roads
Interior
- Bathrooms: Three full bathrooms
- Interior features: 3 total bathrooms (all full)
Neighborhood map
What this means for you Summary
Snapshot
- This is a 5-bed/3.0-bath single-family listed at $299k.
Deal economics
- At list price, monthly cash flow is $15 ($183/yr) — positive.
- The deal already cash-flows at list — no discount required.
- To meet the 1% rule (rent ≥ 1% of price), the offer needs to be $275k (8.0% below list).
- Recommended offer: $275k (8.0% below list) — sets the bar for 1% rule.
- Cap rate 6.6% vs local median 3.8% in Ainaloa — top-decile yield for the area; either an underpriced asset or a hidden risk that comps aren't pricing in. Stress-test before assuming the spread holds.
Location & tenants
- Location reads 60/100 on livability (#84 in HI) — a middle-class / working-renter tenant base. Strengths: housing A+, crime A-; Watch: health & safety C-, cost of living D+, amenities F.
- Hawaii Department Of Education (suburban): math 32% / reading 50% proficiency, ranked #1 of 1 in HI (top 100%) — families likely to look elsewhere, expect single-tenant / working-renter base with shorter leases.
- Zoned schools: Pahoa Elementary School (math 12% / reading 22%, grade F, #166 of 183 statewide, top 92%, 377 students, 80% FRL); Pahoa High & Intermediate School (math 17% / reading 42%, grade F, #35 of 43 statewide, top 86%, 723 students, 74% FRL) — zoned schools average 77% FRL vs 39% district-wide (38 pts higher); higher-poverty schools than district average — tighter screening recommended.
- Zoned-school proficiency averages 23% at this address vs 41% district-wide (-18 pts) — the specific schools serving this property underperform the Hawaii Department Of Education average; the district grade overstates school quality for this exact location.
- Market conditions: 388 active listings in the ZIP; 982 units permitted in Hawaii County in 2024 (0 in 5+ unit buildings).
Forward outlook
- Local home prices are declining (-3.0%/yr); year-one equity from $2k of loan paydown is wiped out by about $9k of value loss. Plan a longer hold.
- Hawaii County population projected at +24% by 2050 — long-run rental-demand tailwind backs the buy-and-hold thesis.
Negotiation context
- It's been on market 24 days — a 2% lower offer ($295k) is reasonable based on typical stale-listing flexibility.
- 3 sale attempts; this cycle's ask has dropped $16k (5%) from the opening price — seller is motivated, your offer sets the floor, not the list.
- Current owner paid $6k; list at $299k implies a 4883% gain — meaningful room to come down on a strong offer.
Risks & watch-outs
- Watch-outs: flood insurance adds $66/mo.
- Climate carrying-cost: severe flood risk — expect insurance premiums to compound above CPI over the hold.
Questions for the listing agent
- What's the actual annual flood-insurance premium (NFIP or private), and is the property in a SFHA with mandatory coverage?
- What does the HOA fee cover, when was the last increase, and are there any pending special assessments or reserve-fund shortfalls?
- Is there a deadline driving the sale (1031 exchange, divorce, estate, relocation)? That informs how much negotiation room exists.
- Schools are F-rated, which usually means shorter tenancies and higher turnover. Who's the typical renter profile here, and what's been the actual vacancy rate?
- The area grade is low — what's the realistic commute time and amenity access for the typical tenant pool here? Any planned neighborhood developments (good or bad) we should know about?
- What's the average days-on-market for RENTAL listings here right now (not sales)? A rising rental-DOM trend means longer vacancies and softer asking-rent achievability than the comps imply.
- What's the recent tenant-quality profile in this submarket — average credit score on applications, eviction rate, late-payment / NSF rate, and stable-employment percentage? A property-management company in the area should have these aggregated.
- How much new for-sale + rental construction is in the pipeline within 1–3 miles? Heavy new supply typically softens prices + rents 12–24 months out; constrained supply supports both.
Investment metrics
- 1% rule
- 0.92% ✗
- Cap rate
- 6.62%
- Cash-on-cash
- 1.17%
- DSCR
- 1.05
- GRM
- 9.1
CMA / ARV
No comps found within radius.
Projected returns pro-forma
-3.0% appreciation · 3.0% rent growth · sell at horizon
- IRR
- -15.9%
- Equity multiple
- 0.43×
- Total profit
- $-47,381
- Equity at exit
- $44,582
- IRR
- -7.5%
- Equity multiple
- 0.53×
- Total profit
- $-39,611
- Equity at exit
- $25,852
Cash invested: $83,720 (down + closing). Projections, not guarantees.
Landlord ↔ Tenant lean methodology
- Overall (STATE)
- 37 Tenant-Leaning
- State Hawaii
- 37 Tenant-Leaning · D+13
- County
- — inherits STATE
- City
- — inherits STATE
ZIP-level market 96778
- Home prices YoY
- -15.3%
- Active inventory
- 388
- Price-to-rent
- 9.1×
Monthly cashflow live
- Estimated rent
- $2,751 medium interval (Pro) →
- Mortgage (P&I)
- −$1,568
- Tax est. 1.5%
- −$374 /mo · $4,485/yr
- Insurance
- −$125
- Flood insurance flood zone
- −$66 /mo · $798/yr
- HOA
- −$25
- Vacancy / Maint / Mgmt
- −$578
- Net cashflow
- $15
Break-even live
Sensitivity live
| Price | -10% $222 | -5% $119 | +0% $15 | +5% $-88 | +10% $-191 |
|---|---|---|---|---|---|
| Rent | -10% $-202 | -5% $-93 | +0% $15 | +5% $124 | +10% $233 |
| Rate | -1.0pp $166 | -0.5pp $91 | base $15 | +0.5pp $-62 | +1.0pp $-141 |
UW: 25.0% down · 7.5% · 30yr · 1.5% tax · 5.0% vac · 8.0% maint · 8.0% mgmt
Financing live
Cash to close
- Down payment
- $74,750
- Closing costs
- $8,970
- Reserves months
- —
- Total cash needed
- —
Loan-product check · same deal, 3 products live
Conventional
25% down · 7.5% · 30yr
- Down + closing
- —
- Monthly P&I
- —
- Monthly cashflow
- —
- DSCR
- —
- Eligible?
- —
Personal DTI + credit; lowest rate.
DSCR
20% down · 8.5% · 30yr
- Down + closing
- —
- Monthly P&I
- —
- Monthly cashflow
- —
- DSCR
- —
- Eligible?
- —
No personal income docs; deal must DSCR.
Hard money
10% down · 12.0% · 12mo
- Down + closing
- —
- Monthly P&I
- —
- Monthly cashflow
- —
- DSCR
- —
- Eligible?
- —
Short-term bridge; refi at stabilization.
HOA detail
- Monthly dues
- $25 · $300/yr
Listing history 23 events
-
2026-06-21days on market $299,000 Active 24 DOM
-
2026-06-18days on market $299,000 Active 21 DOM
-
2026-06-18price $299,000 Active 20 DOM
-
2026-06-17days on market $315,000 Active 20 DOM
-
2026-06-16days on market $315,000 Active 19 DOM
-
2026-06-15days on market $315,000 Active 18 DOM
-
2026-06-13days on market $315,000 Active 16 DOM
-
2026-06-13days on market $315,000 Active 15 DOM
-
2026-06-10days on market $315,000 Active 13 DOM
-
2026-06-09days on market $315,000 Active 12 DOM
-
2026-06-08days on market $315,000 Active 11 DOM
-
2026-06-07days on market $315,000 Active 10 DOM
-
2026-06-05days on market $315,000 Active 7 DOM
-
2026-06-03days on market $315,000 Active 6 DOM
-
2026-06-02days on market $315,000 Active 5 DOM
-
2026-06-01days on market $315,000 Active 4 DOM
-
2026-05-31days on market $315,000 Active 3 DOM
-
2026-05-23$315,000 Active
-
2026-03-13historical
-
2025-12-15historical Active Under Contract
-
2025-11-29status Active
-
2025-09-10$260,000 Active
-
1985-05-01soldstatus $6,000
ⓘ Source: listings_history table (triggers on properties + properties_extension) + one-shot
backfill from property_details.listing_events for pre-trigger history.
Climate risk First Street
- Flood 9/10 Extreme FEMA zone X (unshaded) · 99% chance over 30 yrs
- Air quality 1/10 Low
Nearby sold comps map
Loading sold comps map…
Walkable amenities ~0.75 mi
Loading nearby amenities…
Taxation est. · year 1
- Rental income
- $33,008
- − Mortgage interest
- −$16,749
- − Property taxes
- −$4,485
- − Insurance
- −$2,292
- − Repairs & maintenance
- −$2,641
- − Management
- −$2,641
- − HOA
- −$300
- − Depreciation
- −$8,698
- Taxable loss
- −$4,797
- Est. tax savings @ 24.0%
- +$1,151
- After-tax cash flow
- $1,334/yr
For passive investors: Depreciation is non-cash, so a rental often shows a tax loss while cash-flowing — sheltering income. Rental losses are passive: they offset passive income freely, and up to $25,000/yr can offset ordinary (W-2) income if you actively participate and your MAGI is under $100k (phasing out to $0 by $150k); unused losses carry forward. On sale, claimed depreciation is recaptured at up to 25%, and gains may owe capital-gains tax (a 1031 exchange can defer both). Figures are a year-1 estimate at your 24.0% rate — not tax advice; consult a CPA.
Schools (NCES district)
- District
- Hawaii Department Of Education
- NCES district ID
- 1500030
- Math proficiency
- 32% ▼ -10.00%
- Reading proficiency
- 50% ▼ -3.00%
- Median HH income
- $69,005
- Composite
- 37.07/100
- National rank
- #4504
- State rank
- #1 of 1 in HI
Livability — Ainaloa
- Score
- 60/100
- State rank
- #84
- US rank
- #18581
Category grades
Schools grade is shown separately in the Schools card above.
Census & demographics
- Census place
- Ainaloa, HI
- Population (ZIP)
- 14,225
Population outlook (Hawaii County) Hauer SSP2
- Today (2025)
- 220,733 people
- By 2030
- 232,156 · +5.2%
- By 2040
- 252,486 · +14.4%
- By 2050
- 272,703 · +23.5%
- By 2075
- 332,113 · +50.5%
- By 2100
- 398,342 · +80.5%
Race, ethnicity, and origin ACS 2023
- Neighborhood character
- Highly diverse neighborhood (Simpson 0.82)
- Race & ethnicity
- White 37% Two or more races 30% Hispanic / Latino 15% Pacific Islander 15% Asian 12%
- Hispanic origin (detail)
- Mexican 4% Puerto Rican 9%
- Common ancestry
- Russian 7% Italian 3% Romanian 3%
- Foreign-born
- 12% · Canada, Vietnam
- Languages at home
- 77% English-only · Other Asian/Pacific 11% Tagalog/Filipino 1% Russian/Polish/Slavic 1%
Political lean MEDSL · Hawaii
- 2024 margin
- Strong D (+28.3) · D 63.0% · R 34.7% · Other 2.3%
- 2008→2024 swing
- -25.4pp toward R · 2008: 53.7pp · 2024: 28.3pp
- All cycles
- 2024: D+28.3 2020: D+36.2 2016: D+36.6 2012: D+51.3 2008: D+53.7
Not yet ingested
- Civics
- —
Market trends
- HPI YoY
- ▼ -31.52%
- Current HPI
- 173.8168
- Rent YoY
- —
- Metro
- —
- State GDP YoY
- —
- F500 in state
- 0
Price history
+5150.0% since first listed6 events — show timeline
- 2026-05-23 Listed $315,000 HI Information Service
- 2026-03-13 Listing Removed — HI Information Service
- 2025-12-15 Contingent — HI Information Service
- 2025-11-29 Relisted — HI Information Service
- 2025-09-10 Listed $260,000 HI Information Service
- 1985-05-01 Sold (Public Records) $6,000 Public Records
Property tax history
+5.6%/yrLatest (2025): $376 · +7.7% YoY. Source: county tax records.
Cash-flow waterfall
monthlySold comps — $/sqft
last 12 mo · ≤1 miLoading sold comps…