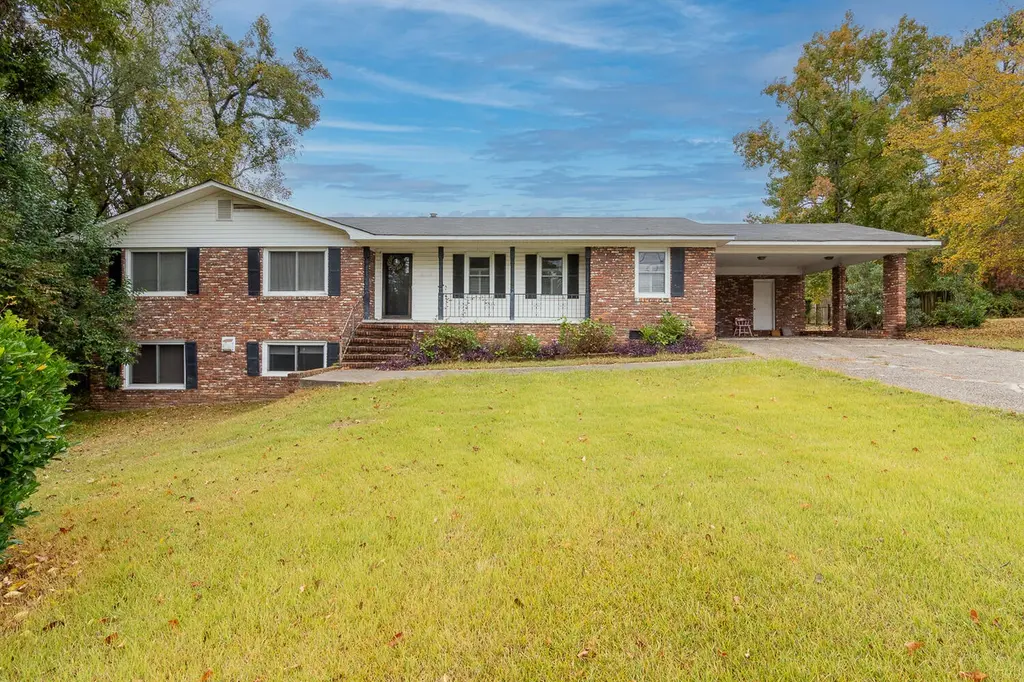
4421 Hereford Farm Rd Rd · Evans, GA
Flood risk 1/10 · Minimal
- FEMA flood zone
- X (unshaded)
- Chance of flooding over 30 yrs
- 0.0%
- Est. flood insurance / yr
- $507 – $1,088
Fire risk 3/10 · Minor
- Est. fire insurance / yr
- $963 – $1,789
Heat risk 6/10 · Moderate
- Hot days now (above 107°F)
- 7 days/yr
- Hot days in 30 yrs
- 17 days/yr
Wind risk 6/10 · Moderate
- Chance of severe wind over 30 yrs
- 63.0%
Air-quality risk 3/10 · Minor
- Unhealthy air days now
- 3 days/yr
- Unhealthy air days in 30 yrs
- 3 days/yr
Risk factors via First Street. Map © Google.
Why this score? — see what drove the D+ grade
The composite is a weighted blend of 9 inputs, each scored 0–100. Each bar is that input's sub-score; the figure is the points it added to the 100-point composite (weight × sub-score).
- Cash flow +15.2/30.0
- ARV discount +11.5/15.0
- DSCR +4.7/10.0
- Schools +4.5/10.0
- Livability +3.9/5.0
- 1% rule +3.2/10.0
- Condition / age +2.5/5.0
- Rent growth +2.4/5.0
- Appreciation +0.0/10.0
$275,000
🖨 Deal sheet 📄 Offer letter ✓ Due diligence
Listing remarks
Property is currently zoned R1 * Check w/ Columbia County about rezoning property to S1 * S1 uses are personal care home, day care, salon as well as other uses * The main floor features a kitchen w/ Newer white cabinets and stainless appl's * There is a formal DR, LR and separate Den area * The owners BDR and 2 other Bdr's on also on the main level * The bottom level features a Bdr, huge family room and full bathroom *
Key facts
- Separate den area
- Full bathroom
- Lr
Tags
Neighborhood map
What this means for you Summary
Snapshot
- This is a 3-bed/3.0-bath single-family listed at $275k.
Deal economics
- At list price, monthly cash flow is $97 ($1k/yr) — positive.
- The deal already cash-flows at list — no discount required.
- To meet the 1% rule (rent ≥ 1% of price), the offer needs to be $227k (17.6% below list).
- Recommended offer: $227k (17.6% below list) — sets the bar for 1% rule.
- Cap rate 6.7% vs local median 3.8% in Evans — top-decile yield for the area; either an underpriced asset or a hidden risk that comps aren't pricing in. Stress-test before assuming the spread holds.
Location & tenants
- Location reads 77/100 on livability (#20 in GA, #3,058 nationally) — a middle-class / working-renter tenant base. Strengths: crime A+, employment A+, housing A+; Watch: amenities D+, commute F.
- Columbia County (suburban): math 49% / reading 52% proficiency, ranked #13 of 174 in GA (top 8%) — acceptable for families but not a draw, mixed tenant base, ~2y average lease.
- Market conditions: Rents soft (-0.5%/yr); 510 active listings in the ZIP; 4 comparable units currently listed for rent nearby; rentals at typical pace (median 24d on market — plan ~3-4 weeks tenant-placement turnaround); high-income renter base; 1,213 units permitted in Columbia County in 2024 (0 in 5+ unit buildings).
Forward outlook
- Local home prices are declining (-3.0%/yr); year-one equity from $2k of loan paydown is wiped out by about $8k of value loss. Plan a longer hold.
- Columbia County population projected at +62% by 2050 — long-run rental-demand tailwind backs the buy-and-hold thesis.
Negotiation context
- It's been on market 18 days — a 2% lower offer ($271k) is reasonable based on typical stale-listing flexibility.
- 2 sale attempts; this cycle's ask has dropped $25k (8%) from the opening price — seller is motivated, your offer sets the floor, not the list.
Risks & watch-outs
- Climate carrying-cost: major wind risk, 63% chance of damaging wind over 30y; extreme-heat days projected 7→17/yr by 2055 (HVAC capex compounding) — expect insurance premiums to compound above CPI over the hold.
Questions for the listing agent
- Built in 1973 — when were the roof, HVAC, electrical panel, plumbing, and water heater last replaced?
- Is there a deadline driving the sale (1031 exchange, divorce, estate, relocation)? That informs how much negotiation room exists.
- Schools are B-rated — typically a magnet for longer-tenancy family renters. What's the average tenant stay here, and is there a school-zone premium baked into asking?
- The area grade is low — what's the realistic commute time and amenity access for the typical tenant pool here? Any planned neighborhood developments (good or bad) we should know about?
- What's the average days-on-market for RENTAL listings here right now (not sales)? A rising rental-DOM trend means longer vacancies and softer asking-rent achievability than the comps imply.
- What's the recent tenant-quality profile in this submarket — average credit score on applications, eviction rate, late-payment / NSF rate, and stable-employment percentage? A property-management company in the area should have these aggregated.
- How much new for-sale + rental construction is in the pipeline within 1–3 miles? Heavy new supply typically softens prices + rents 12–24 months out; constrained supply supports both.
Investment metrics
- 1% rule
- 0.82% ✗
- Cap rate
- 6.72%
- Cash-on-cash
- 1.52%
- DSCR
- 1.07
- GRM
- 10.1
CMA / ARV
- ARV (median comp)
- $302,089
- List price
- $275,000
- Delta
- -8.97%
- Verdict
- FAIR
- Comps
- 20 within 1.0 mi
Show comp detail 12 sales within ~0.75 mi
| Address | Dist | Beds/Ba | Sqft | Sold | Price | $/sf | Match |
|---|---|---|---|---|---|---|---|
| 8136 Sir Lancelot Ct | 0.37mi | 3/3.0 | 2,582 (-1%) | 13mo | $335,185 | $130 | 70 |
| 552 Waterford Dr | 0.59mi | 3/3.0 | 2,702 (+4%) | 1mo | $380,000 | $141 | 65 |
| 4478 Amanda Ct | 0.47mi | 4/2.5 (+1) | 2,592 (-0%) | 9mo | $370,000 | $143 | 63 |
| 452 Connemara Trl | 0.46mi | 4/3.0 (+1) | 2,525 (-3%) | 13mo | $349,900 | $139 | 58 |
| 4580 Oxford Ct | 0.54mi | 4/2.5 (+1) | 2,728 (+5%) | 7mo | $445,000 | $163 | 54 |
| 4586 Oxford Ct | 0.58mi | 4/2.5 (+1) | 2,412 (-7%) | 6mo | $361,900 | $150 | 49 |
| 8140 Sir Lancelot Ct | 0.37mi | 4/3.0 (+1) | 2,947 (+13%) | 15mo | $308,510 | $105 | 43 |
| 535 Astor Ct | 0.67mi | 4/2.5 (+1) | 2,409 (-8%) | 10mo | $353,900 | $147 | 41 |
| 532 Astor Ct | 0.63mi | 4/2.5 (+1) | 2,433 (-7%) | 14mo | $352,000 | $145 | 41 |
| 4507 Amanda Ln | 0.56mi | 4/2.5 (+1) | 2,988 (+15%) | 7mo | $415,000 | $139 | 36 |
| 4574 Oxford Dr | 0.55mi | 4/2.5 (+1) | 2,243 (-14%) | 14mo | $299,500 | $134 | 33 |
| 4600 Oxford Dr | 0.67mi | 4/2.0 (+1) | 2,423 (-7%) | 22mo | $295,000 | $122 | 30 |
Match score weights: distance 35% · size 25% · config 20% · recency 20%. Top-matched comps best support the ARV.
Projected returns pro-forma
-3.0% appreciation · 0.0% rent growth · sell at horizon
- IRR
- -17.0%
- Equity multiple
- 0.41×
- Total profit
- $-45,100
- Equity at exit
- $41,003
- IRR
- -14.9%
- Equity multiple
- 0.26×
- Total profit
- $-57,334
- Equity at exit
- $23,777
Cash invested: $77,000 (down + closing). Projections, not guarantees.
Landlord ↔ Tenant lean methodology
- Overall (STATE)
- 90 Strongly Landlord-Friendly
- State Georgia
- 90 Strongly Landlord-Friendly · R+3
- County
- — inherits STATE
- City
- — inherits STATE
ZIP-level market 30809
- Home prices YoY
- -22.1%
- Rents YoY
- -0.5%
- Active inventory
- 510
- Price-to-rent
- 10.1×
Monthly cashflow live
- Estimated rent
- $2,266 medium interval (Pro) →
- Mortgage (P&I)
- −$1,442
- Tax from tax record
- −$136 /mo · $1,631/yr
- Insurance
- −$115
- HOA
- −$0
- Vacancy / Maint / Mgmt
- −$476
- Net cashflow
- $97
Break-even live
UW: 25.0% down · 7.5% · 30yr · 1.5% tax · 5.0% vac · 8.0% maint · 8.0% mgmt
Financing live
Cash to close
- Down payment
- $68,750
- Closing costs
- $8,250
- Reserves months
- —
- Total cash needed
- —
Loan-product check · same deal, 3 products live
Conventional
25% down · 7.5% · 30yr
- Down + closing
- —
- Monthly P&I
- —
- Monthly cashflow
- —
- DSCR
- —
- Eligible?
- —
Personal DTI + credit; lowest rate.
DSCR
20% down · 8.5% · 30yr
- Down + closing
- —
- Monthly P&I
- —
- Monthly cashflow
- —
- DSCR
- —
- Eligible?
- —
No personal income docs; deal must DSCR.
Hard money
10% down · 12.0% · 12mo
- Down + closing
- —
- Monthly P&I
- —
- Monthly cashflow
- —
- DSCR
- —
- Eligible?
- —
Short-term bridge; refi at stabilization.
Rent comps 4 comps
| Address | Beds | Baths | Sqft | Rent | $/sqft | DOM | Units | Dist |
|---|---|---|---|---|---|---|---|---|
| 4497 Amanda Ln Evans, GA | 4.0 | 2.5 | 2442 | $2,200 | $0.90 | 14d | 1 | 0.53mi |
| 4517 Crosland Dr Evans, GA | 4.0 | 2.5 | 2578 | $2,500 | $0.97 | 43d | 1 | 0.54mi |
| 4702 Walnut Hill Dr Evans, GA | 4.0 | 2.0 | 1888 | $1,950 | $1.03 | 14d | 1 | 1.30mi |
| 170 Shadowmoor Ct Augusta, GA | 4.0 | 3.0 | 1944 | $2,200 | $1.13 | 23d | 1 | 1.36mi |
Listing history 4 events
-
2026-05-11historical
-
2026-04-23price $275,000
-
2025-10-29$300,000 Active
-
2025-10-29$275,000 Active 436-char remark
ⓘ Source: listings_history table (triggers on properties + properties_extension) + one-shot
backfill from property_details.listing_events for pre-trigger history.
Tax reassessment forecast GA · Resets to sale price
- Current annual tax
- $1,631 · $136/mo
- Projected year-2 tax
- $2,530 · $211/mo
- Expected delta
- +$899/yr (+$75/mo · 55.1%)
ⓘ Screening estimate from a state-policy table — verify with the county assessor before closing.
Climate risk First Street
- Flood 1/10 Low FEMA zone X (unshaded) · 0% chance over 30 yrs
- Wildfire 3/10 Moderate
- Heat 6/10 Major 7 d/yr ≥107°F today · 17 d/yr by 30 yrs out
- Wind 6/10 Major 63% chance of damaging wind over 30 yrs
- Air quality 3/10 Moderate 3 unhealthy d/yr today · 3 by 30 yrs out
Nearby sold comps map
Loading sold comps map…
Walkable amenities ~0.75 mi
Loading nearby amenities…
Taxation est. · year 1
- Rental income
- $27,188
- − Mortgage interest
- −$15,404
- − Property taxes
- −$1,631
- − Insurance
- −$1,375
- − Repairs & maintenance
- −$2,175
- − Management
- −$2,175
- − Depreciation
- −$8,000
- Taxable loss
- −$3,572
- Est. tax savings @ 24.0%
- +$857
- After-tax cash flow
- $2,025/yr
For passive investors: Depreciation is non-cash, so a rental often shows a tax loss while cash-flowing — sheltering income. Rental losses are passive: they offset passive income freely, and up to $25,000/yr can offset ordinary (W-2) income if you actively participate and your MAGI is under $100k (phasing out to $0 by $150k); unused losses carry forward. On sale, claimed depreciation is recaptured at up to 25%, and gains may owe capital-gains tax (a 1031 exchange can defer both). Figures are a year-1 estimate at your 24.0% rate — not tax advice; consult a CPA.
Schools (NCES district)
- District
- Columbia County
- NCES district ID
- 1301410
- Math proficiency
- 49% ▼ -6.00%
- Reading proficiency
- 52% ▼ -4.00%
- Median HH income
- $69,358
- Composite
- 45.04/100
- National rank
- #2695
- State rank
- #13 of 174 in GA
Livability — Evans
- Score
- 77/100
- State rank
- #20
- US rank
- #3058
Category grades
Schools grade is shown separately in the Schools card above.
Census & demographics
- Census place
- Evans, GA
- County
- Columbia County · 154,184 people
- City population
- 54,743
- Metro
- Augusta-Richmond County, GA-SC
- Population (ZIP)
- 54,743
- Household income
- $125,272
- Rent vs Own
- Severe rent burden
- 787.0
Population outlook (Columbia County) Hauer SSP2
- Today (2025)
- 189,073 people
- By 2030
- 212,277 · +12.3%
- By 2040
- 259,480 · +37.2%
- By 2050
- 306,991 · +62.4%
- By 2075
- 421,213 · +122.8%
- By 2100
- 496,722 · +162.7%
Race, ethnicity, and origin ACS 2023
- Neighborhood character
- Predominantly White (70%)
- Race & ethnicity
- White 70% Black 13% Hispanic / Latino 7% Two or more races 6% Asian 5%
- Hispanic origin (detail)
- Mexican 3% Puerto Rican 2%
- Common ancestry
- Italian 4% Lithuanian 2% Slovak 2%
- Foreign-born
- 7% · Canada, South Korea
- Languages at home
- 88% English-only · Spanish 6% Other Indo-European 2% Other Asian/Pacific 1%
Political lean MEDSL · Columbia
- 2024 margin
- Strong R (+25.6) · D 36.8% · R 62.5%
- 2008→2024 swing
- +17.0pp toward D · 2008: -42.7pp · 2024: -25.6pp
- All cycles
- 2024: R+25.6 2020: R+25.8 2016: R+37.7 2012: R+43.0 2008: R+42.7
Not yet ingested
- Civics
- —
Market trends
- HPI YoY
- ▼ -62.73%
- Current HPI
- 220.4452
- Rent YoY
- ▼ -0.51%
- Metro
- Augusta-Richmond County, GA-SC
- State GDP YoY
- ▲ 2.66%
- F500 in state
- 28
Industry mix (Fortune 500 HQ in GA)
| Industry | F500 HQs | Revenue |
|---|---|---|
| Paper / Packaging | 2 | $29B |
|
||
| Retail | 1 | $160B |
|
||
| Transportation / Logistics | 1 | $91B |
|
||
| Airlines | 1 | $62B |
|
||
| Consumer Goods | 1 | $47B |
|
||
| Utilities | 1 | $25B |
|
||
Price history
+0.0% since first listed5 events — show timeline
- 2026-05-29 Listing Removed — Hive MLS
- 2026-05-11 Listing Removed — Hive MLS
- 2026-04-23 Price Changed $275,000 Hive MLS
- 2025-10-29 Listed $300,000 Hive MLS
- 2025-10-29 Listed $275,000 Hive MLS
Property tax history
+7.2%/yrLatest (2025): $1,631 · +9.1% YoY. Source: county tax records.
Cash-flow waterfall
monthlySold comps — $/sqft
last 12 mo · ≤1 miLoading sold comps…