 Fourplex
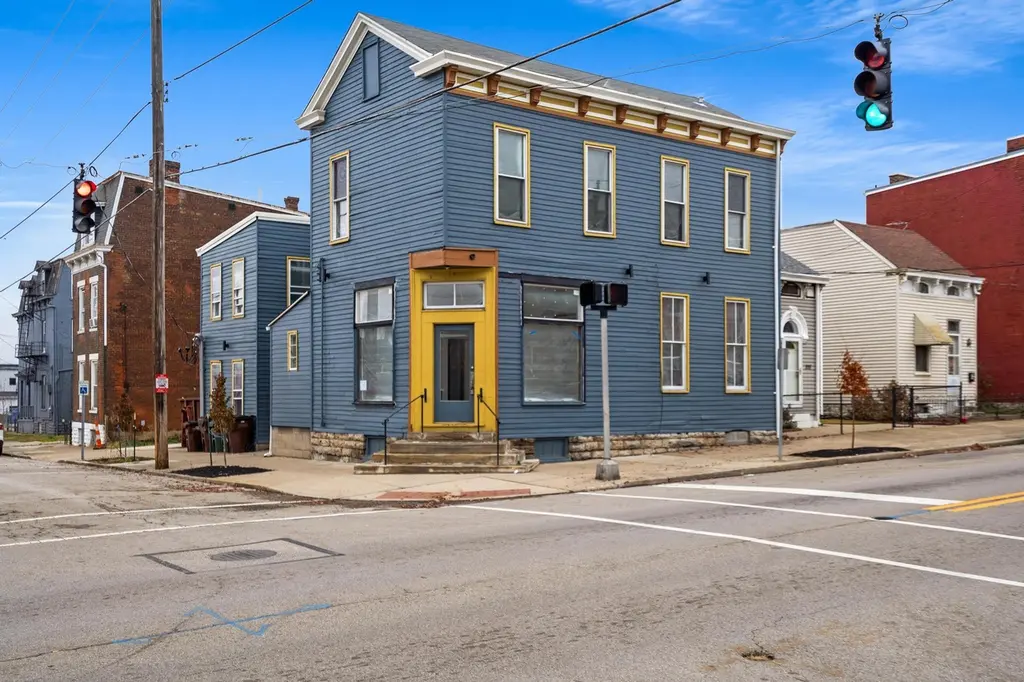
337 W 11th St · Newport, KY
Flood risk No data
- FEMA flood zone
- —
- Chance of flooding over 30 yrs
- —
- Est. flood insurance / yr
- —
Fire risk No data
- Est. fire insurance / yr
- —
Heat risk No data
- Hot days now (above threshold)
- —
- Hot days in 30 yrs
- —
Wind risk No data
- Chance of severe wind over 30 yrs
- —
Air-quality risk No data
- Unhealthy air days now
- —
- Unhealthy air days in 30 yrs
- —
Risk factors via First Street. Map © Google.
Why this score? — see what drove the C+ grade
The composite is a weighted blend of 9 inputs, each scored 0–100. Each bar is that input's sub-score; the figure is the points it added to the 100-point composite (weight × sub-score).
- Cash flow +30.0/30.0
- 1% rule +10.0/10.0
- DSCR +10.0/10.0
- Livability +4.1/5.0
- Condition / age +4.0/5.0
- Rent growth +3.7/5.0
- Schools +1.7/10.0
- ARV discount +0.0/15.0
- Appreciation +0.0/10.0
$350,000
🖨 Deal sheet 📄 Offer letter ✓ Due diligence
Multi-family units
County records classify this as Multi-Family (2-4 Unit). Listing-text estimate: 4 units. confirmed
Listing remarks MLS
Vesper's Corner - a 4 unit building nearly complete featuring 3 residential apartments and 1 corner commercial space. Exterior has undergone a beautiful facelift to reveal original historic features, and the interior is drywalled. Come take advantage of this great opportunity along one of West Newport's main corridors. May also be sold as part of a package with 125 W 11th, 217 W 13th Street & 423 Thornton. Contact agents for details.
Key facts
- 2,701 sq ft lot
- Parking
- Built 1889
Tags
Neighborhood map
What this means for you Summary
Snapshot
- This is a 4 × 2-bed/2.0-bath units multifamily listed at $350k. Condition is rated good.
Deal economics
- At list price, monthly cash flow is $3k ($33k/yr) — positive. Per door: $682/mo.
- The deal already cash-flows at list — no discount required.
- Meets the 1% rule at list price ($7k rent vs $350k).
- Recommended offer: $308k (12.0% below list) — sets the bar for market timing.
- Cap rate 15.6% vs local median 4.9% in Newport — top-decile yield for the area; either an underpriced asset or a hidden risk that comps aren't pricing in. Stress-test before assuming the spread holds.
Location & tenants
- Location reads 82/100 on livability (#58 in KY, #1,070 nationally) — a professional / high-income tenant draw. Strengths: amenities A+, commute A+, cost of living A+; Watch: schools D, crime F, employment D-.
- Newport Independent (suburban): math 14% / reading 26% proficiency, ranked #160 of 165 in KY (top 97%) — low school quality limits family demand, transient renter base, plan for 1-2y turnover; 79% free/reduced lunch — lower-income household profile, screen leases tightly.
- Market conditions: Rents rising fast (+4.6%/yr); 236 active listings in the ZIP; 247 units permitted in Campbell County in 2024 (77 in 5+ unit buildings).
- At $6,515/mo this rent would consume 130% of the median local household income ($60k/yr) (locally 1136% of renters already pay >50% of income on rent) — very limited rent-growth headroom before tenants either downsize or default.
Forward outlook
- Local home prices are declining (-3.0%/yr); year-one equity from $2k of loan paydown is wiped out by about $10k of value loss. Plan a longer hold.
- At projected returns (-3.0% appreciation + 4.6% rent growth), your $98k cash investment doubles in ~4 years — after that, you're playing with house money.
Negotiation context
- It's been on market 206 days — a 12% lower offer ($308k) is reasonable based on typical stale-listing flexibility.
Risks & watch-outs
- Watch-outs: built in 1889 — expect roof / HVAC / electrical / plumbing capex.
Questions for the listing agent
- It's been on market 206 days. Have you received any prior offers? Is the seller open to a 12% concession, seller financing, or rate buy-down credit?
- Can we see the unit-by-unit rent roll, current vacancy, and any below-market leases? What's the average tenancy length?
- What capital expenditures (roof, boiler, parking lot, exteriors) have been made in the last 5 years, and what's planned in the next 2?
- Built in 1889 — when were the roof, HVAC, electrical panel, plumbing, and water heater last replaced?
- Why hasn't it sold? Are there any deal-killer items the seller is aware of (foundation, flood, title, zoning, code violations)?
- Is there a deadline driving the sale (1031 exchange, divorce, estate, relocation)? That informs how much negotiation room exists.
- Schools are D-rated, which usually means shorter tenancies and higher turnover. Who's the typical renter profile here, and what's been the actual vacancy rate?
- Crime grade is F in this area — have there been break-ins, vandalism, or insurance claims at this property in the last 3 years? What carrier currently insures it and at what premium?
- What's the average days-on-market for RENTAL listings here right now (not sales)? A rising rental-DOM trend means longer vacancies and softer asking-rent achievability than the comps imply.
- What's the recent tenant-quality profile in this submarket — average credit score on applications, eviction rate, late-payment / NSF rate, and stable-employment percentage? A property-management company in the area should have these aggregated.
- How much new apartment / multifamily construction is in the pipeline within 1–3 miles? Heavy new supply (>2% of stock underway) typically softens rents 12–24 months out; light construction supports rent growth.
Investment metrics
- 1% rule
- 1.86% ✓
- Cap rate
- 15.65%
- Cash-on-cash
- 33.41%
- DSCR
- 2.49
- GRM
- 4.5
CMA / ARV
- ARV (median comp)
- $245,021
- List price
- $350,000
- Delta
- 42.84%
- Verdict
- OVERPRICED
- Comps
- 20 within 1.0 mi
Projected returns pro-forma
-3.0% appreciation · 4.64% rent growth · sell at horizon
- IRR
- 30.5%
- Equity multiple
- 2.31×
- Total profit
- $128,062
- Equity at exit
- $52,186
- IRR
- 38.7%
- Equity multiple
- 4.90×
- Total profit
- $382,008
- Equity at exit
- $30,262
Cash invested: $98,000 (down + closing). Projections, not guarantees.
Landlord ↔ Tenant lean methodology
- Overall (STATE)
- 83 Strongly Landlord-Friendly
- State Kentucky
- 83 Strongly Landlord-Friendly · R+16
- County
- — inherits STATE
- City
- — inherits STATE
ZIP-level market 41071
- Rents YoY
- 4.6%
- Active inventory
- 236
- Price-to-rent
- 17.9×
Monthly cashflow live
- Estimated rent
- $6,515 high interval (Pro) →
- Mortgage (P&I)
- −$1,835
- Tax est. 1.5%
- −$438 /mo · $5,250/yr
- Insurance
- −$146
- HOA
- −$0
- Vacancy / Maint / Mgmt
- −$1,368
- Net cashflow
- $2,728
Break-even live
4-unit breakdown (identical units grouped — click to expand)
| Units | Beds | Baths | Est. rent |
|---|---|---|---|
| 4× units | 2 | 2 | $6,516 |
| #1 | 2 | 2 | $1,629 |
| #2 | 2 | 2 | $1,629 |
| #3 | 2 | 2 | $1,629 |
| #4 | 2 | 2 | $1,629 |
| Total (4 units) | $6,515 | ||
UW: 25.0% down · 7.5% · 30yr · 1.5% tax · 5.0% vac · 8.0% maint · 8.0% mgmt
Financing live
Cash to close
- Down payment
- $87,500
- Closing costs
- $10,500
- Reserves months
- —
- Total cash needed
- —
Loan-product check · same deal, 3 products live
Conventional
25% down · 7.5% · 30yr
- Down + closing
- —
- Monthly P&I
- —
- Monthly cashflow
- —
- DSCR
- —
- Eligible?
- —
Personal DTI + credit; lowest rate.
DSCR
20% down · 8.5% · 30yr
- Down + closing
- —
- Monthly P&I
- —
- Monthly cashflow
- —
- DSCR
- —
- Eligible?
- —
No personal income docs; deal must DSCR.
Hard money
10% down · 12.0% · 12mo
- Down + closing
- —
- Monthly P&I
- —
- Monthly cashflow
- —
- DSCR
- —
- Eligible?
- —
Short-term bridge; refi at stabilization.
Listing history 16 events
-
2026-06-18days on market $350,000 Active 206 DOM
-
2026-06-17days on market $350,000 Active 205 DOM
-
2026-06-16days on market $350,000 Active 204 DOM
-
2026-06-15days on market $350,000 Active 203 DOM
-
2026-06-13days on market $350,000 Active 201 DOM
-
2026-06-09days on market $350,000 Active 197 DOM
-
2026-06-08days on market $350,000 Active 196 DOM
-
2026-06-07days on market $350,000 Active 195 DOM
-
2026-06-05days on market $350,000 Active 192 DOM
-
2026-06-03days on market $350,000 Active 191 DOM
-
2026-06-02days on market $350,000 Active 190 DOM
-
2026-06-01days on market $350,000 Active 189 DOM
-
2026-05-31days on market $350,000 Active 188 DOM
-
2026-01-22price $350,000 441-char remark
Show marketing remark (441 chars)
Vesper's Corner - a 4 unit building nearly complete featuring 3 residential apartments and 1 corner commercial space. Exterior has undergone a beautiful facelift to reveal original historic features, and the interior is drywalled. Come take advantage of this great opportunity along one of West Newport's main corridors. May also be sold as part of a package with 125 W 11th, 217 W 13th Street & 423 Thornton. Contact agents for details.
-
2025-11-25price $399,900 441-char remark
Show marketing remark (441 chars)
Vesper's Corner - a 4 unit building nearly complete featuring 3 residential apartments and 1 corner commercial space. Exterior has undergone a beautiful facelift to reveal original historic features, and the interior is drywalled. Come take advantage of this great opportunity along one of West Newport's main corridors. May also be sold as part of a package with 125 W 11th, 217 W 13th Street & 423 Thornton. Contact agents for details.
-
2025-11-24$460,000 Active 441-char remark
Show marketing remark (441 chars)
Vesper's Corner - a 4 unit building nearly complete featuring 3 residential apartments and 1 corner commercial space. Exterior has undergone a beautiful facelift to reveal original historic features, and the interior is drywalled. Come take advantage of this great opportunity along one of West Newport's main corridors. May also be sold as part of a package with 125 W 11th, 217 W 13th Street & 423 Thornton. Contact agents for details.
ⓘ Source: listings_history table (triggers on properties + properties_extension) + one-shot
backfill from property_details.listing_events for pre-trigger history.
Nearby sold comps map
Loading sold comps map…
Walkable amenities ~0.75 mi
Loading nearby amenities…
Taxation est. · year 1
- Rental income
- $78,180
- − Mortgage interest
- −$19,605
- − Property taxes
- −$5,250
- − Insurance
- −$1,750
- − Repairs & maintenance
- −$6,254
- − Management
- −$6,254
- − Depreciation
- −$10,182
- Taxable income
- $28,884
- Est. tax owed @ 24.0%
- −$6,932
- After-tax cash flow
- $25,805/yr
For passive investors: Depreciation is non-cash, so a rental often shows a tax loss while cash-flowing — sheltering income. Rental losses are passive: they offset passive income freely, and up to $25,000/yr can offset ordinary (W-2) income if you actively participate and your MAGI is under $100k (phasing out to $0 by $150k); unused losses carry forward. On sale, claimed depreciation is recaptured at up to 25%, and gains may owe capital-gains tax (a 1031 exchange can defer both). Figures are a year-1 estimate at your 24.0% rate — not tax advice; consult a CPA.
Condition & rehab AI · 12 photos
A 4-unit multi-family property with moderate renovations in progress. The exterior has been painted and original features revealed, while interior renovations are underway. Painting and flooring updates will significantly enhance its value.
Repairs flagged
- Major kitchen flooring — Flooring removed
- Major bathroom flooring — Flooring removed
- Major HVAC/mechanicals — No visible systems
Value-add opportunities
- Both Painting exterior — Enhances curb appeal and resale value
- Both Flooring replacement — Improves living space and rental appeal
- Both HVAC installation — Ensures comfort and energy efficiency
Renovation cost estimate screening
| Repair item | Severity | Est. cost |
|---|---|---|
| kitchen flooring · Flooring removed | Major | $15,000–50,000 |
| bathroom flooring · Flooring removed | Major | $15,000–50,000 |
| HVAC/mechanicals · No visible systems | Major | $15,000–50,000 |
| Total estimated repair cost · 3 items | $45,000–150,000 |
Value-add ROI direction
- Both Painting exterior — Enhances curb appeal and resale value ↑
- Both Flooring replacement — Improves living space and rental appeal ↑
- Both HVAC installation — Ensures comfort and energy efficiency ↑
ⓘ Cost ranges are severity-bucket heuristics (US national rule-of-thumb). Get contractor quotes + a written scope before underwriting a rehab budget.
Schools (NCES district)
- District
- Newport Independent
- NCES district ID
- 2104440
- Math proficiency
- 14% ▼ -11.00%
- Reading proficiency
- 26% ▼ -6.00%
- Median HH income
- $35,783
- Composite
- 16.51/100
- National rank
- #9182
- State rank
- #160 of 165 in KY
Livability — Newport
- Score
- 82/100
- State rank
- #58
- US rank
- #1070
Category grades
Schools grade is shown separately in the Schools card above.
Census & demographics
- Census place
- Newport, KY
- County
- Campbell County · 84,793 people
- City population
- 19,680
- Metro
- Cincinnati, OH-KY-IN
- Population (ZIP)
- 19,680
- Household income
- $59,976
- Rent vs Own
- Severe rent burden
- 1136.0
Population outlook (Campbell County) Hauer SSP2
- Today (2025)
- 95,668 people
- By 2030
- 96,886 · +1.3%
- By 2040
- 97,734 · +2.2%
- By 2050
- 96,413 · +0.8%
- By 2075
- 90,211 · -5.7%
- By 2100
- 79,434 · -17.0%
Race, ethnicity, and origin ACS 2023
- Neighborhood character
- Predominantly White (84%)
- Race & ethnicity
- White 84% Black 7% Two or more races 6% Hispanic / Latino 5%
- Common ancestry
- Slovak 3% Lithuanian 2% Italian 2%
- Foreign-born
- 4% · Canada
- Languages at home
- 95% English-only · Spanish 3% Other Indo-European 1%
Political lean MEDSL · Campbell
- 2024 margin
- R (+19.7) · D 39.2% · R 58.9% · Other 1.9%
- 2008→2024 swing
- +1.2pp toward D · 2008: -20.9pp · 2024: -19.7pp
- All cycles
- 2024: R+19.7 2020: R+18.6 2016: R+24.5 2012: R+22.8 2008: R+20.9
Not yet ingested
- Civics
- —
Market trends
- HPI YoY
- ▼ -193.38%
- Current HPI
- 244.9069
- Rent YoY
- ▲ 4.64%
- Metro
- Cincinnati, OH-KY-IN
- State GDP YoY
- ▲ 1.81%
- F500 in state
- 4
Industry mix (Fortune 500 HQ in KY)
| Industry | F500 HQs | Revenue |
|---|---|---|
| Healthcare | 1 | $118B |
|
||
| Food / Beverage | 1 | $7B |
|
||
Price history
-23.9% since first listed3 events — show timeline
- 2026-01-22 Price Changed $350,000 NKMLS
- 2025-11-25 Price Changed $399,900 NKMLS
- 2025-11-24 Listed $460,000 NKMLS
Cash-flow waterfall
monthlySold comps — $/sqft
last 12 mo · ≤1 miLoading sold comps…