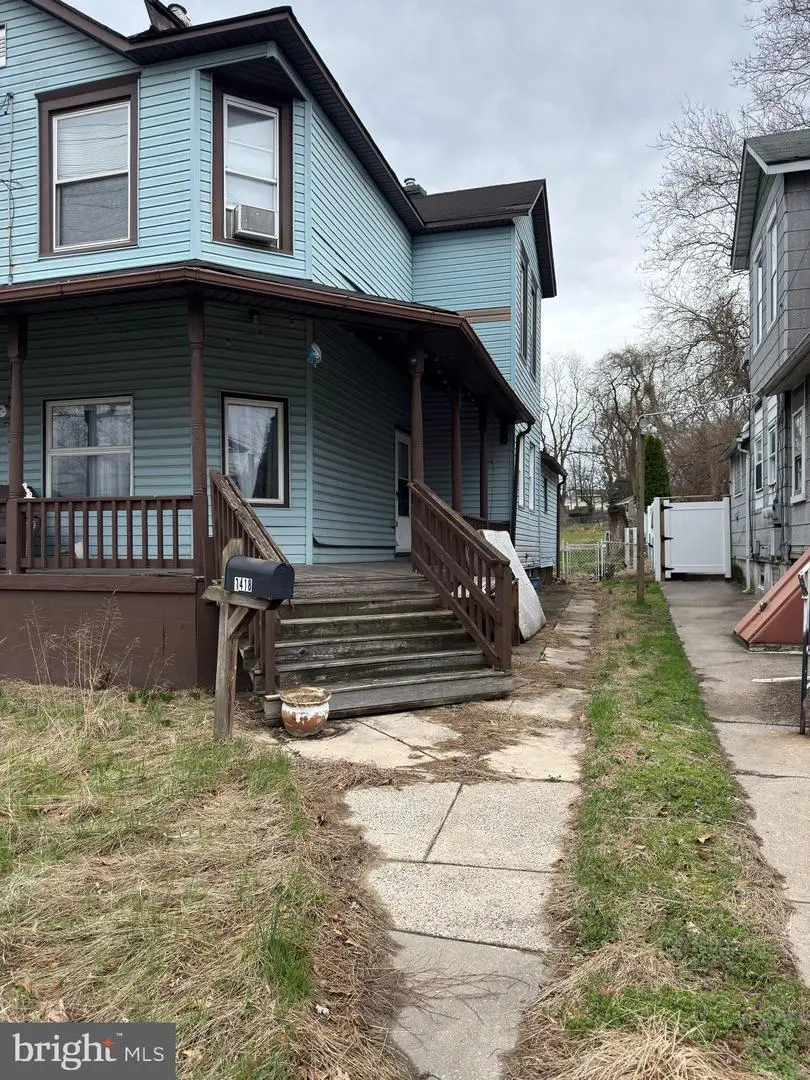
7418 River Rd · Philadelphia, PA
Flood risk 1/10 · Minimal
- FEMA flood zone
- X (unshaded)
- Chance of flooding over 30 yrs
- 0.0%
- Est. flood insurance / yr
- $507 – $1,088
Fire risk 1/10 · Minimal
- Est. fire insurance / yr
- $526 – $976
Heat risk 6/10 · Moderate
- Hot days now (above 104°F)
- 7 days/yr
- Hot days in 30 yrs
- 15 days/yr
Wind risk 6/10 · Moderate
- Chance of severe wind over 30 yrs
- 27.0%
Air-quality risk 4/10 · Minor
- Unhealthy air days now
- 5 days/yr
- Unhealthy air days in 30 yrs
- 6 days/yr
Risk factors via First Street. Map © Google.
Why this score? — see what drove the B+ grade
The composite is a weighted blend of 9 inputs, each scored 0–100. Each bar is that input's sub-score; the figure is the points it added to the 100-point composite (weight × sub-score).
- Cash flow +29.8/30.0
- ARV discount +15.0/15.0
- DSCR +10.0/10.0
- 1% rule +9.4/10.0
- Livability +3.9/5.0
- Rent growth +2.5/5.0
- Condition / age +2.5/5.0
- Schools +2.0/10.0
- Appreciation +0.0/10.0
$174,900
🖨 Deal sheet 📄 Offer letter ✓ Due diligence
Listing remarks MLS
Smart Investor--come and get it! Huge victorian twin with loads of potential. Home is being sold in strictly "as is" condition. Buyer responsible for any/all reapirs and/or certifications includuing: Certificate of occupancy inspection/certifications/repairs; Smoke/carbon monoxide inspection/certification; termite inspection/repairs/certification (if required); mortgage company repairs/certifications; home inspection repairs/certifications.
Key facts
- Solid foundation
- Off-street parking
- Conveniently located
Tags
Property features AI
Finance
- Other: Lease not considered; Pets allowed with no restrictions
Exterior
- Parking: Two off-street parking spaces; Parking includes alley and driveway access (total 2 garage/parking spaces)
- Utilities: Public water; Public sewer
- Home design: Semi-detached property; Shingle roof; Fee simple ownership; Built year source: Assessor
- Construction: Frame construction with vinyl siding; Block foundation; Building not winterized; Property condition listed as below average
- Exterior features: Lot dimensions approximately 25 x 142; Not in a federal flood zone; Other structures above and below grade
Interior
- Kitchen: Kitchen (appliances not specified)
- Bedrooms: Three bedrooms on the upper level (3 total)
- Bathrooms: One full bathroom on the main level (1 total)
- Heating & cooling: Forced air heating; Natural gas heating fuel
- Interior features: Full basement; Dining room; Family room; Mud room
- Laundry & utility: Hot water provided by natural gas
Neighborhood map
What this means for you Summary
Snapshot
- This is a 3-bed/1.0-bath single-family listed at $175k.
Deal economics
- At list price, monthly cash flow is $644 ($8k/yr) — positive.
- The deal already cash-flows at list — no discount required.
- Meets the 1% rule at list price ($3k rent vs $175k).
- Recommended offer: $170k (3.0% below list) — sets the bar for market timing.
- Cap rate 10.7% vs local median 3.5% in Philadelphia — top-decile yield for the area; either an underpriced asset or a hidden risk that comps aren't pricing in. Stress-test before assuming the spread holds.
Location & tenants
- Location reads 77/100 on livability (#348 in PA, #3,054 nationally) — a middle-class / working-renter tenant base. Strengths: amenities A+, commute A+, cost of living A+; Watch: employment C-, schools D+, crime F.
- Pennsauken Township Board Of Education School District (suburban): math 12% / reading 32% proficiency, ranked #410 of 472 in NJ (top 87%) — low school quality limits family demand, transient renter base, plan for 1-2y turnover.
- Market conditions: 8 comparable units currently listed for rent nearby; rentals at typical pace (median 24d on market — plan ~3-4 weeks tenant-placement turnaround); solid renter incomes; 1,018 units permitted in Camden County in 2024 (509 in 5+ unit buildings).
- This rent runs 36% of the median local income ($84k/yr) — at the standard rent-burdened threshold; future hikes will face affordability resistance.
Forward outlook
- Local home prices are declining (-3.0%/yr); year-one equity from $1k of loan paydown is wiped out by about $5k of value loss. Plan a longer hold.
- Camden County population projected to shrink 8% by 2050 — rents likely to lag national; underwrite the cash flow, not the appreciation.
- At projected returns (-3.0% appreciation + 3.0% rent growth), your $49k cash investment doubles in ~8 years — after that, you're playing with house money.
Negotiation context
- It's been on market 47 days — a 3% lower offer ($170k) is reasonable based on typical stale-listing flexibility.
- 2 sale attempts since 21y ago; this cycle's ask has dropped $10k (5%) from the opening price — seller is motivated, your offer sets the floor, not the list.
- Current owner paid $58k; list at $175k implies a 204% gain — meaningful room to come down on a strong offer.
Risks & watch-outs
- Watch-outs: built in 1924 — expect roof / HVAC / electrical / plumbing capex.
- Climate carrying-cost: major wind risk, 27% chance of damaging wind over 30y; extreme-heat days projected 7→15/yr by 2055 (HVAC capex compounding) — expect insurance premiums to compound above CPI over the hold.
Questions for the listing agent
- It's been on market 47 days. Have you received any prior offers? Is the seller open to a 3% concession, seller financing, or rate buy-down credit?
- Built in 1924 — when were the roof, HVAC, electrical panel, plumbing, and water heater last replaced?
- Is there a deadline driving the sale (1031 exchange, divorce, estate, relocation)? That informs how much negotiation room exists.
- Schools are D-rated, which usually means shorter tenancies and higher turnover. Who's the typical renter profile here, and what's been the actual vacancy rate?
- Crime grade is F in this area — have there been break-ins, vandalism, or insurance claims at this property in the last 3 years? What carrier currently insures it and at what premium?
- What's the average days-on-market for RENTAL listings here right now (not sales)? A rising rental-DOM trend means longer vacancies and softer asking-rent achievability than the comps imply.
- What's the recent tenant-quality profile in this submarket — average credit score on applications, eviction rate, late-payment / NSF rate, and stable-employment percentage? A property-management company in the area should have these aggregated.
- How much new for-sale + rental construction is in the pipeline within 1–3 miles? Heavy new supply typically softens prices + rents 12–24 months out; constrained supply supports both.
Investment metrics
- 1% rule
- 1.44% ✓
- Cap rate
- 10.71%
- Cash-on-cash
- 15.77%
- DSCR
- 1.70
- GRM
- 5.8
CMA / ARV
- ARV (on-the-fly)
- $309,960
- Comps found
- 12
Show comp detail 12 sales within ~0.75 mi
| Address | Dist | Beds/Ba | Sqft | Sold | Price | $/sf | Match |
|---|---|---|---|---|---|---|---|
| 7318 Zimmerman Ave | 0.23mi | 3/2.0 | 1,321 (+7%) | 7mo | $360,000 | $273 | 67 |
| 8412 Bannard Ave | 0.65mi | 3/1.5 | 1,216 (-1%) | 5mo | $195,000 | $160 | 61 |
| 8220 Stow Rd | 0.43mi | 3/1.5 | 1,272 (+3%) | 14mo | $320,000 | $252 | 60 |
| 7924 River Rd | 0.29mi | 4/1.0 (+1) | 1,356 (+10%) | 6mo | $160,000 | $118 | 59 |
| 525 Derousse Ave | 0.10mi | 4/1.0 (+1) | 1,074 (-13%) | 12mo | $160,000 | $149 | 59 |
| 1556 Velde Ave | 0.45mi | 3/1.5 | 1,344 (+9%) | 8mo | $350,000 | $260 | 54 |
| 7929 Stow Rd | 0.28mi | 3/1.0 | 1,056 (-14%) | 12mo | $265,000 | $251 | 53 |
| 8455 Balfour Rd | 0.74mi | 3/1.5 | 1,199 (-2%) | 10mo | $285,000 | $238 | 50 |
| 7325 Remington Ave | 0.45mi | 3/2.0 | 1,132 (-8%) | 15mo | $302,000 | $267 | 49 |
| 479 Cove Rd | 0.65mi | 3/1.5 | 1,124 (-9%) | 12mo | $304,900 | $271 | 43 |
| 1521 Cove Rd | 0.72mi | 3/2.5 | 1,319 (+7%) | 9mo | $425,000 | $322 | 41 |
| 8461 Holman Ave | 0.71mi | 3/2.5 | 1,296 (+5%) | 15mo | $305,000 | $235 | 39 |
Match score weights: distance 35% · size 25% · config 20% · recency 20%. Top-matched comps best support the ARV.
Projected returns pro-forma
-3.0% appreciation · 3.0% rent growth · sell at horizon
- IRR
- 6.7%
- Equity multiple
- 1.26×
- Total profit
- $12,768
- Equity at exit
- $26,078
- IRR
- 16.1%
- Equity multiple
- 2.31×
- Total profit
- $64,390
- Equity at exit
- $15,122
Cash invested: $48,972 (down + closing). Projections, not guarantees.
Landlord ↔ Tenant lean methodology
- Overall (STATE)
- 62 Landlord-Friendly
- State Pennsylvania
- 62 Landlord-Friendly · EVEN
- County
- — inherits STATE
- City
- — inherits STATE
ZIP-level market 08110
- Home prices YoY
- -10.9%
- Price-to-rent
- 5.8×
Monthly cashflow live
- Estimated rent
- $2,516 high interval (Pro) →
- Mortgage (P&I)
- −$917
- Tax from tax record
- −$354 /mo · $4,249/yr
- Insurance
- −$73
- HOA
- −$0
- Vacancy / Maint / Mgmt
- −$528
- Net cashflow
- $644
Break-even live
UW: 25.0% down · 7.5% · 30yr · 1.5% tax · 5.0% vac · 8.0% maint · 8.0% mgmt
Financing live
Cash to close
- Down payment
- $43,725
- Closing costs
- $5,247
- Reserves months
- —
- Total cash needed
- —
Loan-product check · same deal, 3 products live
Conventional
25% down · 7.5% · 30yr
- Down + closing
- —
- Monthly P&I
- —
- Monthly cashflow
- —
- DSCR
- —
- Eligible?
- —
Personal DTI + credit; lowest rate.
DSCR
20% down · 8.5% · 30yr
- Down + closing
- —
- Monthly P&I
- —
- Monthly cashflow
- —
- DSCR
- —
- Eligible?
- —
No personal income docs; deal must DSCR.
Hard money
10% down · 12.0% · 12mo
- Down + closing
- —
- Monthly P&I
- —
- Monthly cashflow
- —
- DSCR
- —
- Eligible?
- —
Short-term bridge; refi at stabilization.
Rent comps 8 comps
| Address | Beds | Baths | Sqft | Rent | $/sqft | DOM | Units | Dist |
|---|---|---|---|---|---|---|---|---|
| 8117 Stow Rd Pennsauken, NJ | 3.0 | 1.0 | 1056 | $2,450 | $2.32 | 5d | 1 | 0.38mi |
| 1535 Gross Ave Pennsauken, NJ | 3.0 | 1.0 | 1272 | $2,150 | $1.69 | 24d | 1 | 0.97mi |
| 7406 Jackson Ave Pennsauken, NJ | 3.0 | 2.0 | 1344 | $2,900 | $2.16 | 17d | 1 | 0.99mi |
| 2277 Hollinshed Ave Pennsauken, NJ | 3.0 | 1.5 | 1164 | $2,400 | $2.06 | 24d | 1 | 1.24mi |
| 5729 Irving Ave Pennsauken, NJ | 3.0 | 1.5 | 1200 | $2,150 | $1.79 | 16d | 1 | 1.36mi |
| 4601 High St Pennsauken, NJ | 1.0–2.0 | 1.0 | 800 | $1,675 | $2.09 | 2d | 4 | 1.43mi |
| 6366 Rogers Ave Unit 3 Pennsauken Township, NJ | 3.0 | 1.0 | 1100 | $2,100 | $1.91 | 24d | 1 | 1.46mi |
| 2323 Browning Rd Pennsauken, NJ | 3.0 | 1.0 | 923 | $2,500 | $2.71 | 24d | 1 | 1.47mi |
Listing history 7 events
-
2026-05-14status Pending
-
2026-04-28price $174,900
-
2026-03-28$185,000 Active
-
2005-04-18soldstatus $57,500
-
2005-04-04soldstatus $57,500 458-char remark
Show marketing remark (458 chars)
Smart Investor--come and get it! Huge victorian twin with loads of potential. Home is being sold in strictly "as is" condition. Buyer responsible for any/all reapirs and/or certifications includuing: Certificate of occupancy inspection/certifications/repairs; Smoke/carbon monoxide inspection/certification; termite inspection/repairs/certification (if required); mortgage company repairs/certifications; home inspection repairs/certifications.
-
2005-01-07$57,500 458-char remark
Show marketing remark (458 chars)
Smart Investor--come and get it! Huge victorian twin with loads of potential. Home is being sold in strictly "as is" condition. Buyer responsible for any/all reapirs and/or certifications includuing: Certificate of occupancy inspection/certifications/repairs; Smoke/carbon monoxide inspection/certification; termite inspection/repairs/certification (if required); mortgage company repairs/certifications; home inspection repairs/certifications.
-
1982-06-01soldstatus $23,500
ⓘ Source: listings_history table (triggers on properties + properties_extension) + one-shot
backfill from property_details.listing_events for pre-trigger history.
Tax reassessment forecast PA · Partial reset (capped growth)
- Current annual tax
- $4,249 · $354/mo
- Projected year-2 tax
- $4,249 · $354/mo
- Expected delta
- $0/yr ($0/mo · 0.0%)
ⓘ Screening estimate from a state-policy table — verify with the county assessor before closing.
Climate risk First Street
- Flood 1/10 Low FEMA zone X (unshaded) · 0% chance over 30 yrs
- Wildfire 1/10 Low
- Heat 6/10 Major 7 d/yr ≥104°F today · 15 d/yr by 30 yrs out
- Wind 6/10 Major 27% chance of damaging wind over 30 yrs
- Air quality 4/10 Moderate 5 unhealthy d/yr today · 6 by 30 yrs out
Nearby sold comps map
Loading sold comps map…
Walkable amenities ~0.75 mi
Loading nearby amenities…
Taxation est. · year 1
- Rental income
- $30,193
- − Mortgage interest
- −$9,797
- − Property taxes
- −$4,249
- − Insurance
- −$874
- − Repairs & maintenance
- −$2,415
- − Management
- −$2,415
- − Depreciation
- −$5,088
- Taxable income
- $5,354
- Est. tax owed @ 24.0%
- −$1,285
- After-tax cash flow
- $6,438/yr
For passive investors: Depreciation is non-cash, so a rental often shows a tax loss while cash-flowing — sheltering income. Rental losses are passive: they offset passive income freely, and up to $25,000/yr can offset ordinary (W-2) income if you actively participate and your MAGI is under $100k (phasing out to $0 by $150k); unused losses carry forward. On sale, claimed depreciation is recaptured at up to 25%, and gains may owe capital-gains tax (a 1031 exchange can defer both). Figures are a year-1 estimate at your 24.0% rate — not tax advice; consult a CPA.
Schools (NCES district)
- District
- Pennsauken Township Board Of Education School District
- NCES district ID
- 3412870
- Math proficiency
- 12% ▼ -16.00%
- Reading proficiency
- 32% ▼ -3.00%
- Median HH income
- $60,336
- Composite
- 20.48/100
- National rank
- #8573
- State rank
- #410 of 472 in NJ
Livability — Philadelphia
- Score
- 77/100
- State rank
- #348
- US rank
- #3054
Category grades
Schools grade is shown separately in the Schools card above.
Census & demographics
- County
- Camden County
- City population
- 1,559,001
- Metro
- Philadelphia-Camden-Wilmington, PA-NJ-DE-MD
- Population (ZIP)
- 19,158
- Household income
- $83,729
- Rent vs Own
- Severe rent burden
- 404.0
Population outlook (Camden County) Hauer SSP2
- Today (2025)
- 507,964 people
- By 2030
- 502,182 · -1.1%
- By 2040
- 485,602 · -4.4%
- By 2050
- 465,630 · -8.3%
- By 2075
- 419,986 · -17.3%
- By 2100
- 369,492 · -27.3%
Race, ethnicity, and origin ACS 2023
- Neighborhood character
- Diverse neighborhood (Simpson 0.67)
- Race & ethnicity
- Hispanic / Latino 46% Black 30% White 14% Two or more races 13% Asian 7% Native American 2%
- Hispanic origin (detail)
- Mexican 5% Puerto Rican 17% Dominican 16%
- Common ancestry
- Romanian 2% Hispanic 1% Iranian 1%
- Foreign-born
- 28% · Canada, Vietnam, Jamaica
- Languages at home
- 52% English-only · Spanish 35% Vietnamese 4% French/Haitian/Cajun 1%
Political lean MEDSL · Camden
- 2024 margin
- Strong D (+27.4) · D 63.0% · R 35.5% · Other 1.5%
- 2008→2024 swing
- -8.8pp toward R · 2008: 36.2pp · 2024: 27.4pp
- All cycles
- 2024: D+27.4 2020: D+33.5 2016: D+32.4 2012: D+36.6 2008: D+36.2
Not yet ingested
- Civics
- —
Market trends
- HPI YoY
- ▼ -53.44%
- Current HPI
- 436.2879
- Rent YoY
- —
- Metro
- Philadelphia-Camden-Wilmington, PA-NJ-DE-MD
- State GDP YoY
- ▲ 1.68%
- F500 in state
- 34
Industry mix (Fortune 500 HQ in PA)
| Industry | F500 HQs | Revenue |
|---|---|---|
| Healthcare | 2 | $309B |
|
||
| Insurance | 2 | $27B |
|
||
| Telecommunications / Media | 1 | $124B |
|
||
| Industrial Distribution | 1 | $22B |
|
||
| Financial Services | 1 | $20B |
|
||
| Chemicals / Materials | 1 | $18B |
|
||
Price history
+644.3% since first listed7 events — show timeline
- 2026-05-14 Pending — BRIGHT MLS
- 2026-04-28 Price Changed $174,900 BRIGHT MLS
- 2026-03-28 Listed $185,000 BRIGHT MLS
- 2005-04-18 Sold (Public Records) $57,500 Public Records
- 2005-04-04 Sold (MLS) $57,500 BRIGHT MLS
- 2005-01-07 Listed $57,500 BRIGHT MLS
- 1982-06-01 Sold (Public Records) $23,500 Public Records
Property tax history
+1.9%/yrLatest (2025): $4,249 · +1.3% YoY. Source: county tax records.
Cash-flow waterfall
monthlySold comps — $/sqft
last 12 mo · ≤1 miLoading sold comps…