1735 El Camino Rd #2 · Jacksonville, FL
Flood risk 1/10 · Minimal
- FEMA flood zone
- X (unshaded)
- Chance of flooding over 30 yrs
- 0.0%
- Est. flood insurance / yr
- $507 – $1,088
Fire risk 4/10 · Minor
- Est. fire insurance / yr
- $947 – $1,759
Heat risk 9/10 · Severe
- Hot days now (above 107°F)
- 7 days/yr
- Hot days in 30 yrs
- 20 days/yr
Wind risk 9/10 · Severe
- Chance of severe wind over 30 yrs
- 99.0%
Air-quality risk 4/10 · Minor
- Unhealthy air days now
- 6 days/yr
- Unhealthy air days in 30 yrs
- 6 days/yr
Risk factors via First Street. Map © Google.
Why this score? — see what drove the C- grade
The composite is a weighted blend of 9 inputs, each scored 0–100. Each bar is that input's sub-score; the figure is the points it added to the 100-point composite (weight × sub-score).
- Cash flow +16.1/30.0
- 1% rule +10.0/10.0
- ARV discount +7.5/15.0
- DSCR +5.0/10.0
- Livability +4.2/5.0
- Schools +3.9/10.0
- Condition / age +2.5/5.0
- Rent growth +2.4/5.0
- Appreciation +0.0/10.0
$109,900
🖨 Deal sheet 📄 Offer letter ✓ Due diligence
Listing remarks
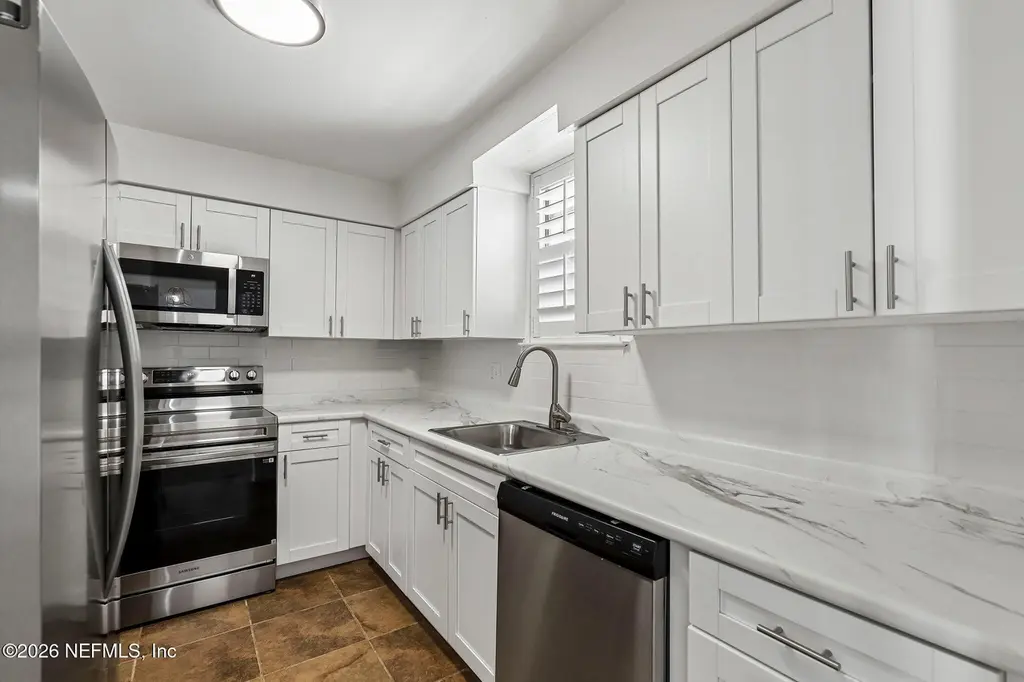
Welcome to this ground-level condo in the gated Southbrook Condominiums, offering comfort, style, and resort-style amenities in a prime location. Built in 1967 and spanning 1,180 square feet, this move-in-ready residence features tile flooring throughout, an open, functional layout, and the convenience of in-unit laundry. The fully remodeled kitchen is a standout, showcasing brand-new stainless steel appliances and a fresh, modern look ideal for everyday living and entertaining. The entire unit has been completely repainted, creating a clean, bright atmosphere throughout. Enjoy peaceful pool views just steps from your door, adding to the relaxed, low-maintenance lifestyle. Residents of Sout
Key facts
- $500 HOA
- Community pool
- Built 1967
Property features AI
Finance
- HOA & community: Homeowner association with monthly fee; Association fee: $500 per month; Association covers insurance, grounds maintenance, structure maintenance, pest control, sewer, trash, and water
Exterior
- Parking: Additional parking; Assigned parking; Guest parking; Parking lot
- Utilities: Cable available; Electricity connected; Sewer connected; Water connected
- Home design: Condominium; Property is attached; 2 stories
- Construction: Asphalt/paved road access
- Exterior features: Association pool (not private); Boat dock; Clubhouse; Maintained grounds; Water access
Interior
- Kitchen: Electric oven; Electric range; Microwave; Dishwasher; Garbage disposal
- Bedrooms: 3 bedrooms
- Flooring: Tile
- Bathrooms: 2 full bathrooms
- Heating & cooling: Central heating; Electric heating; Heat pump; Hot water heating; Central air conditioning; Electric cooling
- Interior features: Entrance foyer; Primary bathroom with tub and shower
- Laundry & utility: Washer; Dryer
Neighborhood map
What this means for you Summary
Snapshot
- This is a 3-bed/2.0-bath condo listed at $110k.
Deal economics
- At list price, monthly cash flow is $57 ($685/yr) — positive.
- The deal already cash-flows at list — no discount required.
- Meets the 1% rule at list price ($2k rent vs $110k).
- Recommended offer: $107k (3.0% below list) — sets the bar for market timing.
- Cap rate 6.9% vs local median 4.0% in Jacksonville — top-decile yield for the area; either an underpriced asset or a hidden risk that comps aren't pricing in. Stress-test before assuming the spread holds.
Location & tenants
- Location reads 83/100 on livability (#50 in FL, #911 nationally) — a professional / high-income tenant draw. Strengths: amenities A+, commute A+, housing A+.
- Duval (urban): math 46% / reading 45% proficiency, ranked #48 of 73 in FL (top 66%) — families likely to look elsewhere, expect single-tenant / working-renter base with shorter leases.
- Market conditions: Rents soft (-0.2%/yr); 219 active listings in the ZIP; 40 comparable units currently listed for rent nearby; rentals at typical pace (median 21d on market — plan ~3-4 weeks tenant-placement turnaround); 6,503 units permitted in Duval County in 2024 (1,131 in 5+ unit buildings).
- This rent runs 32% of the median local income ($62k/yr) — at the standard rent-burdened threshold; future hikes will face affordability resistance.
Forward outlook
- Local home prices are declining (-3.0%/yr); year-one equity from $760 of loan paydown is wiped out by about $3k of value loss. Plan a longer hold.
- Duval County population projected at +19% by 2050 — long-run rental-demand tailwind backs the buy-and-hold thesis.
Negotiation context
- It's been on market 49 days — a 3% lower offer ($107k) is reasonable based on typical stale-listing flexibility.
- Current owner paid $25k; list at $110k implies a 341% gain — meaningful room to come down on a strong offer.
Risks & watch-outs
- Watch-outs: HOA is 30% of rent.
- Climate carrying-cost: severe wind risk, 99% chance of damaging wind over 30y; extreme-heat days projected 7→20/yr by 2055 (HVAC capex compounding) — expect insurance premiums to compound above CPI over the hold.
Questions for the listing agent
- It's been on market 49 days. Have you received any prior offers? Is the seller open to a 3% concession, seller financing, or rate buy-down credit?
- Built in 1967 — when were the roof, HVAC, electrical panel, plumbing, and water heater last replaced?
- What does the HOA fee cover, when was the last increase, and are there any pending special assessments or reserve-fund shortfalls?
- Any open or pending special assessments — roof, HVAC, plumbing, elevator, façade? What's the per-unit balance and payoff schedule, and is the seller paying it off at close or rolling it to the buyer?
- Is there a deadline driving the sale (1031 exchange, divorce, estate, relocation)? That informs how much negotiation room exists.
- Schools are B-rated — typically a magnet for longer-tenancy family renters. What's the average tenant stay here, and is there a school-zone premium baked into asking?
- What's the average days-on-market for RENTAL listings here right now (not sales)? A rising rental-DOM trend means longer vacancies and softer asking-rent achievability than the comps imply.
- What's the recent tenant-quality profile in this submarket — average credit score on applications, eviction rate, late-payment / NSF rate, and stable-employment percentage? A property-management company in the area should have these aggregated.
- How much new apartment / multifamily construction is in the pipeline within 1–3 miles? Heavy new supply (>2% of stock underway) typically softens rents 12–24 months out; light construction supports rent growth.
Investment metrics
- 1% rule
- 1.52% ✓
- Cap rate
- 6.92%
- Cash-on-cash
- 2.23%
- DSCR
- 1.10
- GRM
- 5.5
CMA / ARV
No comps found within radius.
Projected returns pro-forma
-3.0% appreciation · 0.0% rent growth · sell at horizon
- IRR
- -18.1%
- Equity multiple
- 0.39×
- Total profit
- $-18,726
- Equity at exit
- $16,386
- IRR
- -25.2%
- Equity multiple
- 0.05×
- Total profit
- $-29,150
- Equity at exit
- $9,502
Cash invested: $30,772 (down + closing). Projections, not guarantees.
Landlord ↔ Tenant lean methodology
- Overall (STATE)
- 87 Strongly Landlord-Friendly
- State Florida
- 87 Strongly Landlord-Friendly · R+3
- County
- — inherits STATE
- City
- — inherits STATE
ZIP-level market 32216
- Rents YoY
- -0.2%
- Active inventory
- 219
- Price-to-rent
- 5.5×
Monthly cashflow live
- Estimated rent
- $1,667 high interval (Pro) →
- Mortgage (P&I)
- −$576
- Tax est. 1.5%
- −$137 /mo · $1,648/yr
- Insurance
- −$46
- HOA
- −$500
- Vacancy / Maint / Mgmt
- −$350
- Net cashflow
- $57
Break-even live
UW: 25.0% down · 7.5% · 30yr · 1.5% tax · 5.0% vac · 8.0% maint · 8.0% mgmt
Financing live
Cash to close
- Down payment
- $27,475
- Closing costs
- $3,297
- Reserves months
- —
- Total cash needed
- —
Loan-product check · same deal, 3 products live
Conventional
25% down · 7.5% · 30yr
- Down + closing
- —
- Monthly P&I
- —
- Monthly cashflow
- —
- DSCR
- —
- Eligible?
- —
Personal DTI + credit; lowest rate.
DSCR
20% down · 8.5% · 30yr
- Down + closing
- —
- Monthly P&I
- —
- Monthly cashflow
- —
- DSCR
- —
- Eligible?
- —
No personal income docs; deal must DSCR.
Hard money
10% down · 12.0% · 12mo
- Down + closing
- —
- Monthly P&I
- —
- Monthly cashflow
- —
- DSCR
- —
- Eligible?
- —
Short-term bridge; refi at stabilization.
Rent comps 40 comps
| Address | Beds | Baths | Sqft | Rent | $/sqft | DOM | Units | Dist |
|---|---|---|---|---|---|---|---|---|
| 7346 El Barco Rd #8 Jacksonville, FL | 2.0 | 2.0 | 992 | $1,295 | $1.31 | 23d | 1 | 0.10mi |
| 7346 El Barco Rd #8 Jacksonville, FL | 2.0 | 2.0 | 992 | $1,295 | $1.31 | 13d | 1 | 0.10mi |
| 7505 Beach Blvd Jacksonville, FL | 3.0 | 1.0–2.0 | 900 | $1,650 | $1.83 | 23d | 20 | 0.14mi |
| 8343 Hogan Rd Jacksonville, FL | 1.0–3.0 | 1.0–2.0 | 1043 | $1,574 | $1.51 | 2d | 17 | 0.77mi |
| 8601 Beach Blvd Jacksonville, FL | 2.0–3.0 | 2.0 | 1234 | $1,700 | $1.38 | 1d | 3 | 0.78mi |
| 7104 Waikiki Rd Jacksonville, FL | 4.0 | 1.5 | 1497 | $1,695 | $1.13 | 7d | 1 | 0.79mi |
| 6650 Corporate Center Pkwy Jacksonville, FL | 1.0–3.0 | 1.0–2.0 | 990 | $3,308 | $3.34 | 1d | 12 | 0.83mi |
| 1515 Pullen Rd Unit 4 Jacksonville, FL | 2.0 | 1.0 | 800 | $1,100 | $1.38 | 23d | 1 | 0.92mi |
| 2440 San Sago Ln Jacksonville, FL | 3.0 | 2.0 | 1500 | $1,945 | $1.30 | 23d | 1 | 0.93mi |
| 2525 Dean Rd Jacksonville, FL | 3.0 | 1.0 | 1424 | $1,850 | $1.30 | 23d | 1 | 1.04mi |
| 8846 Cavender Dr Jacksonville, FL | 3.0 | 2.0 | 1176 | $1,475 | $1.25 | 14d | 1 | 1.04mi |
| 8846 Cavender Dr Jacksonville, FL | 3.0 | 2.0 | 1176 | $1,475 | $1.25 | 21d | 1 | 1.04mi |
| 7811 Aquarius Cir S Jacksonville, FL | 3.0 | 2.0 | 1298 | $1,760 | $1.36 | 23d | 1 | 1.08mi |
| 8232 Rigel Rd Jacksonville, FL | 3.0 | 2.5 | 1372 | $1,610 | $1.17 | 13d | 1 | 1.20mi |
| 8236 Rigel Rd Jacksonville, FL | 3.0 | 2.5 | 1358 | $1,585 | $1.17 | 23d | 1 | 1.21mi |
| 8252 Rigel Rd Jacksonville, FL | 3.0 | 2.5 | 1358 | $1,625 | $1.20 | 23d | 1 | 1.23mi |
| 8778 Buzz Ct Jacksonville, FL | 3.0 | 2.0 | 1212 | $1,800 | $1.49 | 23d | 1 | 1.25mi |
| 551 Eiseman Way Jacksonville, FL | 3.0 | 2.5 | 1358 | $1,620 | $1.19 | 23d | 1 | 1.27mi |
| 8290 Rigel Rd Jacksonville, FL | 3.0 | 2.5 | 1358 | $1,595 | $1.17 | 23d | 1 | 1.28mi |
| 3013 Newell Blvd Jacksonville, FL | 4.0 | 1.5 | 1350 | $1,795 | $1.33 | 23d | 1 | 1.28mi |
| 421 Aralia Ln Jacksonville, FL | 3.0 | 2.5 | 1492 | $1,681 | $1.13 | 21d | 1 | 1.31mi |
| 574 Kit St Jacksonville, FL | 3.0 | 2.5 | 1480 | $1,845 | $1.25 | 14d | 1 | 1.34mi |
| 574 Kit St Jacksonville, FL | 3.0 | 2.5 | 1480 | $1,845 | $1.25 | 23d | 1 | 1.34mi |
| 558 Kit St Jacksonville, FL | 3.0 | 2.5 | 1480 | $1,845 | $1.25 | 21d | 1 | 1.36mi |
| 558 Kit St Jacksonville, FL | 3.0 | 2.5 | 1480 | $1,845 | $1.25 | 14d | 1 | 1.36mi |
| 3000 Coronet Ln Jacksonville, FL | 1.0–3.0 | 1.0–2.0 | 1017 | $1,709 | $1.68 | 23d | 5 | 1.36mi |
| 514 Narnia Ct Jacksonville, FL | 3.0 | 2.5 | 1480 | $1,845 | $1.25 | 14d | 1 | 1.36mi |
| 514 Narnia Ct Jacksonville, FL | 3.0 | 2.5 | 1480 | $1,845 | $1.25 | 23d | 1 | 1.36mi |
| 513 Narnia Ct Jacksonville, FL | 3.0 | 2.5 | 1480 | $1,845 | $1.25 | 4d | 1 | 1.39mi |
| 545 Kit St Jacksonville, FL | 3.0 | 2.5 | 1480 | $1,845 | $1.25 | 23d | 1 | 1.39mi |
| 514 Kit St Jacksonville, FL | 3.0 | 2.5 | 1480 | $1,845 | $1.25 | 14d | 1 | 1.40mi |
| 514 Kit St Jacksonville, FL | 3.0 | 2.5 | 1480 | $1,845 | $1.25 | 23d | 1 | 1.40mi |
| 535 Kit St Jacksonville, FL | 3.0 | 2.5 | 1480 | $1,845 | $1.25 | 23d | 1 | 1.40mi |
| 535 Kit St Jacksonville, FL | 3.0 | 2.5 | 1480 | $1,845 | $1.25 | 14d | 1 | 1.40mi |
| 2613 Sandusky Ave E Jacksonville, FL | 3.0 | 2.0 | 1116 | $1,800 | $1.61 | 7d | 1 | 1.41mi |
| 471 Matilda Ln Jacksonville, FL | 3.0 | 2.5 | 1480 | $1,845 | $1.25 | 14d | 1 | 1.45mi |
| 471 Matilda Ln Jacksonville, FL | 3.0 | 2.5 | 1480 | $1,845 | $1.25 | 17d | 1 | 1.45mi |
| 487 Terabithia Way Jacksonville, FL | 3.0 | 2.5 | 1480 | $1,845 | $1.25 | 21d | 1 | 1.47mi |
| 487 Terabithia Way Jacksonville, FL | 3.0 | 2.5 | 1480 | $1,845 | $1.25 | 14d | 1 | 1.47mi |
| 451 Matilda Ln Jacksonville, FL | 3.0 | 2.5 | 1480 | $1,845 | $1.25 | 14d | 1 | 1.47mi |
HOA detail condo
- Monthly dues
- $500 · $6,000/yr
- Likely covers
- poolsecurity
- Assessments
- None detected in remarks — confirm with the listing agent.
Listing history 17 events
-
2026-06-18days on market $109,900 Active 49 DOM
-
2026-06-17days on market $109,900 Active 48 DOM
-
2026-06-16days on market $109,900 Active 47 DOM
-
2026-06-15days on market $109,900 Active 46 DOM
-
2026-06-13days on market $109,900 Active 43 DOM
-
2026-06-10pricedays on market $109,900 Active 40 DOM
-
2026-06-08days on market $120,000 Active 39 DOM
-
2026-06-07days on market $120,000 Active 38 DOM
-
2026-06-05days on market $120,000 Active 35 DOM
-
2026-06-03days on market $120,000 Active 34 DOM
-
2026-06-02days on market $120,000 Active 33 DOM
-
2026-06-01days on market $120,000 Active 32 DOM
-
2026-05-31days on market $120,000 Active 31 DOM
-
2026-05-06price $130,000
-
2026-04-30$150,000 Active
-
1990-09-01soldstatus $24,909
-
1984-02-01soldstatus $46,300
ⓘ Source: listings_history table (triggers on properties + properties_extension) + one-shot
backfill from property_details.listing_events for pre-trigger history.
Climate risk First Street
- Flood 1/10 Low FEMA zone X (unshaded) · 0% chance over 30 yrs
- Wildfire 4/10 Moderate
- Heat 9/10 Extreme 7 d/yr ≥107°F today · 20 d/yr by 30 yrs out
- Wind 9/10 Extreme 99% chance of damaging wind over 30 yrs
- Air quality 4/10 Moderate 6 unhealthy d/yr today · 6 by 30 yrs out
Nearby sold comps map
Loading sold comps map…
Walkable amenities ~0.75 mi
Loading nearby amenities…
Taxation est. · year 1
- Rental income
- $19,998
- − Mortgage interest
- −$6,156
- − Property taxes
- −$1,648
- − Insurance
- −$550
- − Repairs & maintenance
- −$1,600
- − Management
- −$1,600
- − HOA
- −$6,000
- − Depreciation
- −$3,197
- Taxable loss
- −$753
- Est. tax savings @ 24.0%
- +$181
- After-tax cash flow
- $865/yr
For passive investors: Depreciation is non-cash, so a rental often shows a tax loss while cash-flowing — sheltering income. Rental losses are passive: they offset passive income freely, and up to $25,000/yr can offset ordinary (W-2) income if you actively participate and your MAGI is under $100k (phasing out to $0 by $150k); unused losses carry forward. On sale, claimed depreciation is recaptured at up to 25%, and gains may owe capital-gains tax (a 1031 exchange can defer both). Figures are a year-1 estimate at your 24.0% rate — not tax advice; consult a CPA.
Schools (NCES district)
- District
- Duval
- NCES district ID
- 1200480
- Math proficiency
- 46% ▼ -11.00%
- Reading proficiency
- 45% ▼ -4.00%
- Median HH income
- $48,987
- Composite
- 38.97/100
- National rank
- #4076
- State rank
- #48 of 73 in FL
Livability — Jacksonville
- Score
- 83/100
- State rank
- #50
- US rank
- #911
Category grades
Schools grade is shown separately in the Schools card above.
Census & demographics
- Census place
- Jacksonville, FL
- County
- Duval County · 1,015,274 people
- City population
- 979,034
- Metro
- Jacksonville, FL
- Population (ZIP)
- 42,298
- Household income
- $61,821
- Rent vs Own
- Severe rent burden
- 3324.0
Population outlook (Duval County) Hauer SSP2
- Today (2025)
- 1,013,010 people
- By 2030
- 1,059,228 · +4.6%
- By 2040
- 1,141,439 · +12.7%
- By 2050
- 1,205,258 · +19.0%
- By 2075
- 1,324,282 · +30.7%
- By 2100
- 1,319,620 · +30.3%
Race, ethnicity, and origin ACS 2023
- Neighborhood character
- Diverse neighborhood (Simpson 0.67)
- Race & ethnicity
- White 51% Black 22% Hispanic / Latino 16% Two or more races 11% Asian 7%
- Hispanic origin (detail)
- Mexican 2% Puerto Rican 6% Cuban 4%
- Common ancestry
- Italian 2% Lithuanian 2% American 2%
- Foreign-born
- 16% · Canada, Vietnam, Philippines
- Languages at home
- 78% English-only · Spanish 11% Other Indo-European 3% Arabic 2%
Political lean MEDSL · Duval
- 2024 margin
- Toss-up / Even · D 48.7% · R 50.1% · Other 1.2%
- 2008→2024 swing
- +0.4pp no change · 2008: -1.9pp · 2024: -1.5pp
- All cycles
- 2024: R+1.5 2020: D+3.8 2016: R+1.5 2012: R+3.6 2008: R+1.9
Not yet ingested
- Civics
- —
Market trends
- HPI YoY
- ▼ -221.05%
- Current HPI
- 296.9579
- Rent YoY
- ▼ -0.21%
- Metro
- Jacksonville, FL
- State GDP YoY
- ▲ 3.28%
- F500 in state
- 36
Industry mix (Fortune 500 HQ in FL)
| Industry | F500 HQs | Revenue |
|---|---|---|
| Industrial Technology | 2 | $29B |
|
||
| Insurance | 2 | $17B |
|
||
| Retail | 1 | $60B |
|
||
| Technology Distribution | 1 | $58B |
|
||
| Homebuilding | 1 | $35B |
|
||
| Technology Manufacturing | 1 | $35B |
|
||
Price history
+180.8% since first listed4 events — show timeline
- 2026-05-06 Price Changed $130,000 realMLS
- 2026-04-30 Listed $150,000 realMLS
- 1990-09-01 Sold (Public Records) $24,909 Public Records
- 1984-02-01 Sold (Public Records) $46,300 Public Records
Property tax history
+14.6%/yrLatest (2025): $129 · +12.8% YoY. Source: county tax records.
Cash-flow waterfall
monthlySold comps — $/sqft
last 12 mo · ≤1 miLoading sold comps…