 Duplex
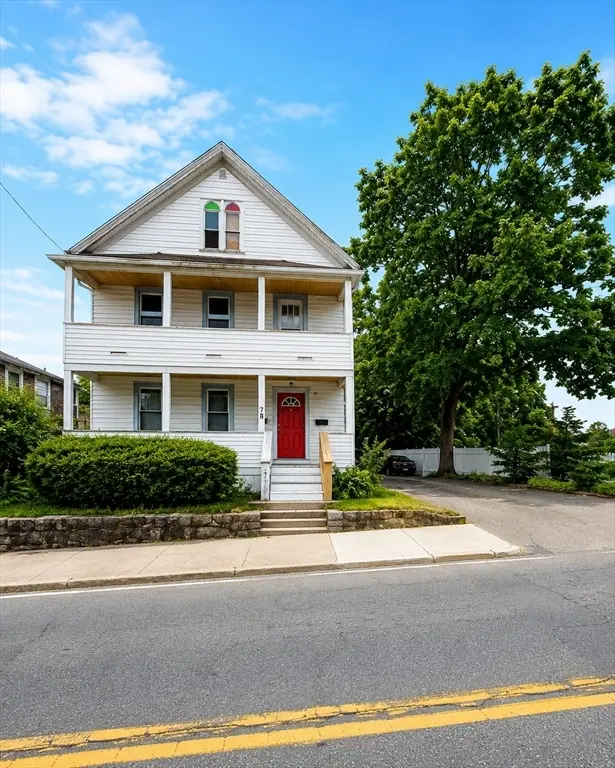
100 S Main St · Attleboro, MA
Flood risk 1/10 · Minimal
- FEMA flood zone
- X (unshaded)
- Chance of flooding over 30 yrs
- 0.0%
- Est. flood insurance / yr
- $507 – $1,088
Fire risk 3/10 · Minor
- Est. fire insurance / yr
- $915 – $1,699
Heat risk 5/10 · Moderate
- Hot days now (above 96°F)
- 7 days/yr
- Hot days in 30 yrs
- 16 days/yr
Wind risk 6/10 · Moderate
- Chance of severe wind over 30 yrs
- 69.0%
Air-quality risk 2/10 · Minimal
- Unhealthy air days now
- 2 days/yr
- Unhealthy air days in 30 yrs
- 2 days/yr
Risk factors via First Street. Map © Google.
Why this score? — see what drove the C grade
The composite is a weighted blend of 9 inputs, each scored 0–100. Each bar is that input's sub-score; the figure is the points it added to the 100-point composite (weight × sub-score).
- Cash flow +19.7/30.0
- ARV discount +15.0/15.0
- DSCR +6.2/10.0
- 1% rule +4.5/10.0
- Rent growth +3.8/5.0
- Schools +3.6/10.0
- Livability +3.4/5.0
- Condition / age +2.5/5.0
- Appreciation +0.0/10.0
$529,999
🖨 Deal sheet 📄 Offer letter ✓ Due diligence
Multi-family units
County records classify this as Multi-Family (2-4 Unit). Listing-text estimate: 2 units. confirmed
Listing remarks MLS
Great opportunity to have a tenant pay your mortgage or obtain an investment property! Large and spacious units offer ample space, with possible 2nd floor unit expansion in the attic. Located across from the train, and near downtown, this property boasts tremendous "walkability." Hardwood flooring, high ceilings and original moldings offer character and a great place to call home, all while the numbers make sense!
Key facts
- Walkable access
- Two-family
- 5,019 sq ft lot
Tags
Property features AI
Finance
- Other: Building total area approximately 2,656 (above grade 2,656); Lot about 0.12 acre; Directions: Use GPS
- HOA & community: Access to public transportation; Nearby shopping
Exterior
- Parking: 6 off-street paved parking spaces; Open parking
- Utilities: Public water; Public sewer; 110V electric
- Home design: Two-family up/down configuration; 2 stories; White exterior color
- Construction: Frame construction; Stone foundation; Shingle roof; Built in public records (year available in records)
- Exterior features: Porch; Deck; Public road frontage
Interior
- Flooring: Wood floors
- Bathrooms: 2 full bathrooms
- Interior features: 12 total rooms; Full basement
Neighborhood map
What this means for you Summary
Snapshot
- This is a 2 × 3-bed/1.0-bath units multifamily listed at $530k.
Deal economics
- At list price, monthly cash flow is $624 ($7k/yr) — positive. Per door: $312/mo.
- The deal already cash-flows at list — no discount required.
- To meet the 1% rule (rent ≥ 1% of price), the offer needs to be $506k (4.6% below list).
- Recommended offer: $506k (4.6% below list) — sets the bar for 1% rule.
- Cap rate 7.7% vs local median 3.1% in Attleboro — top-decile yield for the area; either an underpriced asset or a hidden risk that comps aren't pricing in. Stress-test before assuming the spread holds.
Location & tenants
- Location reads 67/100 on livability (#165 in MA) — a middle-class / working-renter tenant base. Strengths: commute A+, employment A+, housing A+; Watch: amenities F, cost of living F, health & safety F.
- Attleboro (suburban): math 34% / reading 46% proficiency, ranked #194 of 302 in MA (top 64%) — families likely to look elsewhere, expect single-tenant / working-renter base with shorter leases.
- Market conditions: Rents rising fast (+5.3%/yr); 54 active listings in the ZIP; solid renter incomes; 760 units permitted in Bristol County in 2024 (142 in 5+ unit buildings).
- At $5,057/mo this rent would consume 61% of the median local household income ($99k/yr) (locally 1378% of renters already pay >50% of income on rent) — very limited rent-growth headroom before tenants either downsize or default.
Forward outlook
- Local home prices are declining (-3.0%/yr); year-one equity from $4k of loan paydown is wiped out by about $16k of value loss. Plan a longer hold.
- Bristol County population projected to shrink 3% by 2050 — rents likely to lag national; underwrite the cash flow, not the appreciation.
Negotiation context
- Only 10 days on market — expect competitive offers; lowballing is unlikely to land.
- 6 sale attempts since 25y ago with the ask held roughly flat each time — persistent listings suggest the price (not the market) is what's stuck; bring a comps-based counter.
- Current owner paid $158k; list at $530k implies a 237% gain — meaningful room to come down on a strong offer.
Risks & watch-outs
- Watch-outs: built in 1910 — expect roof / HVAC / electrical / plumbing capex.
- Climate carrying-cost: major wind risk, 69% chance of damaging wind over 30y; extreme-heat days projected 7→16/yr by 2055 (HVAC capex compounding) — expect insurance premiums to compound above CPI over the hold.
Questions for the listing agent
- Can we see the unit-by-unit rent roll, current vacancy, and any below-market leases? What's the average tenancy length?
- What capital expenditures (roof, boiler, parking lot, exteriors) have been made in the last 5 years, and what's planned in the next 2?
- Built in 1910 — when were the roof, HVAC, electrical panel, plumbing, and water heater last replaced?
- Is there a deadline driving the sale (1031 exchange, divorce, estate, relocation)? That informs how much negotiation room exists.
- What's the average days-on-market for RENTAL listings here right now (not sales)? A rising rental-DOM trend means longer vacancies and softer asking-rent achievability than the comps imply.
- What's the recent tenant-quality profile in this submarket — average credit score on applications, eviction rate, late-payment / NSF rate, and stable-employment percentage? A property-management company in the area should have these aggregated.
- How much new apartment / multifamily construction is in the pipeline within 1–3 miles? Heavy new supply (>2% of stock underway) typically softens rents 12–24 months out; light construction supports rent growth.
Investment metrics
- 1% rule
- 0.95% ✗
- Cap rate
- 7.71%
- Cash-on-cash
- 5.05%
- DSCR
- 1.22
- GRM
- 8.7
CMA / ARV
- ARV (on-the-fly)
- $658,688
- Comps found
- 12
Show comp detail 12 sales within ~0.75 mi
| Address | Dist | Beds/Ba | Sqft | Sold | Price | $/sf | Match |
|---|---|---|---|---|---|---|---|
| 9 School St | 0.15mi | 6/2.5 | 2,595 (-2%) | 18mo | $705,000 | $272 | 72 |
| 21 4th St | 0.34mi | 6/3.0 | 2,773 (+4%) | 2mo | $655,000 | $236 | 71 |
| 17 First St | 0.26mi | 6/3.5 | 2,830 (+7%) | 5mo | $651,000 | $230 | 67 |
| 10 Falmouth St | 0.40mi | 7/3.0 (+1) | 2,668 (+0%) | 9mo | $535,000 | $201 | 64 |
| 44-46 Mulberry St | 0.46mi | 6/3.0 | 2,592 (-2%) | 8mo | $675,000 | $260 | 64 |
| 108 James St | 0.47mi | 6/4.0 | 2,580 (-3%) | 4mo | $710,000 | $275 | 62 |
| 18-20 Jefferson St | 0.33mi | 6/2.0 | 3,018 (+14%) | 3mo | $715,000 | $237 | 59 |
| 12 Sturdy | 0.51mi | 6/4.0 | 2,711 (+2%) | 9mo | $780,000 | $288 | 57 |
| 52-54 Orange St | 0.51mi | 6/2.0 | 2,418 (-9%) | 6mo | $580,000 | $240 | 56 |
| 10 Foley St | 0.72mi | 6/3.0 | 2,417 (-9%) | 12mo | $600,000 | $248 | 38 |
| 14 Perrin St | 0.43mi | 5/4.0 (-1) | 3,022 (+14%) | 13mo | $795,000 | $263 | 33 |
| 119 Bank St | 0.56mi | 5/4.0 (-1) | 3,048 (+15%) | 9mo | $575,000 | $189 | 29 |
Match score weights: distance 35% · size 25% · config 20% · recency 20%. Top-matched comps best support the ARV.
Projected returns pro-forma
-3.0% appreciation · 5.3% rent growth · sell at horizon
- IRR
- -6.1%
- Equity multiple
- 0.77×
- Total profit
- $-34,246
- Equity at exit
- $79,025
- IRR
- 6.0%
- Equity multiple
- 1.49×
- Total profit
- $72,462
- Equity at exit
- $45,825
Cash invested: $148,400 (down + closing). Projections, not guarantees.
Landlord ↔ Tenant lean methodology
- Overall (STATE)
- 20 Strongly Tenant-Friendly
- State Massachusetts
- 20 Strongly Tenant-Friendly · D+15
- County
- — inherits STATE
- City
- — inherits STATE
ZIP-level market 02703
- Rents YoY
- 5.3%
- Active inventory
- 54
- Price-to-rent
- 17.5×
Monthly cashflow live
- Estimated rent
- $5,057 high interval (Pro) →
- Mortgage (P&I)
- −$2,779
- Tax from tax record
- −$370 /mo · $4,445/yr
- Insurance
- −$221
- HOA
- −$0
- Vacancy / Maint / Mgmt
- −$1,062
- Net cashflow
- $624
Break-even live
2-unit breakdown (identical units grouped — click to expand)
| Units | Beds | Baths | Est. rent |
|---|---|---|---|
| 2× units | 3 | 1 | $5,058 |
| #1 | 3 | 1 | $2,529 |
| #2 | 3 | 1 | $2,529 |
| Total (2 units) | $5,057 | ||
UW: 25.0% down · 7.5% · 30yr · 1.5% tax · 5.0% vac · 8.0% maint · 8.0% mgmt
Financing live
Cash to close
- Down payment
- $132,500
- Closing costs
- $15,900
- Reserves months
- —
- Total cash needed
- —
Loan-product check · same deal, 3 products live
Conventional
25% down · 7.5% · 30yr
- Down + closing
- —
- Monthly P&I
- —
- Monthly cashflow
- —
- DSCR
- —
- Eligible?
- —
Personal DTI + credit; lowest rate.
DSCR
20% down · 8.5% · 30yr
- Down + closing
- —
- Monthly P&I
- —
- Monthly cashflow
- —
- DSCR
- —
- Eligible?
- —
No personal income docs; deal must DSCR.
Hard money
10% down · 12.0% · 12mo
- Down + closing
- —
- Monthly P&I
- —
- Monthly cashflow
- —
- DSCR
- —
- Eligible?
- —
Short-term bridge; refi at stabilization.
Listing history 7 events
-
2026-06-18days on market $529,999 Active 10 DOM
-
2026-06-17days on market $529,999 Active 9 DOM
-
2026-06-16days on market $529,999 Active 8 DOM
-
2026-06-15days on market $529,999 Active 7 DOM
-
2026-06-13statusdays on market $529,999 Active 5 DOM
-
2026-06-08remarks 656-char remark
-
2026-06-08$529,999 New 1 DOM
ⓘ Source: listings_history table (triggers on properties + properties_extension) + one-shot
backfill from property_details.listing_events for pre-trigger history.
Tax reassessment forecast MA · Partial reset (capped growth)
- Current annual tax
- $4,445 · $370/mo
- Projected year-2 tax
- $5,482 · $457/mo
- Expected delta
- +$1,037/yr (+$86/mo · 23.3%)
ⓘ Screening estimate from a state-policy table — verify with the county assessor before closing.
Climate risk First Street
- Flood 1/10 Low FEMA zone X (unshaded) · 0% chance over 30 yrs
- Wildfire 3/10 Moderate
- Heat 5/10 Major 7 d/yr ≥96°F today · 16 d/yr by 30 yrs out
- Wind 6/10 Major 69% chance of damaging wind over 30 yrs
- Air quality 2/10 Low 2 unhealthy d/yr today · 2 by 30 yrs out
Nearby sold comps map
Loading sold comps map…
Walkable amenities ~0.75 mi
Loading nearby amenities…
Taxation est. · year 1
- Rental income
- $60,684
- − Mortgage interest
- −$29,688
- − Property taxes
- −$4,445
- − Insurance
- −$2,650
- − Repairs & maintenance
- −$4,855
- − Management
- −$4,855
- − Depreciation
- −$15,418
- Taxable loss
- −$1,227
- Est. tax savings @ 24.0%
- +$294
- After-tax cash flow
- $7,787/yr
For passive investors: Depreciation is non-cash, so a rental often shows a tax loss while cash-flowing — sheltering income. Rental losses are passive: they offset passive income freely, and up to $25,000/yr can offset ordinary (W-2) income if you actively participate and your MAGI is under $100k (phasing out to $0 by $150k); unused losses carry forward. On sale, claimed depreciation is recaptured at up to 25%, and gains may owe capital-gains tax (a 1031 exchange can defer both). Figures are a year-1 estimate at your 24.0% rate — not tax advice; consult a CPA.
Schools (NCES district)
- District
- Attleboro
- NCES district ID
- 2502190
- Math proficiency
- 34% ▼ -16.00%
- Reading proficiency
- 46% ▼ -7.00%
- Median HH income
- $66,516
- Composite
- 36.03/100
- National rank
- #4778
- State rank
- #194 of 302 in MA
Livability — Attleboro
- Score
- 67/100
- State rank
- #165
- US rank
- #11046
Category grades
Schools grade is shown separately in the Schools card above.
Census & demographics
- Census place
- Attleboro, MA
- County
- Bristol County · 342,083 people
- City population
- 46,713
- Metro
- Providence-Warwick, RI-MA
- Population (ZIP)
- 46,713
- Household income
- $99,152
- Rent vs Own
- Severe rent burden
- 1378.0
Population outlook (Bristol County) Hauer SSP2
- Today (2025)
- 570,212 people
- By 2030
- 571,181 · +0.2%
- By 2040
- 565,389 · -0.8%
- By 2050
- 552,141 · -3.2%
- By 2075
- 520,923 · -8.6%
- By 2100
- 474,363 · -16.8%
Race, ethnicity, and origin ACS 2023
- Neighborhood character
- Predominantly White (78%)
- Race & ethnicity
- White 78% Hispanic / Latino 9% Two or more races 6% Black 6% Asian 5%
- Hispanic origin (detail)
- Puerto Rican 3%
- Common ancestry
- Lithuanian 8% Russian 8% Romanian 4%
- Foreign-born
- 13% · Canada, China
- Languages at home
- 82% English-only · Spanish 6% Other Indo-European 5% French/Haitian/Cajun 3%
Political lean MEDSL · Bristol
- 2024 margin
- Toss-up / Even · D 49.8% · R 48.5% · Other 1.8%
- 2008→2024 swing
- -21.9pp toward R · 2008: 23.2pp · 2024: 1.3pp
- All cycles
- 2024: D+1.3 2020: D+12.0 2016: D+9.3 2012: D+20.5 2008: D+23.2
Not yet ingested
- Civics
- —
Market trends
- HPI YoY
- ▼ -538.30%
- Current HPI
- 317.5337
- Rent YoY
- ▲ 5.30%
- Metro
- Providence-Warwick, RI-MA
- State GDP YoY
- ▲ 2.28%
- F500 in state
- 38
Industry mix (Fortune 500 HQ in MA)
| Industry | F500 HQs | Revenue |
|---|---|---|
| Technology | 3 | $17B |
|
||
| Insurance | 2 | $84B |
|
||
| Retail | 2 | $76B |
|
||
| Life Sciences | 1 | $43B |
|
||
| Energy Technology | 1 | $31B |
|
||
| Aerospace / Defense | 1 | $18B |
|
||
Price history
+179.1% since first listed16 events — show timeline
- 2026-06-08 Listed $529,999 MLS PIN
- 2014-10-10 Sold (MLS) $157,500 MLS PIN
- 2014-08-28 Contingent — MLS PIN
- 2014-08-19 Relisted — MLS PIN
- 2014-07-22 Contingent — MLS PIN
- 2014-07-15 Price Changed $169,900 MLS PIN
- 2014-06-10 Relisted — MLS PIN
- 2014-05-29 Contingent — MLS PIN
- 2014-05-19 Listed $174,900 MLS PIN
- 2002-02-28 Sold (Public Records) $184,000 Public Records
- 2002-02-28 Sold (MLS) $184,000 RIS
- 2002-02-28 Sold (MLS) $184,000 MLS PIN
- 2001-12-28 Listing Removed — RIS
- 2001-12-28 Listing Removed — MLS PIN
- 2001-11-13 Listed $189,900 RIS
- 2001-11-13 Listed $189,900 MLS PIN
Property tax history
+3.7%/yrLatest (2023): $4,445 · +4.6% YoY. Source: county tax records.
Cash-flow waterfall
monthlySold comps — $/sqft
last 12 mo · ≤1 miLoading sold comps…