124 Foscue St · Sulphur Springs, TX
Flood risk 1/10 · Minimal
- FEMA flood zone
- X (unshaded)
- Chance of flooding over 30 yrs
- 0.0%
- Est. flood insurance / yr
- $507 – $1,088
Fire risk 4/10 · Minor
- Est. fire insurance / yr
- $1,222 – $2,270
Heat risk 7/10 · Major
- Hot days now (above 109°F)
- 7 days/yr
- Hot days in 30 yrs
- 23 days/yr
Wind risk 6/10 · Moderate
- Chance of severe wind over 30 yrs
- 27.0%
Air-quality risk 2/10 · Minimal
- Unhealthy air days now
- 0 days/yr
- Unhealthy air days in 30 yrs
- 1 days/yr
Risk factors via First Street. Map © Google.
Why this score? — see what drove the C+ grade
The composite is a weighted blend of 9 inputs, each scored 0–100. Each bar is that input's sub-score; the figure is the points it added to the 100-point composite (weight × sub-score).
- Cash flow +27.5/30.0
- DSCR +9.6/10.0
- 1% rule +8.7/10.0
- ARV discount +5.1/15.0
- Schools +3.6/10.0
- Livability +3.5/5.0
- Rent growth +2.5/5.0
- Condition / age +2.5/5.0
- Appreciation +0.0/10.0
$139,900
🖨 Deal sheet 📄 Offer letter ✓ Due diligence
Listing remarks MLS
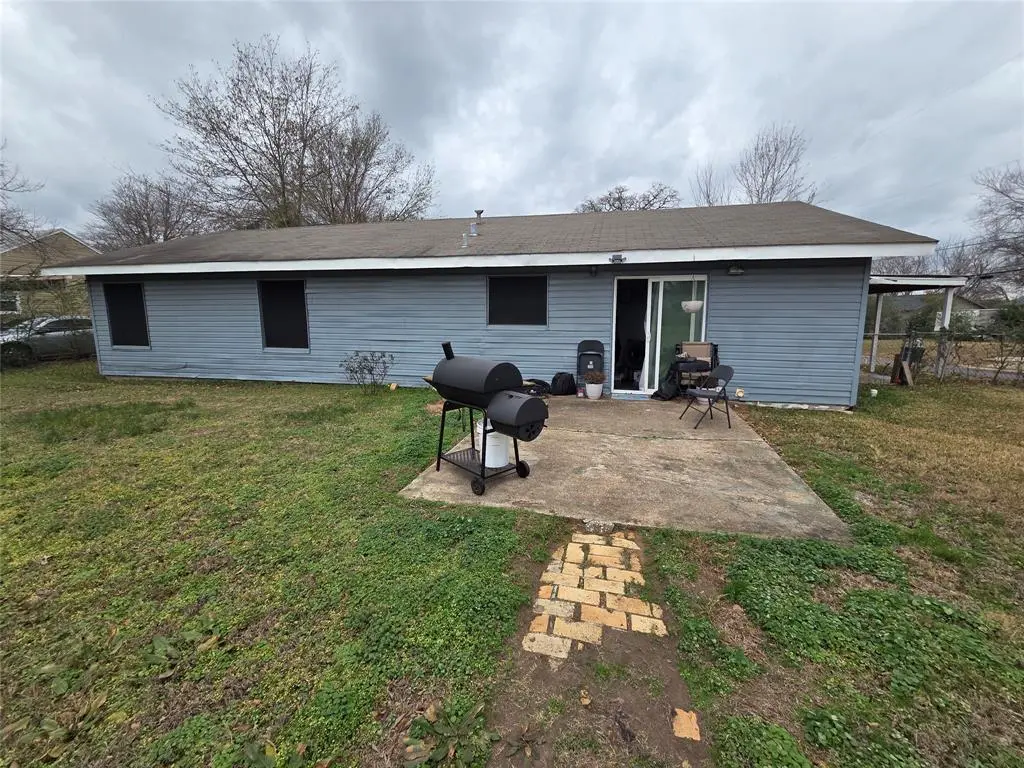
Charming 3-bedroom, 1-bath home offering 1,318 sqft of updated living space in Sulphur Springs! Features a newer roof, updated electrical with new lighting and outlets, new water heater, and a new HVAC system. Enjoy a fully remodeled kitchen and bathroom, with all appliances included new in 2021-2022. Move-in ready
Key facts
- Updated electrical
- Newer roof
- New water heater
Tags
Neighborhood map
What this means for you Summary
Snapshot
- This is a 3-bed/1.0-bath single-family listed at $140k.
Deal economics
- At list price, monthly cash flow is $413 ($5k/yr) — positive.
- The deal already cash-flows at list — no discount required.
- Meets the 1% rule at list price ($2k rent vs $140k).
- Recommended offer: $132k (6.0% below list) — sets the bar for market timing.
- Cap rate 9.8% vs local median 4.3% in Sulphur Springs — top-decile yield for the area; either an underpriced asset or a hidden risk that comps aren't pricing in. Stress-test before assuming the spread holds.
Location & tenants
- Location reads 70/100 on livability (#350 in TX) — a middle-class / working-renter tenant base. Strengths: cost of living A+, housing A+, crime A; Watch: employment D+, schools D, amenities F.
- Sulphur Springs ISD (town): math 46% / reading 40% proficiency, ranked #323 of 826 in TX (top 39%) — families likely to look elsewhere, expect single-tenant / working-renter base with shorter leases.
- Market conditions: 378 active listings in the ZIP; 3 comparable units currently listed for rent nearby; rentals lingering (median 44d on market — plan ~5-8 weeks vacancy on turnover, expect pricing pressure); 100% of comp listings sitting > 30 days — soft ceiling on asking rent; 66 units permitted in Hopkins County in 2024 (0 in 5+ unit buildings).
- This rent runs 33% of the median local income ($70k/yr) — at the standard rent-burdened threshold; future hikes will face affordability resistance.
Forward outlook
- Local home prices are declining (-3.0%/yr); year-one equity from $967 of loan paydown is wiped out by about $4k of value loss. Plan a longer hold.
- Hopkins County population projected at +6% by 2050 — modest demand growth; plan on rents tracking national, not racing it.
- At projected returns (-3.0% appreciation + 3.0% rent growth), your $39k cash investment doubles in ~9 years — after that, you're playing with house money.
Negotiation context
- It's been on market 61 days — a 6% lower offer ($132k) is reasonable based on typical stale-listing flexibility.
- 4 sale attempts since 5y ago with the ask held roughly flat each time — persistent listings suggest the price (not the market) is what's stuck; bring a comps-based counter.
Risks & watch-outs
- Watch-outs: property tax is 2.7% of price; built in 1956 — expect roof / HVAC / electrical / plumbing capex.
- Climate carrying-cost: major wind risk, 27% chance of damaging wind over 30y; extreme-heat days projected 7→23/yr by 2055 (HVAC capex compounding) — expect insurance premiums to compound above CPI over the hold.
Questions for the listing agent
- It's been on market 61 days. Have you received any prior offers? Is the seller open to a 6% concession, seller financing, or rate buy-down credit?
- Built in 1956 — when were the roof, HVAC, electrical panel, plumbing, and water heater last replaced?
- Property tax is high relative to price — has the assessment been appealed recently, and will the sale trigger a re-assessment?
- Why hasn't it sold? Are there any deal-killer items the seller is aware of (foundation, flood, title, zoning, code violations)?
- Is there a deadline driving the sale (1031 exchange, divorce, estate, relocation)? That informs how much negotiation room exists.
- Schools are D-rated, which usually means shorter tenancies and higher turnover. Who's the typical renter profile here, and what's been the actual vacancy rate?
- What's the average days-on-market for RENTAL listings here right now (not sales)? A rising rental-DOM trend means longer vacancies and softer asking-rent achievability than the comps imply.
- What's the recent tenant-quality profile in this submarket — average credit score on applications, eviction rate, late-payment / NSF rate, and stable-employment percentage? A property-management company in the area should have these aggregated.
- How much new for-sale + rental construction is in the pipeline within 1–3 miles? Heavy new supply typically softens prices + rents 12–24 months out; constrained supply supports both.
Investment metrics
- 1% rule
- 1.37% ✓
- Cap rate
- 9.83%
- Cash-on-cash
- 12.64%
- DSCR
- 1.56
- GRM
- 6.1
CMA / ARV
- ARV (median comp)
- $132,724
- List price
- $139,900
- Delta
- 5.41%
- Verdict
- FAIR
- Comps
- 20 within 1.0 mi
Show comp detail 12 sales within ~0.75 mi
| Address | Dist | Beds/Ba | Sqft | Sold | Price | $/sf | Match |
|---|---|---|---|---|---|---|---|
| 809 Jefferson St E | 0.11mi | 3/2.0 | 1,400 (+6%) | 10mo | $225,000 | $161 | 73 |
| 816 Jefferson St E | 0.14mi | 3/2.0 | 1,244 (-6%) | 11mo | $234,900 | $189 | 71 |
| 709 Jefferson St E | 0.17mi | 3/1.0 | 1,152 (-13%) | 3mo | $65,000 | $56 | 68 |
| 903 College St | 0.26mi | 3/1.0 | 1,190 (-10%) | 10mo | $89,000 | $75 | 64 |
| 618 Putman St | 0.40mi | 3/2.0 | 1,350 (+2%) | 15mo | $230,000 | $170 | 61 |
| 110 Mitchell St | 0.21mi | 2/1.0 (-1) | 1,200 (-9%) | 12mo | $40,000 | $33 | 60 |
| 417 Putman St | 0.49mi | 3/1.0 | 1,488 (+13%) | 1mo | $130,000 | $87 | 55 |
| 128 Oak Grove Dr | 0.73mi | 3/1.5 | 1,288 (-2%) | 13mo | $225,000 | $175 | 50 |
| 210 Calvert St | 0.56mi | 3/2.0 | 1,473 (+12%) | 2mo | $195,500 | $133 | 48 |
| 628 Fuller St | 0.45mi | 3/1.5 | 1,458 (+11%) | 15mo | $150,000 | $103 | 47 |
| 207 California St E | 0.68mi | 2/1.0 (-1) | 1,129 (-14%) | 3mo | $84,000 | $74 | 36 |
| 466 Cypress | 0.74mi | 4/2.0 (+1) | 1,473 (+12%) | 8mo | $249,174 | $169 | 30 |
Match score weights: distance 35% · size 25% · config 20% · recency 20%. Top-matched comps best support the ARV.
Projected returns pro-forma
-3.0% appreciation · 3.0% rent growth · sell at horizon
- IRR
- 2.5%
- Equity multiple
- 1.10×
- Total profit
- $3,722
- Equity at exit
- $20,860
- IRR
- 12.1%
- Equity multiple
- 1.96×
- Total profit
- $37,543
- Equity at exit
- $12,096
Cash invested: $39,172 (down + closing). Projections, not guarantees.
Landlord ↔ Tenant lean methodology
- Overall (STATE)
- 87 Strongly Landlord-Friendly
- State Texas
- 87 Strongly Landlord-Friendly · R+5
- County
- — inherits STATE
- City
- — inherits STATE
ZIP-level market 75482
- Active inventory
- 378
- Price-to-rent
- 6.1×
Monthly cashflow live
- Estimated rent
- $1,922 medium interval (Pro) →
- Mortgage (P&I)
- −$734
- Tax from tax record
- −$314 /mo · $3,767/yr
- Insurance
- −$58
- HOA
- −$0
- Vacancy / Maint / Mgmt
- −$404
- Net cashflow
- $413
Break-even live
UW: 25.0% down · 7.5% · 30yr · 1.5% tax · 5.0% vac · 8.0% maint · 8.0% mgmt
Financing live
Cash to close
- Down payment
- $34,975
- Closing costs
- $4,197
- Reserves months
- —
- Total cash needed
- —
Loan-product check · same deal, 3 products live
Conventional
25% down · 7.5% · 30yr
- Down + closing
- —
- Monthly P&I
- —
- Monthly cashflow
- —
- DSCR
- —
- Eligible?
- —
Personal DTI + credit; lowest rate.
DSCR
20% down · 8.5% · 30yr
- Down + closing
- —
- Monthly P&I
- —
- Monthly cashflow
- —
- DSCR
- —
- Eligible?
- —
No personal income docs; deal must DSCR.
Hard money
10% down · 12.0% · 12mo
- Down + closing
- —
- Monthly P&I
- —
- Monthly cashflow
- —
- DSCR
- —
- Eligible?
- —
Short-term bridge; refi at stabilization.
Rent comps 3 comps
| Address | Beds | Baths | Sqft | Rent | $/sqft | DOM | Units | Dist |
|---|---|---|---|---|---|---|---|---|
| 709 Fuller St Sulphur Springs, TX | 3.0 | 2.0 | 1100 | $2,200 | $2.00 | 44d | 1 | 0.39mi |
| 604 W A St Sulphur Springs, TX | 3.0 | 2.0 | 1216 | $1,500 | $1.23 | 44d | 1 | 0.86mi |
| 1045 Jackson St N Sulphur Springs, TX | 3.0 | 2.0 | 1150 | $1,750 | $1.52 | 44d | 1 | 0.93mi |
Listing history 17 events
-
2026-05-04price $139,900 316-char remark
Show marketing remark (316 chars)
Charming 3-bedroom, 1-bath home offering 1,318 sqft of updated living space in Sulphur Springs! Features a newer roof, updated electrical with new lighting and outlets, new water heater, and a new HVAC system. Enjoy a fully remodeled kitchen and bathroom, with all appliances included new in 2021-2022. Move-in ready
-
2026-03-24$144,900 Active 316-char remark
Show marketing remark (316 chars)
Charming 3-bedroom, 1-bath home offering 1,318 sqft of updated living space in Sulphur Springs! Features a newer roof, updated electrical with new lighting and outlets, new water heater, and a new HVAC system. Enjoy a fully remodeled kitchen and bathroom, with all appliances included new in 2021-2022. Move-in ready
-
2026-03-19price $144,900
-
2026-03-02price $149,900
-
2026-02-11price $159,900
-
2026-01-23$169,900 Active
-
2023-07-05price $155,000
-
2023-06-07price $158,000
-
2023-05-24price $160,000
-
2023-04-22$162,000 Active
-
2022-01-28soldstatus
-
2022-01-27soldstatus Sold
-
2021-12-20status Pending
-
2021-12-10price $134,900
-
2021-10-08$149,700 Active
-
2002-06-03soldstatus
-
1999-10-01soldstatus
ⓘ Source: listings_history table (triggers on properties + properties_extension) + one-shot
backfill from property_details.listing_events for pre-trigger history.
Tax reassessment forecast TX · Resets to sale price
- Current annual tax
- $3,767 · $314/mo
- Projected year-2 tax
- $3,767 · $314/mo
- Expected delta
- $0/yr ($0/mo · 0.0%)
ⓘ Screening estimate from a state-policy table — verify with the county assessor before closing.
Climate risk First Street
- Flood 1/10 Low FEMA zone X (unshaded) · 0% chance over 30 yrs
- Wildfire 4/10 Moderate
- Heat 7/10 Severe 7 d/yr ≥109°F today · 23 d/yr by 30 yrs out
- Wind 6/10 Major 27% chance of damaging wind over 30 yrs
- Air quality 2/10 Low 0 unhealthy d/yr today · 1 by 30 yrs out
Nearby sold comps map
Loading sold comps map…
Walkable amenities ~0.75 mi
Loading nearby amenities…
Taxation est. · year 1
- Rental income
- $23,065
- − Mortgage interest
- −$7,837
- − Property taxes
- −$3,767
- − Insurance
- −$700
- − Repairs & maintenance
- −$1,845
- − Management
- −$1,845
- − Depreciation
- −$4,070
- Taxable income
- $3,002
- Est. tax owed @ 24.0%
- −$720
- After-tax cash flow
- $4,231/yr
For passive investors: Depreciation is non-cash, so a rental often shows a tax loss while cash-flowing — sheltering income. Rental losses are passive: they offset passive income freely, and up to $25,000/yr can offset ordinary (W-2) income if you actively participate and your MAGI is under $100k (phasing out to $0 by $150k); unused losses carry forward. On sale, claimed depreciation is recaptured at up to 25%, and gains may owe capital-gains tax (a 1031 exchange can defer both). Figures are a year-1 estimate at your 24.0% rate — not tax advice; consult a CPA.
Schools (NCES district)
- District
- Sulphur Springs ISD
- NCES district ID
- 4841820
- Math proficiency
- 46% ▼ -7.00%
- Reading proficiency
- 40% ▼ -4.00%
- Median HH income
- $42,871
- Composite
- 36.33/100
- National rank
- #4692
- State rank
- #323 of 826 in TX
Livability — Sulphur Springs
- Score
- 70/100
- State rank
- #350
- US rank
- #7665
Category grades
Schools grade is shown separately in the Schools card above.
Census & demographics
- Census place
- Sulphur Springs, TX
- County
- Hopkins County · 26,483 people
- City population
- 26,483
- Metro
- Sulphur Springs, TX
- Population (ZIP)
- 26,483
- Household income
- $69,970
- Rent vs Own
- Severe rent burden
- 543.0
Population outlook (Hopkins County) Hauer SSP2
- Today (2025)
- 38,107 people
- By 2030
- 38,867 · +2.0%
- By 2040
- 40,009 · +5.0%
- By 2050
- 40,448 · +6.1%
- By 2075
- 40,669 · +6.7%
- By 2100
- 37,234 · -2.3%
Race, ethnicity, and origin ACS 2023
- Neighborhood character
- Predominantly White (70%)
- Race & ethnicity
- White 70% Hispanic / Latino 17% Black 9% Two or more races 7% Asian 1%
- Hispanic origin (detail)
- Mexican 15%
- Common ancestry
- Slovak 2% Lithuanian 2% Iranian 1%
- Foreign-born
- 9% · Canada, Vietnam
- Languages at home
- 84% English-only · Spanish 14% Vietnamese 1%
Political lean MEDSL · Hopkins
- 2024 margin
- Solid R (+64.6) · D 17.4% · R 82.0%
- 2008→2024 swing
- -20.0pp toward R · 2008: -44.7pp · 2024: -64.6pp
- All cycles
- 2024: R+64.6 2020: R+60.7 2016: R+60.8 2012: R+55.4 2008: R+44.7
Not yet ingested
- Civics
- —
Market trends
- HPI YoY
- ▼ -125.79%
- Current HPI
- 156.0526
- Rent YoY
- —
- Metro
- Sulphur Springs, TX
- State GDP YoY
- ▲ 3.95%
- F500 in state
- 110
Industry mix (Fortune 500 HQ in TX)
| Industry | F500 HQs | Revenue |
|---|---|---|
| Energy | 16 | $1,198B |
|
||
| Technology | 5 | $198B |
|
||
| Engineering / Construction | 4 | $72B |
|
||
| Energy Services | 3 | $60B |
|
||
| Utilities | 3 | $41B |
|
||
| Healthcare | 2 | $330B |
|
||
Price history
-6.5% since first listed17 events — show timeline
- 2026-05-04 Price Changed $139,900 NTREIS
- 2026-03-24 Listed $144,900 NTREIS
- 2026-03-19 Price Changed $144,900 GTAR
- 2026-03-02 Price Changed $149,900 GTAR
- 2026-02-11 Price Changed $159,900 GTAR
- 2026-01-23 Listed $169,900 GTAR
- 2023-07-05 Price Changed $155,000 NTREIS
- 2023-06-07 Price Changed $158,000 NTREIS
- 2023-05-24 Price Changed $160,000 NTREIS
- 2023-04-22 Listed $162,000 NTREIS
- 2022-01-28 Sold (Public Records) — Public Records
- 2022-01-27 Sold (MLS) — NTREIS
- 2021-12-20 Pending — NTREIS
- 2021-12-10 Price Changed $134,900 NTREIS
- 2021-10-08 Listed $149,700 NTREIS
- 2002-06-03 Sold (Public Records) — Public Records
- 1999-10-01 Sold (Public Records) — Public Records
Property tax history
+10.2%/yrLatest (2025): $3,767 · -1.7% YoY. Source: county tax records.
Cash-flow waterfall
monthlySold comps — $/sqft
last 12 mo · ≤1 miLoading sold comps…