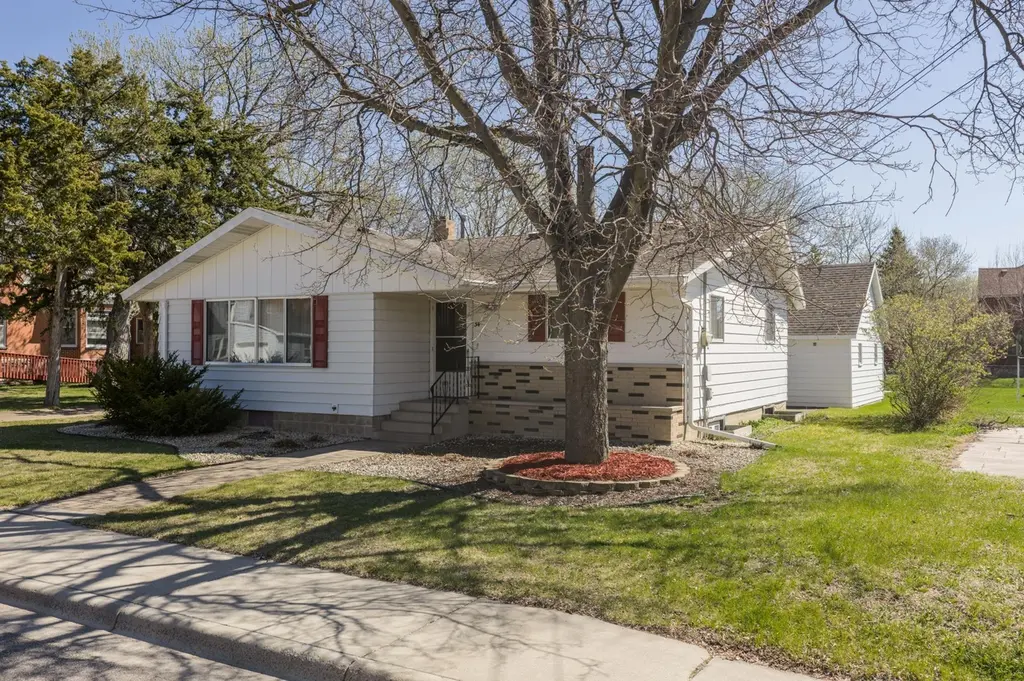
34 Ivy Ave NE · Richmond, MN
Flood risk 1/10 · Minimal
- FEMA flood zone
- X (unshaded)
- Chance of flooding over 30 yrs
- 0.0%
- Est. flood insurance / yr
- $507 – $1,088
Fire risk 1/10 · Minimal
- Est. fire insurance / yr
- $888 – $1,650
Heat risk 2/10 · Minimal
- Hot days now (above 97°F)
- 7 days/yr
- Hot days in 30 yrs
- 14 days/yr
Wind risk 2/10 · Minimal
- Chance of severe wind over 30 yrs
- —
Air-quality risk 3/10 · Minor
- Unhealthy air days now
- 3 days/yr
- Unhealthy air days in 30 yrs
- 3 days/yr
Risk factors via First Street. Map © Google.
Why this score? — see what drove the B- grade
The composite is a weighted blend of 9 inputs, each scored 0–100. Each bar is that input's sub-score; the figure is the points it added to the 100-point composite (weight × sub-score).
- Cash flow +25.3/30.0
- ARV discount +15.0/15.0
- DSCR +8.3/10.0
- 1% rule +6.6/10.0
- Schools +4.7/10.0
- Livability +3.6/5.0
- Condition / age +2.8/5.0
- Rent growth +2.5/5.0
- Appreciation +0.0/10.0
$215,000
🖨 Deal sheet 📄 Offer letter ✓ Due diligence
Listing remarks
Welcome to this well-maintained home offering comfort, functionality, and flexible living spaces. With three bedrooms, two bathrooms, and main floor laundry, this property is thoughtfully designed to support convenient, everyday living—all on the main level. The main floor features two spacious bedrooms, a large and inviting living room, and a generous dining area that flows seamlessly into the kitchen. The kitchen offers an abundance of cabinet space for storage along with newer appliances. A standout feature of the home is the unique additional living space on the main floor, showcasing tongue-and-groove wood walls and ceilings which is an ideal setting for a cozy sitting area, home
Key facts
- 4,791 sq ft lot
- 2 garage spots
- Built 1965
Property features AI
Exterior
- Parking: Attached garage (concrete); 2-car garage, approximately 28x19
- Utilities: City water connected; City sewer connected; Natural gas; Electric with circuit breakers
- Home design: Residential property; Single-level main living (one level listed); Patio/porch; Private road frontage with public maintenance
- Construction: Block foundation; Above-grade and below-grade finished living space
- Exterior features: Metal exterior; Patio; No fencing
Interior
- Kitchen: Kitchen with window
- Bedrooms: Three bedrooms (main and lower level mentions: main floor bedroom, lower level bedroom)
- Flooring: Hardwood floors
- Bathrooms: One full bath on the main floor; One three-quarter bath in the basement
- Heating & cooling: Boiler heating; Ductless mini-split cooling
- Interior features: Finished full basement; Main floor primary bedroom; All living facilities on one level; Main floor bedroom; Main floor laundry; Living/Dining room; Patio
- Laundry & utility: Main level laundry; Washer and dryer included; Washer/Dryer hookup; Utility room in lower level
Neighborhood map
What this means for you Summary
Snapshot
- This is a 3-bed/2.0-bath single-family listed at $215k. Condition is rated average.
Deal economics
- At list price, monthly cash flow is $485 ($6k/yr) — positive.
- The deal already cash-flows at list — no discount required.
- Meets the 1% rule at list price ($2k rent vs $215k).
- Recommended offer: $212k (1.5% below list) — sets the bar for market timing.
- Cap rate 9.0% vs local median 2.8% in Richmond — top-decile yield for the area; either an underpriced asset or a hidden risk that comps aren't pricing in. Stress-test before assuming the spread holds.
Location & tenants
- Location reads 72/100 on livability (#282 in MN) — a middle-class / working-renter tenant base. Strengths: crime A+, cost of living A+, housing A+; Watch: health & safety D+, amenities F, commute F.
- Rocori Public School District (town): math 51% / reading 57% proficiency, ranked #68 of 301 in MN (top 23%) — acceptable for families but not a draw, mixed tenant base, ~2y average lease; only 20% free/reduced lunch — higher-income household profile.
- Market conditions: 60 active listings in the ZIP; 1 comparable units currently listed for rent nearby; 661 units permitted in Stearns County in 2024 (291 in 5+ unit buildings).
Forward outlook
- Local home prices are declining (-3.0%/yr); year-one equity from $1k of loan paydown is wiped out by about $6k of value loss. Plan a longer hold.
- Stearns County population projected at +9% by 2050 — modest demand growth; plan on rents tracking national, not racing it.
Negotiation context
- It's been on market 15 days — a 2% lower offer ($212k) is reasonable based on typical stale-listing flexibility.
Questions for the listing agent
- Built in 1965 — when were the roof, HVAC, electrical panel, plumbing, and water heater last replaced?
- Is there a deadline driving the sale (1031 exchange, divorce, estate, relocation)? That informs how much negotiation room exists.
- Schools are A-rated — typically a magnet for longer-tenancy family renters. What's the average tenant stay here, and is there a school-zone premium baked into asking?
- What's the average days-on-market for RENTAL listings here right now (not sales)? A rising rental-DOM trend means longer vacancies and softer asking-rent achievability than the comps imply.
- What's the recent tenant-quality profile in this submarket — average credit score on applications, eviction rate, late-payment / NSF rate, and stable-employment percentage? A property-management company in the area should have these aggregated.
- How much new for-sale + rental construction is in the pipeline within 1–3 miles? Heavy new supply typically softens prices + rents 12–24 months out; constrained supply supports both.
Investment metrics
- 1% rule
- 1.16% ✓
- Cap rate
- 9.00%
- Cash-on-cash
- 9.67%
- DSCR
- 1.43
- GRM
- 7.2
CMA / ARV
- ARV (median comp)
- $347,120
- List price
- $215,000
- Delta
- -38.06%
- Verdict
- UNDERPRICED
- Comps
- 3 within 2.0 mi
Show comp detail 1 sale within ~0.75 mi
| Address | Dist | Beds/Ba | Sqft | Sold | Price | $/sf | Match |
|---|---|---|---|---|---|---|---|
| 550 4th St St NW | 0.57mi | 4/2.5 (+1) | 2,056 (-14%) | 11mo | $309,000 | $150 | 34 |
Match score weights: distance 35% · size 25% · config 20% · recency 20%. Top-matched comps best support the ARV.
Projected returns pro-forma
-3.0% appreciation · 3.0% rent growth · sell at horizon
- IRR
- -1.7%
- Equity multiple
- 0.94×
- Total profit
- $-3,897
- Equity at exit
- $32,057
- IRR
- 8.0%
- Equity multiple
- 1.61×
- Total profit
- $36,555
- Equity at exit
- $18,589
Cash invested: $60,200 (down + closing). Projections, not guarantees.
Landlord ↔ Tenant lean methodology
- Overall (STATE)
- 46 Balanced
- State Minnesota
- 46 Balanced · D+2
- County
- — inherits STATE
- City
- — inherits STATE
ZIP-level market 56368
- Active inventory
- 60
- Price-to-rent
- 7.2×
Monthly cashflow live
- Estimated rent
- $2,495 medium interval (Pro) →
- Mortgage (P&I)
- −$1,127
- Tax est. 1.5%
- −$269 /mo · $3,225/yr
- Insurance
- −$90
- HOA
- −$0
- Vacancy / Maint / Mgmt
- −$524
- Net cashflow
- $485
Break-even live
UW: 25.0% down · 7.5% · 30yr · 1.5% tax · 5.0% vac · 8.0% maint · 8.0% mgmt
Financing live
Cash to close
- Down payment
- $53,750
- Closing costs
- $6,450
- Reserves months
- —
- Total cash needed
- —
Loan-product check · same deal, 3 products live
Conventional
25% down · 7.5% · 30yr
- Down + closing
- —
- Monthly P&I
- —
- Monthly cashflow
- —
- DSCR
- —
- Eligible?
- —
Personal DTI + credit; lowest rate.
DSCR
20% down · 8.5% · 30yr
- Down + closing
- —
- Monthly P&I
- —
- Monthly cashflow
- —
- DSCR
- —
- Eligible?
- —
No personal income docs; deal must DSCR.
Hard money
10% down · 12.0% · 12mo
- Down + closing
- —
- Monthly P&I
- —
- Monthly cashflow
- —
- DSCR
- —
- Eligible?
- —
Short-term bridge; refi at stabilization.
Rent comps 1 comps
| Address | Beds | Baths | Sqft | Rent | $/sqft | DOM | Units | Dist |
|---|---|---|---|---|---|---|---|---|
| 575 Main St W Unit Th Richmond, MN | 4.0 | 3.0 | 2472 | $2,495 | $1.01 | 43d | 1 | 0.51mi |
Listing history 5 events
-
2026-05-14status Pending 1293-char remark
-
2026-05-07historical Contingent - Inspection 1293-char remark
-
2026-05-05price $215,000 1293-char remark
-
2026-04-30$225,000 Active 1293-char remark
-
2026-04-24historical $225,000 1293-char remark
ⓘ Source: listings_history table (triggers on properties + properties_extension) + one-shot
backfill from property_details.listing_events for pre-trigger history.
Climate risk First Street
- Flood 1/10 Low FEMA zone X (unshaded) · 0% chance over 30 yrs
- Wildfire 1/10 Low
- Heat 2/10 Low 7 d/yr ≥97°F today · 14 d/yr by 30 yrs out
- Wind 2/10 Low
- Air quality 3/10 Moderate 3 unhealthy d/yr today · 3 by 30 yrs out
Nearby sold comps map
Loading sold comps map…
Walkable amenities ~0.75 mi
Loading nearby amenities…
Taxation est. · year 1
- Rental income
- $29,940
- − Mortgage interest
- −$12,043
- − Property taxes
- −$3,225
- − Insurance
- −$1,075
- − Repairs & maintenance
- −$2,395
- − Management
- −$2,395
- − Depreciation
- −$6,255
- Taxable income
- $2,552
- Est. tax owed @ 24.0%
- −$612
- After-tax cash flow
- $5,210/yr
For passive investors: Depreciation is non-cash, so a rental often shows a tax loss while cash-flowing — sheltering income. Rental losses are passive: they offset passive income freely, and up to $25,000/yr can offset ordinary (W-2) income if you actively participate and your MAGI is under $100k (phasing out to $0 by $150k); unused losses carry forward. On sale, claimed depreciation is recaptured at up to 25%, and gains may owe capital-gains tax (a 1031 exchange can defer both). Figures are a year-1 estimate at your 24.0% rate — not tax advice; consult a CPA.
Condition & rehab AI · 12 photos
This home requires moderate repairs and maintenance, with potential for significant value increase through updates to the kitchen and exterior.
Repairs flagged
- Moderate Kitchen cabinets — Worn appearance
- Minor Kitchen countertops — Need cleaning
Value-add opportunities
- Both Paint interior walls — Fresh paint enhances curb appeal and interior aesthetics
- Both Replace worn kitchen cabinets — New cabinets improve functionality and appearance
- Both Replace worn kitchen countertops — New countertops enhance functionality and appearance
- Both Landscaping upgrade — Improved landscaping enhances curb appeal and property value
Renovation cost estimate screening
| Repair item | Severity | Est. cost |
|---|---|---|
| Kitchen cabinets · Worn appearance | Moderate | $3,000–15,000 |
| Kitchen countertops · Need cleaning | Minor | $500–3,000 |
| Total estimated repair cost · 2 items | $3,500–18,000 |
Value-add ROI direction
- Both Paint interior walls — Fresh paint enhances curb appeal and interior aesthetics ↑
- Both Replace worn kitchen cabinets — New cabinets improve functionality and appearance ↑
- Both Replace worn kitchen countertops — New countertops enhance functionality and appearance ↑
- Both Landscaping upgrade — Improved landscaping enhances curb appeal and property value ↑
ⓘ Cost ranges are severity-bucket heuristics (US national rule-of-thumb). Get contractor quotes + a written scope before underwriting a rehab budget.
Schools (NCES district)
- District
- Rocori Public School District
- NCES district ID
- 2709440
- Math proficiency
- 51% ▼ -11.00%
- Reading proficiency
- 57% ▼ -8.00%
- Median HH income
- $63,151
- Composite
- 47.34/100
- National rank
- #2294
- State rank
- #68 of 301 in MN
Livability — Richmond
- Score
- 72/100
- State rank
- #282
- US rank
- #6178
Category grades
Schools grade is shown separately in the Schools card above.
Census & demographics
- Census place
- Richmond, MN
- Population (ZIP)
- 4,162
Population outlook (Stearns County) Hauer SSP2
- Today (2025)
- 162,629 people
- By 2030
- 166,495 · +2.4%
- By 2040
- 172,661 · +6.2%
- By 2050
- 177,480 · +9.1%
- By 2075
- 192,907 · +18.6%
- By 2100
- 206,274 · +26.8%
Race, ethnicity, and origin ACS 2023
- Neighborhood character
- Predominantly White (92%)
- Race & ethnicity
- White 92% Hispanic / Latino 5% Two or more races 4%
- Hispanic origin (detail)
- Mexican 2% Puerto Rican 1%
- Common ancestry
- Romanian 5% Lithuanian 5% Portuguese 4%
- Foreign-born
- 2% · Canada
- Languages at home
- 97% English-only · Spanish 2% German/W. Germanic 1%
Political lean MEDSL · Stearns
- 2024 margin
- Strong R (+26.8) · D 35.7% · R 62.5% · Other 1.9%
- 2008→2024 swing
- -19.8pp toward R · 2008: -7.0pp · 2024: -26.8pp
- All cycles
- 2024: R+26.8 2020: R+22.5 2016: R+27.9 2012: R+12.1 2008: R+7.0
Not yet ingested
- Civics
- —
Market trends
- HPI YoY
- ▼ -201.40%
- Current HPI
- 185.4156
- Rent YoY
- —
- Metro
- —
- State GDP YoY
- ▲ 2.41%
- F500 in state
- 34
Industry mix (Fortune 500 HQ in MN)
| Industry | F500 HQs | Revenue |
|---|---|---|
| Healthcare | 2 | $407B |
|
||
| Retail | 2 | $150B |
|
||
| Consumer Goods | 2 | $32B |
|
||
| Industrial Machinery | 2 | $6B |
|
||
| Agriculture | 1 | $40B |
|
||
| Healthcare / Medical Devices | 1 | $32B |
|
||
Price history
-4.4% since first listed6 events — show timeline
- 2026-06-10 Sold (MLS) $215,000 NORTHSTARMLS as Distributed by MLS Grid
- 2026-05-14 Pending — NORTHSTARMLS as Distributed by MLS Grid
- 2026-05-07 Contingent — NORTHSTARMLS as Distributed by MLS Grid
- 2026-05-05 Price Changed $215,000 NORTHSTARMLS as Distributed by MLS Grid
- 2026-04-30 Listed $225,000 NORTHSTARMLS as Distributed by MLS Grid
- 2026-04-24 Coming Soon $225,000 NORTHSTARMLS as Distributed by MLS Grid
Cash-flow waterfall
monthlySold comps — $/sqft
last 12 mo · ≤1 miLoading sold comps…