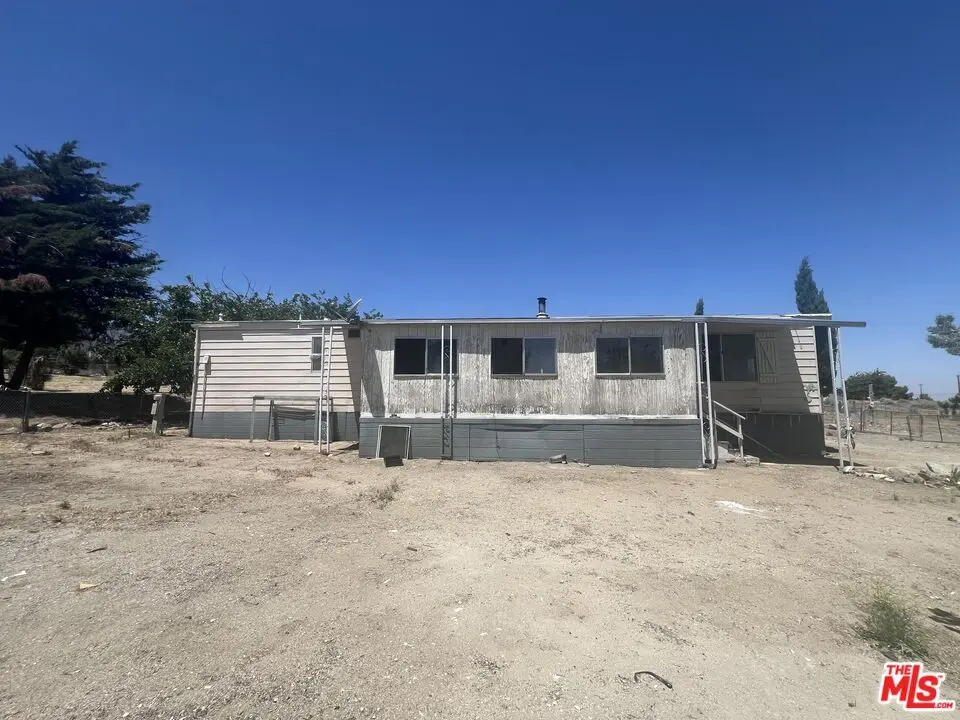
9574 Via Verde Ave · Piñon Hills, CA
Flood risk 4/10 · Minor
- FEMA flood zone
- D
- Chance of flooding over 30 yrs
- 0.24%
- Est. flood insurance / yr
- $544 – $1,084
Fire risk 7/10 · Major
- Est. fire insurance / yr
- $659 – $1,223
Heat risk 5/10 · Moderate
- Hot days now (above 92°F)
- 7 days/yr
- Hot days in 30 yrs
- 18 days/yr
Wind risk 1/10 · Minimal
- Chance of severe wind over 30 yrs
- —
Air-quality risk 10/10 · Severe
- Unhealthy air days now
- 26 days/yr
- Unhealthy air days in 30 yrs
- 30 days/yr
Risk factors via First Street. Map © Google.
Why this score? — see what drove the D+ grade
The composite is a weighted blend of 9 inputs, each scored 0–100. Each bar is that input's sub-score; the figure is the points it added to the 100-point composite (weight × sub-score).
- Cash flow +13.4/30.0
- Appreciation +10.0/10.0
- ARV discount +7.5/15.0
- DSCR +4.0/10.0
- 1% rule +3.8/10.0
- Schools +3.7/10.0
- Rent growth +2.5/5.0
- Livability +2.5/5.0
- Condition / age +2.5/5.0
$249,500
🖨 Deal sheet 📄 Offer letter ✓ Due diligence
Listing remarks MLS
Owner Carry !!Manufactered home NOT on a permanent foundation. Sweeping views and lots of wide open spaces. Very close to Wrightwood. Many repairs have been completed. Nice bright kitchen with new appliances. encloed patio with huge swamp cooler. Forced air heat and wood burning stove. Indoor laundry. Easy access for commuting. Association Amenities: None # of RV Spaces: 0NONE Frontage Type: Dirt Road Special Features: None # of Attached Spaces: 0 # of Detached Spaces: 0
Key facts
- Front patio
- High value lot
- Public water source
Tags
Property features AI
Finance
- Other: Lot approximately 2.51 acres
- HOA & community: No HOA amenities; Association allows pets
Exterior
- Parking: Driveway; 1 garage space
- Home design: Residential mobile home; Single-story
- Construction: Zoned PH/RL
- Exterior features: View of trees and woods
Interior
- Flooring: Carpeted floors
- Bathrooms: 2 full bathrooms
- Heating & cooling: Fireplace heating; Swamp cooler(s)
- Interior features: Living room; Fireplace in living room; Has view of trees/woods
- Laundry & utility: Laundry area; Gas or electric dryer hookup
Neighborhood map
What this means for you Summary
Snapshot
- This is a 2-bed/2.0-bath manufactured listed at $250k.
Deal economics
- At list price, monthly cash flow is $6 ($70/yr) — positive.
- The deal already cash-flows at list — no discount required.
- To meet the 1% rule (rent ≥ 1% of price), the offer needs to be $219k (12.2% below list).
- Recommended offer: $219k (12.2% below list) — sets the bar for 1% rule.
- Cap rate 6.3% vs local median 3.8% in Piñon Hills — top-decile yield for the area; either an underpriced asset or a hidden risk that comps aren't pricing in. Stress-test before assuming the spread holds.
Location & tenants
- Location reads: area grade D — affects rentability + tenant quality, not the cash-flow math above.
- Snowline Joint Unified (rural): math 34% / reading 44% proficiency, ranked #722 of 1,400 in CA (top 52%) — families likely to look elsewhere, expect single-tenant / working-renter base with shorter leases.
- Market conditions: 164 active listings in the ZIP; 5,458 units permitted in San Bernardino County in 2024 (1,500 in 5+ unit buildings).
Forward outlook
- In year one you build about $27k of equity ($2k loan paydown + $25k appreciation (10.0% local appreciation)).
- San Bernardino County population projected at +15% by 2050 — modest demand growth; plan on rents tracking national, not racing it.
- At projected returns (10.0% appreciation + 3.0% rent growth), your $70k cash investment doubles in ~3 years — after that, you're playing with house money.
- By year 2, paydown + projected appreciation supports a ~$43k cash-out refi (75% LTV) — recoverable capital for the next deal without selling this one.
Negotiation context
- It's been on market 15 days — a 2% lower offer ($246k) is reasonable based on typical stale-listing flexibility.
- 4 sale attempts since 12y ago with the ask held roughly flat each time — persistent listings suggest the price (not the market) is what's stuck; bring a comps-based counter.
- Current owner paid $85k; list at $250k implies a 194% gain — meaningful room to come down on a strong offer.
Risks & watch-outs
- Climate carrying-cost: major wildfire risk; extreme-heat days projected 7→18/yr by 2055 (HVAC capex compounding) — expect insurance premiums to compound above CPI over the hold.
Questions for the listing agent
- Built in 1971 — when were the roof, HVAC, electrical panel, plumbing, and water heater last replaced?
- Is there a deadline driving the sale (1031 exchange, divorce, estate, relocation)? That informs how much negotiation room exists.
- The area grade is low — what's the realistic commute time and amenity access for the typical tenant pool here? Any planned neighborhood developments (good or bad) we should know about?
- What's the average days-on-market for RENTAL listings here right now (not sales)? A rising rental-DOM trend means longer vacancies and softer asking-rent achievability than the comps imply.
- What's the recent tenant-quality profile in this submarket — average credit score on applications, eviction rate, late-payment / NSF rate, and stable-employment percentage? A property-management company in the area should have these aggregated.
- How much new for-sale + rental construction is in the pipeline within 1–3 miles? Heavy new supply typically softens prices + rents 12–24 months out; constrained supply supports both.
Investment metrics
- 1% rule
- 0.88% ✗
- Cap rate
- 6.32%
- Cash-on-cash
- 0.10%
- DSCR
- 1.00
- GRM
- 9.5
CMA / ARV
No comps found within radius.
Projected returns pro-forma
10.0% appreciation · 3.0% rent growth · sell at horizon
- IRR
- 24.4%
- Equity multiple
- 2.95×
- Total profit
- $136,290
- Equity at exit
- $224,769
- IRR
- 21.6%
- Equity multiple
- 6.74×
- Total profit
- $401,125
- Equity at exit
- $484,724
Cash invested: $69,860 (down + closing). Projections, not guarantees.
Landlord ↔ Tenant lean methodology
- Overall (STATE)
- 18 Strongly Tenant-Friendly
- State California
- 18 Strongly Tenant-Friendly · D+13
- County
- — inherits STATE
- City
- — inherits STATE
ZIP-level market 92372
- Home prices YoY
- 14.8%
- Active inventory
- 164
- Price-to-rent
- 9.5×
Monthly cashflow live
- Estimated rent
- $2,190 medium interval (Pro) →
- Mortgage (P&I)
- −$1,308
- Tax est. 1.5%
- −$312 /mo · $3,742/yr
- Insurance
- −$104
- HOA
- −$0
- Vacancy / Maint / Mgmt
- −$460
- Net cashflow
- $6
Break-even live
UW: 25.0% down · 7.5% · 30yr · 1.5% tax · 5.0% vac · 8.0% maint · 8.0% mgmt
Financing live
Cash to close
- Down payment
- $62,375
- Closing costs
- $7,485
- Reserves months
- —
- Total cash needed
- —
Loan-product check · same deal, 3 products live
Conventional
25% down · 7.5% · 30yr
- Down + closing
- —
- Monthly P&I
- —
- Monthly cashflow
- —
- DSCR
- —
- Eligible?
- —
Personal DTI + credit; lowest rate.
DSCR
20% down · 8.5% · 30yr
- Down + closing
- —
- Monthly P&I
- —
- Monthly cashflow
- —
- DSCR
- —
- Eligible?
- —
No personal income docs; deal must DSCR.
Hard money
10% down · 12.0% · 12mo
- Down + closing
- —
- Monthly P&I
- —
- Monthly cashflow
- —
- DSCR
- —
- Eligible?
- —
Short-term bridge; refi at stabilization.
Listing history 10 events
-
2026-06-18days on market $249,500 Active 15 DOM
-
2026-06-17days on market $249,500 Active 14 DOM
-
2026-06-16days on market $249,500 Active 13 DOM
-
2026-06-15days on market $249,500 Active 12 DOM
-
2026-06-13days on market $249,500 Active 10 DOM
-
2026-06-09days on market $249,500 Active 6 DOM
-
2026-06-08days on market $249,500 Active 5 DOM
-
2026-06-07days on market $249,500 Active 4 DOM
-
2026-06-04remarks 699-char remark
-
2026-06-04$249,500 Active 1 DOM
ⓘ Source: listings_history table (triggers on properties + properties_extension) + one-shot
backfill from property_details.listing_events for pre-trigger history.
Climate risk First Street
- Flood 4/10 Moderate FEMA zone D · 24% chance over 30 yrs
- Wildfire 7/10 Severe
- Heat 5/10 Major 7 d/yr ≥92°F today · 18 d/yr by 30 yrs out
- Wind 1/10 Low
- Air quality 10/10 Extreme 26 unhealthy d/yr today · 30 by 30 yrs out
Nearby sold comps map
Loading sold comps map…
Walkable amenities ~0.75 mi
Loading nearby amenities…
Taxation est. · year 1
- Rental income
- $26,280
- − Mortgage interest
- −$13,976
- − Property taxes
- −$3,742
- − Insurance
- −$1,248
- − Repairs & maintenance
- −$2,102
- − Management
- −$2,102
- − Depreciation
- −$7,258
- Taxable loss
- −$4,149
- Est. tax savings @ 24.0%
- +$996
- After-tax cash flow
- $1,066/yr
For passive investors: Depreciation is non-cash, so a rental often shows a tax loss while cash-flowing — sheltering income. Rental losses are passive: they offset passive income freely, and up to $25,000/yr can offset ordinary (W-2) income if you actively participate and your MAGI is under $100k (phasing out to $0 by $150k); unused losses carry forward. On sale, claimed depreciation is recaptured at up to 25%, and gains may owe capital-gains tax (a 1031 exchange can defer both). Figures are a year-1 estimate at your 24.0% rate — not tax advice; consult a CPA.
Schools (NCES district)
- District
- Snowline Joint Unified
- NCES district ID
- 0636970
- Math proficiency
- 34% ▲ 1.00%
- Reading proficiency
- 44% ▬ 0.00%
- Median HH income
- $57,625
- Composite
- 36.84/100
- National rank
- #9157
- State rank
- #722 of 1400 in CA
Livability — Piñon Hills
No livability data for this city. (Only ~50 U.S. cities are tracked.)
Census & demographics
- Census place
- Piñon Hills, CA
- City population
- 4,854
- Population (ZIP)
- 4,854
Population outlook (San Bernardino County) Hauer SSP2
- Today (2025)
- 2,300,329 people
- By 2030
- 2,378,907 · +3.4%
- By 2040
- 2,523,137 · +9.7%
- By 2050
- 2,642,388 · +14.9%
- By 2075
- 2,880,769 · +25.2%
- By 2100
- 2,909,436 · +26.5%
Race, ethnicity, and origin ACS 2023
- Neighborhood character
- Diverse neighborhood (Simpson 0.58)
- Race & ethnicity
- White 53% Hispanic / Latino 37% Two or more races 14% Asian 6%
- Hispanic origin (detail)
- Mexican 23% Puerto Rican 1%
- Common ancestry
- Italian 4% Iranian 3% Lithuanian 2%
- Foreign-born
- 15% · Canada, South Korea
- Languages at home
- 79% English-only · Spanish 15% Korean 4% Tagalog/Filipino 1%
Political lean MEDSL · San Bernardino
- 2024 margin
- Toss-up / Even · D 47.5% · R 49.7% · Other 2.8%
- 2008→2024 swing
- -8.5pp toward R · 2008: 6.3pp · 2024: -2.1pp
- All cycles
- 2024: R+2.1 2020: D+10.7 2016: D+9.8 2012: D+5.4 2008: D+6.3
Not yet ingested
- Civics
- —
Market trends
- HPI YoY
- ▲ 49.25%
- Current HPI
- 383.0737
- Rent YoY
- —
- Metro
- —
- State GDP YoY
- ▲ 3.21%
- F500 in state
- 116
Industry mix (Fortune 500 HQ in CA)
| Industry | F500 HQs | Revenue |
|---|---|---|
| Technology | 27 | $1,492B |
|
||
| Financial Services | 3 | $174B |
|
||
| Retail | 3 | $44B |
|
||
| Insurance | 3 | $26B |
|
||
| Media / Entertainment | 2 | $115B |
|
||
| Pharmaceuticals / Biotech | 2 | $62B |
|
||
Price history
+193.5% since first listed7 events — show timeline
- 2026-06-03 Listed $249,500 TheMLS
- 2025-11-14 Relisted — TheMLS
- 2025-10-20 Contingent — TheMLS
- 2025-09-12 Price Changed — TheMLS
- 2025-08-29 Listed — TheMLS
- 2014-10-06 Sold (MLS) $85,000 CRMLS
- 2014-09-02 Listed $85,000 CRMLS
Property tax history
+1.1%/yrLatest (2025): $230 · +10.5% YoY. Source: county tax records.
Cash-flow waterfall
monthlySold comps — $/sqft
last 12 mo · ≤1 miLoading sold comps…