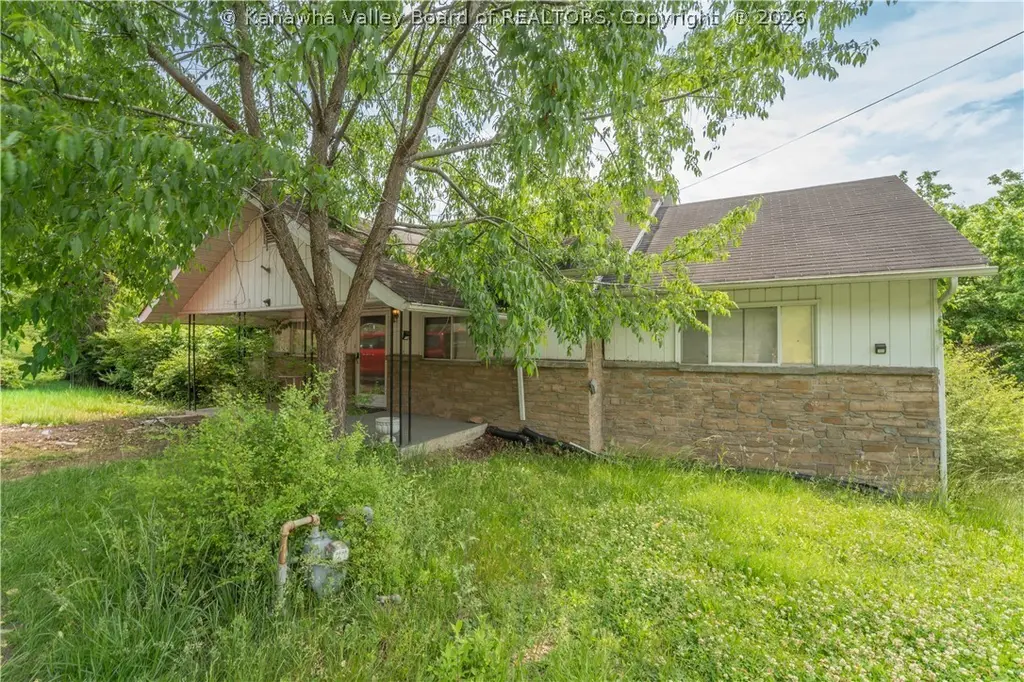
12158 Coal River Rd · St. Albans, WV
Flood risk 1/10 · Minimal
- FEMA flood zone
- X (unshaded)
- Chance of flooding over 30 yrs
- 0.0%
- Est. flood insurance / yr
- $473 – $860
Fire risk 2/10 · Minimal
- Est. fire insurance / yr
- $787 – $1,461
Heat risk 5/10 · Moderate
- Hot days now (above 101°F)
- 7 days/yr
- Hot days in 30 yrs
- 19 days/yr
Wind risk 2/10 · Minimal
- Chance of severe wind over 30 yrs
- 1.0%
Air-quality risk 1/10 · Minimal
- Unhealthy air days now
- 0 days/yr
- Unhealthy air days in 30 yrs
- 0 days/yr
Risk factors via First Street. Map © Google.
Why this score? — see what drove the B- grade
The composite is a weighted blend of 9 inputs, each scored 0–100. Each bar is that input's sub-score; the figure is the points it added to the 100-point composite (weight × sub-score).
- Cash flow +30.0/30.0
- 1% rule +10.0/10.0
- DSCR +10.0/10.0
- ARV discount +7.5/15.0
- Schools +2.9/10.0
- Rent growth +2.5/5.0
- Livability +2.5/5.0
- Condition / age +2.2/5.0
- Appreciation +0.0/10.0
$69,900
🖨 Deal sheet 📄 Offer letter ✓ Due diligence
Listing remarks
Endless potential awaits in this 3 bedroom, 1 bath home conveniently located just seconds from Downtown Saint Albans! Filled with natural light, this home offers a functional layout plus a full basement ready to be finished for additional living space or square footage. Enjoy the large, fully fenced backyard with plenty of room to relax, entertain, or garden. Offered at a great price, this home is the perfect opportunity to add your personal touch and make it your own. Must see to appreciate!
Key facts
- Full basement
- 0.24 acre lot
- Listed 16 days
Tags
Property features AI
Exterior
- Utilities: Public water; Public sewer
- Home design: Single-family residential property
- Construction: Brick and vinyl siding construction
- Exterior features: Fenced yard; Composition/shingle roof
Interior
- Flooring: Hardwood floors
- Bathrooms: 1 full bathroom
- Heating & cooling: Central air conditioning; Forced air heating
- Interior features: Insulated windows; Full basement
Neighborhood map
What this means for you Summary
Snapshot
- This is a 2-bed/1.0-bath single-family listed at $70k. Condition is rated fair.
Deal economics
- At list price, monthly cash flow is $359 ($4k/yr) — positive.
- The deal already cash-flows at list — no discount required.
- Meets the 1% rule at list price ($1k rent vs $70k).
- Recommended offer: $69k (1.5% below list) — sets the bar for market timing.
- Cap rate 12.5% vs local median 4.9% in St. Albans — top-decile yield for the area; either an underpriced asset or a hidden risk that comps aren't pricing in. Stress-test before assuming the spread holds.
Location & tenants
- Location reads: area grade B — affects rentability + tenant quality, not the cash-flow math above.
- Kanawha County Schools (suburban): math 29% / reading 40% proficiency, ranked #17 of 55 in WV (top 31%) — families likely to look elsewhere, expect single-tenant / working-renter base with shorter leases.
- Zoned schools: Alban Elementary School (math 32% / reading 37%, grade F, #148 of 377 statewide, top 49%, 253 students, 0% FRL); Hayes Middle School (math 24% / reading 39%, grade F, #52 of 109 statewide, top 49%, 436 students, 0% FRL); Saint Albans High School (math 32% / reading 57%, grade F, #11 of 110 statewide, top 11%, 993 students, 0% FRL) — zoned schools average 0% FRL vs 46% district-wide (46 pts lower); this property's tenant base skews higher-income than the district average.
- Market conditions: 116 active listings in the ZIP; 103 units permitted in Kanawha County in 2024 (0 in 5+ unit buildings).
Forward outlook
- Local home prices are declining (-3.0%/yr); year-one equity from $483 of loan paydown is wiped out by about $2k of value loss. Plan a longer hold.
- Kanawha County population projected at -17% by 2050 — secular population decline; favor cash flow + early exit over multi-decade hold.
- At projected returns (-3.0% appreciation + 3.0% rent growth), your $20k cash investment doubles in ~6 years — after that, you're playing with house money.
Negotiation context
- It's been on market 16 days — a 2% lower offer ($69k) is reasonable based on typical stale-listing flexibility.
Risks & watch-outs
- Climate carrying-cost: extreme-heat days projected 7→19/yr by 2055 (HVAC capex compounding) — expect insurance premiums to compound above CPI over the hold.
Questions for the listing agent
- Have any recent inspections been done? Can we get a copy of the seller's disclosures and any deferred-maintenance estimates?
- Is there a deadline driving the sale (1031 exchange, divorce, estate, relocation)? That informs how much negotiation room exists.
- What's the average days-on-market for RENTAL listings here right now (not sales)? A rising rental-DOM trend means longer vacancies and softer asking-rent achievability than the comps imply.
- What's the recent tenant-quality profile in this submarket — average credit score on applications, eviction rate, late-payment / NSF rate, and stable-employment percentage? A property-management company in the area should have these aggregated.
- How much new for-sale + rental construction is in the pipeline within 1–3 miles? Heavy new supply typically softens prices + rents 12–24 months out; constrained supply supports both.
Investment metrics
- 1% rule
- 1.52% ✓
- Cap rate
- 12.45%
- Cash-on-cash
- 22.00%
- DSCR
- 1.98
- GRM
- 5.5
CMA / ARV
- ARV (on-the-fly)
- $151,680
- Comps found
- 6
Show comp detail 6 sales within ~0.75 mi
| Address | Dist | Beds/Ba | Sqft | Sold | Price | $/sf | Match |
|---|---|---|---|---|---|---|---|
| 422 Lore St | 0.19mi | 3/1.0 (+1) | 1,144 (-10%) | 8mo | $97,500 | $85 | 63 |
| 406 Kanawha St | 0.44mi | 3/2.0 (+1) | 1,300 (+3%) | 12mo | $151,000 | $116 | 56 |
| 183 Riverview Dr | 0.72mi | 3/1.0 (+1) | 1,251 (-1%) | 10mo | $150,000 | $120 | 51 |
| 352 W Main St | 0.59mi | 3/2.5 (+1) | 1,306 (+3%) | 8mo | $179,000 | $137 | 49 |
| 110 Carte St | 0.41mi | 2/1.0 | 1,077 (-15%) | 21mo | $121,540 | $113 | 39 |
| 150 Riverview Dr | 0.69mi | 3/2.0 (+1) | 1,316 (+4%) | 23mo | $180,000 | $137 | 33 |
Match score weights: distance 35% · size 25% · config 20% · recency 20%. Top-matched comps best support the ARV.
Projected returns pro-forma
-3.0% appreciation · 3.0% rent growth · sell at horizon
- IRR
- 14.7%
- Equity multiple
- 1.59×
- Total profit
- $11,547
- Equity at exit
- $10,422
- IRR
- 23.5%
- Equity multiple
- 3.02×
- Total profit
- $39,554
- Equity at exit
- $6,044
Cash invested: $19,572 (down + closing). Projections, not guarantees.
Landlord ↔ Tenant lean methodology
- Overall (STATE)
- 83 Strongly Landlord-Friendly
- State West Virginia
- 83 Strongly Landlord-Friendly · R+22
- County
- — inherits STATE
- City
- — inherits STATE
ZIP-level market 25177
- Home prices YoY
- -16.6%
- Active inventory
- 116
- Price-to-rent
- 5.5×
Monthly cashflow live
- Estimated rent
- $1,066 medium interval (Pro) →
- Mortgage (P&I)
- −$367
- Tax est. 1.5%
- −$87 /mo · $1,048/yr
- Insurance
- −$29
- HOA
- −$0
- Vacancy / Maint / Mgmt
- −$224
- Net cashflow
- $359
Break-even live
UW: 25.0% down · 7.5% · 30yr · 1.5% tax · 5.0% vac · 8.0% maint · 8.0% mgmt
Financing live
Cash to close
- Down payment
- $17,475
- Closing costs
- $2,097
- Reserves months
- —
- Total cash needed
- —
Loan-product check · same deal, 3 products live
Conventional
25% down · 7.5% · 30yr
- Down + closing
- —
- Monthly P&I
- —
- Monthly cashflow
- —
- DSCR
- —
- Eligible?
- —
Personal DTI + credit; lowest rate.
DSCR
20% down · 8.5% · 30yr
- Down + closing
- —
- Monthly P&I
- —
- Monthly cashflow
- —
- DSCR
- —
- Eligible?
- —
No personal income docs; deal must DSCR.
Hard money
10% down · 12.0% · 12mo
- Down + closing
- —
- Monthly P&I
- —
- Monthly cashflow
- —
- DSCR
- —
- Eligible?
- —
Short-term bridge; refi at stabilization.
Listing history 8 events
-
2026-06-07statusdays on market $69,900 Pending 16 DOM
-
2026-06-05days on market $69,900 Active 15 DOM
-
2026-06-03days on market $69,900 Active 14 DOM
-
2026-06-02days on market $69,900 Active 13 DOM
-
2026-06-01days on market $69,900 Active 12 DOM
-
2026-05-31days on market $69,900 Active 11 DOM
-
2026-05-30days on market $69,900 Active 10 DOM
-
2026-05-20$69,900 Active
ⓘ Source: listings_history table (triggers on properties + properties_extension) + one-shot
backfill from property_details.listing_events for pre-trigger history.
Climate risk First Street
- Flood 1/10 Low FEMA zone X (unshaded) · 0% chance over 30 yrs
- Wildfire 2/10 Low
- Heat 5/10 Major 7 d/yr ≥101°F today · 19 d/yr by 30 yrs out
- Wind 2/10 Low 100% chance of damaging wind over 30 yrs
- Air quality 1/10 Low 0 unhealthy d/yr today · 0 by 30 yrs out
Nearby sold comps map
Loading sold comps map…
Walkable amenities ~0.75 mi
Loading nearby amenities…
Taxation est. · year 1
- Rental income
- $12,789
- − Mortgage interest
- −$3,915
- − Property taxes
- −$1,048
- − Insurance
- −$350
- − Repairs & maintenance
- −$1,023
- − Management
- −$1,023
- − Depreciation
- −$2,033
- Taxable income
- $3,396
- Est. tax owed @ 24.0%
- −$815
- After-tax cash flow
- $3,492/yr
For passive investors: Depreciation is non-cash, so a rental often shows a tax loss while cash-flowing — sheltering income. Rental losses are passive: they offset passive income freely, and up to $25,000/yr can offset ordinary (W-2) income if you actively participate and your MAGI is under $100k (phasing out to $0 by $150k); unused losses carry forward. On sale, claimed depreciation is recaptured at up to 25%, and gains may owe capital-gains tax (a 1031 exchange can defer both). Figures are a year-1 estimate at your 24.0% rate — not tax advice; consult a CPA.
Condition & rehab AI · 13 photos
This home requires moderate renovations to improve its condition and increase its value. Key areas for improvement include the kitchen and bathroom, as well as the exterior landscaping.
Repairs flagged
- Major Exposed ceiling in kitchen and bath — Structural damage
- Major Cluttered and outdated kitchen cabinets — Aesthetic and functional issues
- Major Cluttered and outdated bathroom fixtures — Aesthetic and functional issues
- Major Overgrown landscaping — Reduces curb appeal
Value-add opportunities
- Resale Paint interior walls — Enhances curb appeal and interior aesthetics
- Resale Replace flooring — Improves interior aesthetics and functionality
- Rental Clean and organize interior — Improves living conditions and tenant satisfaction
Renovation cost estimate screening
| Repair item | Severity | Est. cost |
|---|---|---|
| Exposed ceiling in kitchen and bath · Structural damage | Major | $15,000–50,000 |
| Cluttered and outdated kitchen cabinets · Aesthetic and functional issues | Major | $15,000–50,000 |
| Cluttered and outdated bathroom fixtures · Aesthetic and functional issues | Major | $15,000–50,000 |
| Overgrown landscaping · Reduces curb appeal | Major | $15,000–50,000 |
| Total estimated repair cost · 4 items | $60,000–200,000 |
Value-add ROI direction
- Resale Paint interior walls — Enhances curb appeal and interior aesthetics ↑
- Resale Replace flooring — Improves interior aesthetics and functionality ↑
- Rental Clean and organize interior — Improves living conditions and tenant satisfaction ↑
ⓘ Cost ranges are severity-bucket heuristics (US national rule-of-thumb). Get contractor quotes + a written scope before underwriting a rehab budget.
Schools (NCES district)
- District
- Kanawha County Schools
- NCES district ID
- 5400600
- Math proficiency
- 29% ▼ -13.00%
- Reading proficiency
- 40% ▼ -7.00%
- Median HH income
- $44,329
- Composite
- 29.35/100
- National rank
- #6540
- State rank
- #17 of 55 in WV
Livability — St. Albans
No livability data for this city. (Only ~50 U.S. cities are tracked.)
Census & demographics
- City population
- 23,211
- Population (ZIP)
- 23,211
Population outlook (Kanawha County) Hauer SSP2
- Today (2025)
- 178,946 people
- By 2030
- 172,906 · -3.4%
- By 2040
- 159,874 · -10.7%
- By 2050
- 148,148 · -17.2%
- By 2075
- 123,257 · -31.1%
- By 2100
- 96,454 · -46.1%
Race, ethnicity, and origin ACS 2023
- Neighborhood character
- Predominantly White (89%)
- Race & ethnicity
- White 89% Two or more races 5% Black 5% Hispanic / Latino 1%
- Common ancestry
- Serbian 2% Italian 2% Slovak 1%
- Foreign-born
- 0%
Political lean MEDSL · Kanawha
- 2024 margin
- R (+17.4) · D 40.2% · R 57.6% · Other 2.2%
- 2008→2024 swing
- -17.0pp toward R · 2008: -0.4pp · 2024: -17.4pp
- All cycles
- 2024: R+17.4 2020: R+14.7 2016: R+20.6 2012: R+11.9 2008: R+0.4
Not yet ingested
- Civics
- —
Market trends
- HPI YoY
- ▼ -36.96%
- Current HPI
- 185.502
- Rent YoY
- —
- Metro
- —
- State GDP YoY
- —
- F500 in state
- 0
Price history
1 event — show timeline
- 2026-05-20 Listed $69,900 KVBOR
Cash-flow waterfall
monthlySold comps — $/sqft
last 12 mo · ≤1 miLoading sold comps…