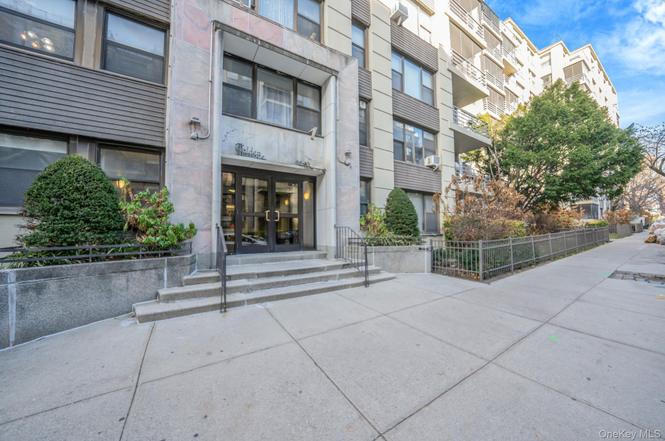
98-33 64th Ave Unit 1D · New York, NY
Flood risk 1/10 · Minimal
- FEMA flood zone
- X (unshaded)
- Chance of flooding over 30 yrs
- 0.0%
- Est. flood insurance / yr
- $507 – $1,088
Fire risk 1/10 · Minimal
- Est. fire insurance / yr
- $691 – $1,283
Heat risk 7/10 · Major
- Hot days now (above 99°F)
- 7 days/yr
- Hot days in 30 yrs
- 15 days/yr
Wind risk 6/10 · Moderate
- Chance of severe wind over 30 yrs
- 27.0%
Air-quality risk 5/10 · Moderate
- Unhealthy air days now
- 6 days/yr
- Unhealthy air days in 30 yrs
- 8 days/yr
Risk factors via First Street. Map © Google.
Why this score? — see what drove the F grade
The composite is a weighted blend of 9 inputs, each scored 0–100. Each bar is that input's sub-score; the figure is the points it added to the 100-point composite (weight × sub-score).
- ARV discount +7.5/15.0
- Schools +5.0/10.0
- Livability +3.8/5.0
- Cash flow +3.6/30.0
- 1% rule +3.5/10.0
- Rent growth +2.9/5.0
- Condition / age +2.5/5.0
- DSCR +0.0/10.0
- Appreciation +0.0/10.0
$299,990
🖨 Deal sheet 📄 Offer letter ✓ Due diligence
Listing remarks
Welcome to this charming 1-bedroom, 1-bath co-op featuring a spacious layout and smart design throughout. Enjoy a sunken living room that adds character and separation of space, along with a breakfast bar that opens to the updated kitchen; perfect for everyday living and entertaining. The oversized closet provide exceptional storage, making organization effortless. This pet-friendly and sublet-friendly building offers flexibility and convenience. Ideally located near the LIE, public transportation, buses, shopping, dining, and more. Everything you need is just moments away
Key facts
- Oversized closet
- Near shopping
- Sunken living room
Tags
Property features AI
Finance
- HOA & community: Association: Walden Terrace
Exterior
- Parking: On-street parking
- Utilities: Electricity connected (Con-Edison); Natural gas connected; Public sewer
- Home design: Stock cooperative; Entry level: 1
- Construction: Stone exterior
- Exterior features: Stone construction; Not waterfront
Interior
- Kitchen: Dishwasher; Gas range; Microwave; Refrigerator
- Bedrooms: Includes a bedroom on the first floor
- Flooring: Hardwood floors
- Bathrooms: 1 full bathroom
- Heating & cooling: Natural gas heating; No central cooling
- Interior features: First-floor bedroom; Breakfast bar; Built-in features; Ceiling fans; Elevator access
- Laundry & utility: Dedicated laundry room
Neighborhood map
What this means for you Summary
Snapshot
- This is a 1-bed/1.0-bath condo listed at $300k.
Deal economics
- At list price, monthly cash flow is $-898 ($-11k/yr) — negative.
- To cash-flow at today's rent, offer at most $290k (3.2% below list).
- To meet the 1% rule (rent ≥ 1% of price), the offer needs to be $254k (15.3% below list).
- Recommended offer: $254k (15.3% below list) — sets the bar for 1% rule.
Location & tenants
- Location reads 75/100 on livability (#268 in NY, #4,188 nationally) — a middle-class / working-renter tenant base. Strengths: amenities A+, commute A+, health & safety A; Watch: crime F, cost of living F.
- Market conditions: Rents rising (+1.7%/yr); 345 active listings in the ZIP; 32 comparable units currently listed for rent nearby; rentals at typical pace (median 19d on market — plan ~3-4 weeks tenant-placement turnaround); solid renter incomes; 5,302 units permitted in Queens County in 2024 (4,918 in 5+ unit buildings).
- This rent runs 34% of the median local income ($91k/yr) — at the standard rent-burdened threshold; future hikes will face affordability resistance.
Forward outlook
- Local home prices are declining (-3.0%/yr); year-one equity from $2k of loan paydown is wiped out by about $9k of value loss. Plan a longer hold.
- Queens County population projected at +16% by 2050 — long-run rental-demand tailwind backs the buy-and-hold thesis.
Negotiation context
- It's been on market 112 days — a 9% lower offer ($273k) is reasonable based on typical stale-listing flexibility.
- 10 sale attempts since 13y ago with the ask held roughly flat each time — persistent listings suggest the price (not the market) is what's stuck; bring a comps-based counter.
Risks & watch-outs
- Watch-outs: HOA is 33% of rent; built in 1949 — expect roof / HVAC / electrical / plumbing capex.
- Climate carrying-cost: major wind risk, 27% chance of damaging wind over 30y; extreme-heat days projected 7→15/yr by 2055 (HVAC capex compounding) — expect insurance premiums to compound above CPI over the hold.
Questions for the listing agent
- What do current leases actually rent for vs. the listed asking? Can we see a recent rent roll and the last 12 months of T-12 income?
- It's been on market 112 days. Have you received any prior offers? Is the seller open to a 15% concession, seller financing, or rate buy-down credit?
- Built in 1949 — when were the roof, HVAC, electrical panel, plumbing, and water heater last replaced?
- What does the HOA fee cover, when was the last increase, and are there any pending special assessments or reserve-fund shortfalls?
- Any open or pending special assessments — roof, HVAC, plumbing, elevator, façade? What's the per-unit balance and payoff schedule, and is the seller paying it off at close or rolling it to the buyer?
- Why hasn't it sold? Are there any deal-killer items the seller is aware of (foundation, flood, title, zoning, code violations)?
- Is there a deadline driving the sale (1031 exchange, divorce, estate, relocation)? That informs how much negotiation room exists.
- Schools are B-rated — typically a magnet for longer-tenancy family renters. What's the average tenant stay here, and is there a school-zone premium baked into asking?
- Crime grade is F in this area — have there been break-ins, vandalism, or insurance claims at this property in the last 3 years? What carrier currently insures it and at what premium?
- The area grade is low — what's the realistic commute time and amenity access for the typical tenant pool here? Any planned neighborhood developments (good or bad) we should know about?
- What's the average days-on-market for RENTAL listings here right now (not sales)? A rising rental-DOM trend means longer vacancies and softer asking-rent achievability than the comps imply.
- What's the recent tenant-quality profile in this submarket — average credit score on applications, eviction rate, late-payment / NSF rate, and stable-employment percentage? A property-management company in the area should have these aggregated.
- How much new apartment / multifamily construction is in the pipeline within 1–3 miles? Heavy new supply (>2% of stock underway) typically softens rents 12–24 months out; light construction supports rent growth.
Investment metrics
- 1% rule
- 0.85% ✗
- Cap rate
- 2.70%
- Cash-on-cash
- -12.83%
- DSCR
- 0.43
- GRM
- 9.8
CMA / ARV
No comps found within radius.
Projected returns pro-forma
-3.0% appreciation · 1.74% rent growth · sell at horizon
- IRR
- -42.1%
- Equity multiple
- -0.29×
- Total profit
- $-108,425
- Equity at exit
- $44,729
- IRR
- -84.5%
- Equity multiple
- -1.13×
- Total profit
- $-178,541
- Equity at exit
- $25,938
Cash invested: $83,997 (down + closing). Projections, not guarantees.
Landlord ↔ Tenant lean methodology
- Overall (CITY)
- 0 Strongly Tenant-Friendly
- State New York
- 15 Strongly Tenant-Friendly · D+10
- County
- — inherits STATE
- City New York
- 0 Strongly Tenant-Friendly · D+34
ZIP-level market 11374
- Rents YoY
- 1.7%
- Active inventory
- 345
- Price-to-rent
- 9.8×
Monthly cashflow live
- Estimated rent
- $2,541 high interval (Pro) →
- Mortgage (P&I)
- −$1,573
- Tax est. 1.5%
- −$375 /mo · $4,500/yr
- Insurance
- −$125
- HOA est. from 1 same-building comp
- −$832
- Vacancy / Maint / Mgmt
- −$534
- Net cashflow
- $-898
Break-even live
UW: 25.0% down · 7.5% · 30yr · 1.5% tax · 5.0% vac · 8.0% maint · 8.0% mgmt
Financing live
Cash to close
- Down payment
- $74,998
- Closing costs
- $9,000
- Reserves months
- —
- Total cash needed
- —
Loan-product check · same deal, 3 products live
Conventional
25% down · 7.5% · 30yr
- Down + closing
- —
- Monthly P&I
- —
- Monthly cashflow
- —
- DSCR
- —
- Eligible?
- —
Personal DTI + credit; lowest rate.
DSCR
20% down · 8.5% · 30yr
- Down + closing
- —
- Monthly P&I
- —
- Monthly cashflow
- —
- DSCR
- —
- Eligible?
- —
No personal income docs; deal must DSCR.
Hard money
10% down · 12.0% · 12mo
- Down + closing
- —
- Monthly P&I
- —
- Monthly cashflow
- —
- DSCR
- —
- Eligible?
- —
Short-term bridge; refi at stabilization.
Rent comps 32 comps
| Address | Beds | Baths | Sqft | Rent | $/sqft | DOM | Units | Dist |
|---|---|---|---|---|---|---|---|---|
| 9707 63rd Rd Unit 15B Rego Park, NY | 1.0 | 1.0 | 700 | $2,300 | $3.29 | 2d | 1 | 0.19mi |
| 97-12 65th Rd Unit 4-C Rego Park, NY | 1.0 | 1.0 | 650 | $3,350 | $5.15 | 5d | 1 | 0.21mi |
| 6145 98th St Rego Park, NY | 1.0–3.0 | 1.0 | 825 | $2,350 | $2.85 | 3d | 3 | 0.21mi |
| 6145 98th St Rego Park, NY | 1.0–3.0 | 1.0 | 825 | $2,500 | $3.03 | 25d | 3 | 0.21mi |
| 98-81 Queens Blvd Unit 15E Rego Park, NY | 1.0 | 1.0 | 700 | $3,335 | $4.76 | 5d | 1 | 0.23mi |
| 9710 62nd Dr Unit 9F Rego Park, NY | 1.0 | 1.0 | 750 | $2,700 | $3.60 | 4d | 1 | 0.23mi |
| 6155 98th St Unit 8B Rego Park, NY | 1.0 | 1.0 | 700 | $2,500 | $3.57 | 5d | 1 | 0.30mi |
| 6405 Yellowstone Blvd Unit 403S Forest Hills, NY | 1.0 | 1.0 | 720 | $3,100 | $4.31 | 25d | 1 | 0.31mi |
| 6125 97th St Unit 4D Rego Park, NY | — | 1.0 | 650 | $2,300 | $3.54 | 5d | 1 | 0.34mi |
| 6435 Yellowstone Blvd Unit 6G Forest Hills, NY | — | 1.0 | 575 | $1,900 | $3.30 | 19d | 1 | 0.35mi |
| 66-55 Booth St Unit 6 Rego Park, NY | — | 1.0 | 500 | $2,295 | $4.59 | 25d | 1 | 0.37mi |
| 6347 Booth St Unit 3C Rego Park, NY | 1.0 | 1.0 | 700 | $3,400 | $4.86 | 25d | 1 | 0.38mi |
| 6620 Wetherole St Rego Park, NY | 1.0–2.0 | 1.0–2.0 | 700 | $2,400 | $3.43 | 25d | 2 | 0.40mi |
| 102-45 67th Rd Forest Hills, NY | 1.0 | 1.0 | 700 | $2,350 | $3.36 | 19d | 1 | 0.42mi |
| 102-55 67th Rd Unit 2V Forest Hills, NY | 1.0 | 1.0 | 633 | $2,350 | $3.71 | 19d | 1 | 0.44mi |
| 6259 108th St Unit 3S Forest Hills, NY | — | 1.0 | 500 | $1,900 | $3.80 | 5d | 1 | 0.46mi |
| 105-25 67th Rd Forest Hills, NY | 1.0 | 1.0 | 750 | $1,800 | $2.40 | 19d | 1 | 0.49mi |
| 67-13 Austin St Unit 2A Flushing, NY | 1.0 | 1.0 | 600 | $2,595 | $4.33 | 17d | 1 | 0.49mi |
| 102-30 Queens Blvd Unit 1A Forest Hills, NY | — | 1.0 | 350 | $2,395 | $6.84 | 25d | 1 | 0.51mi |
| 10849 63rd Ave Unit 2C Forest Hills, NY | — | 1.0 | 600 | $1,900 | $3.17 | 25d | 1 | 0.52mi |
| 6615 Thornton Pl Rego Park, NY | 1.0 | 1.0 | 700 | $2,672 | $3.82 | 5d | 3 | 0.54mi |
| 6771 Yellowstone Blvd Unit 2R Forest Hills, NY | 1.0 | 1.0 | 700 | $2,550 | $3.64 | 25d | 1 | 0.54mi |
| 9430 58th Ave Unit 3A Elmhurst, NY | — | 1.0 | 530 | $1,800 | $3.40 | 11d | 1 | 0.56mi |
| 11131 66th Ave Unit 3C Forest Hills, NY | 1.0 | 1.0 | 600 | $2,000 | $3.33 | 5d | 1 | 0.67mi |
| 6750 Thornton Pl Unit 2U Forest Hills, NY | — | 1.0 | 550 | $1,900 | $3.45 | 8d | 1 | 0.74mi |
| 86-16 60th Ave Unit 1K Queens, NY | 1.0 | 1.0 | 750 | $2,300 | $3.07 | 25d | 1 | 0.85mi |
| 10740 70th Rd Unit 7F Forest Hills, NY | 1.0 | 1.0 | 750 | $2,650 | $3.53 | 25d | 1 | 0.89mi |
| 10825 72nd Ave Forest Hills, NY | 1.0–2.0 | 1.0 | 700 | $3,500 | $5.00 | 5d | 2 | 1.07mi |
| 10919 72nd Rd Unit 6F Forest Hills, NY | 1.0 | 1.0 | 696 | $3,485 | $5.01 | 11d | 1 | 1.13mi |
| 11019 72nd Rd Unit 1B Forest Hills, NY | 1.0 | 1.0 | 750 | $3,200 | $4.27 | 14d | 1 | 1.14mi |
| 110-19 72nd Rd Unit 1A Forest Hills, NY | — | 1.0 | 500 | $2,395 | $4.79 | 25d | 1 | 1.14mi |
| 6820 Selfridge St Unit 3L Forest Hills, NY | — | 1.0 | 500 | $1,900 | $3.80 | 25d | 1 | 1.22mi |
HOA detail condo
- Monthly dues
- $0 · $0/yr
- Assessments
- None detected in remarks — confirm with the listing agent.
Listing history 35 events
-
2026-06-18days on market $299,990 Active 112 DOM
-
2026-06-17days on market $299,990 Active 111 DOM
-
2026-06-15days on market $299,990 Active 109 DOM
-
2026-06-13days on market $299,990 Active 107 DOM
-
2026-06-10days on market $299,990 Active 103 DOM
-
2026-06-08days on market $299,990 Active 102 DOM
-
2026-06-08days on market $299,990 Active 101 DOM
-
2026-06-04days on market $299,990 Active 98 DOM
-
2026-06-03days on market $299,990 Active 97 DOM
-
2026-06-01days on market $299,990 Active 95 DOM
-
2026-05-31days on market $299,990 Active 94 DOM
-
2026-03-10price $299,990
-
2026-02-24historical
-
2026-02-24$309,990 Active
-
2026-01-26price $309,990
-
2025-12-12$329,990 Active
-
2025-11-29historical
-
2025-11-07$355,000 Active
-
2016-09-20soldstatus $262,000
-
2016-09-20soldstatus $262,000 Closed
-
2016-07-17status Under Contract
-
2016-06-25price $274,999
-
2016-05-16$279,999 New
-
2016-05-16$274,999
-
2015-06-10soldstatus $178,000 Closed
-
2015-06-10soldstatus $1,650
-
2015-03-27status Under Contract
-
2015-01-07$184,999 New
-
2015-01-07$184,999
-
2014-08-26historical
-
2014-05-26$189,000
-
2014-05-01historical
-
2014-01-11$209,000
-
2013-12-31historical
-
2013-09-22$199,900
ⓘ Source: listings_history table (triggers on properties + properties_extension) + one-shot
backfill from property_details.listing_events for pre-trigger history.
Climate risk First Street
- Flood 1/10 Low FEMA zone X (unshaded) · 0% chance over 30 yrs
- Wildfire 1/10 Low
- Heat 7/10 Severe 7 d/yr ≥99°F today · 15 d/yr by 30 yrs out
- Wind 6/10 Major 27% chance of damaging wind over 30 yrs
- Air quality 5/10 Major 6 unhealthy d/yr today · 8 by 30 yrs out
Nearby sold comps map
Loading sold comps map…
Walkable amenities ~0.75 mi
Loading nearby amenities…
Taxation est. · year 1
- Rental income
- $30,491
- − Mortgage interest
- −$16,804
- − Property taxes
- −$4,500
- − Insurance
- −$1,500
- − Repairs & maintenance
- −$2,439
- − Management
- −$2,439
- − HOA
- −$9,984
- − Depreciation
- −$8,727
- Taxable loss
- −$15,902
- Est. tax savings @ 24.0%
- +$3,817
- After-tax cash flow
- $-6,957/yr
For passive investors: Depreciation is non-cash, so a rental often shows a tax loss while cash-flowing — sheltering income. Rental losses are passive: they offset passive income freely, and up to $25,000/yr can offset ordinary (W-2) income if you actively participate and your MAGI is under $100k (phasing out to $0 by $150k); unused losses carry forward. On sale, claimed depreciation is recaptured at up to 25%, and gains may owe capital-gains tax (a 1031 exchange can defer both). Figures are a year-1 estimate at your 24.0% rate — not tax advice; consult a CPA.
Schools (NCES district)
No district data.
Livability — New York
- Score
- 75/100
- State rank
- #268
- US rank
- #4188
Category grades
Schools grade is shown separately in the Schools card above.
Census & demographics
- Census place
- New York, NY
- County
- Queens County · 1,914,869 people
- City population
- 7,731,280
- Metro
- New York-Newark-Jersey City, NY-NJ-PA
- Population (ZIP)
- 46,989
- Household income
- $90,631
- Rent vs Own
- Severe rent burden
- 3149.0
Population outlook (Queens County) Hauer SSP2
- Today (2025)
- 2,546,320 people
- By 2030
- 2,643,059 · +3.8%
- By 2040
- 2,815,563 · +10.6%
- By 2050
- 2,944,423 · +15.6%
- By 2075
- 3,123,338 · +22.7%
- By 2100
- 3,098,688 · +21.7%
Race, ethnicity, and origin ACS 2023
- Neighborhood character
- Highly diverse neighborhood (Simpson 0.72)
- Race & ethnicity
- White 38% Asian 29% Hispanic / Latino 22% Two or more races 13% Black 4%
- Hispanic origin (detail)
- Mexican 1% Puerto Rican 3% Dominican 3%
- Common ancestry
- Scotch-Irish 6% Romanian 2% Subsaharan African 1%
- Foreign-born
- 54% · Canada, China, Jamaica
- Languages at home
- 28% English-only · Spanish 18% Russian/Polish/Slavic 15% Chinese 13%
Political lean MEDSL · Queens
- 2024 margin
- Strong D (+24.6) · D 62.3% · R 37.7%
- 2008→2024 swing
- -26.2pp toward R · 2008: 50.8pp · 2024: 24.6pp
- All cycles
- 2024: D+24.6 2020: D+45.2 2016: D+53.4 2012: D+58.5 2008: D+50.8
Not yet ingested
- Civics
- —
Market trends
- HPI YoY
- ▼ -163.20%
- Current HPI
- 207.1869
- Rent YoY
- ▲ 1.74%
- Metro
- New York-Newark-Jersey City, NY-NJ-PA
- State GDP YoY
- ▲ 2.60%
- F500 in state
- 92
Industry mix (Fortune 500 HQ in NY)
| Industry | F500 HQs | Revenue |
|---|---|---|
| Financial Services | 10 | $950B |
|
||
| Consumer Goods | 9 | $162B |
|
||
| Insurance | 4 | $225B |
|
||
| Telecommunications | 2 | $144B |
|
||
| Pharmaceuticals | 2 | $112B |
|
||
| Media / Entertainment | 2 | $69B |
|
||
Price history
+50.1% since first listed24 events — show timeline
- 2026-03-10 Price Changed $299,990 OneKey® MLS as Distributed by MLS Grid
- 2026-02-24 Listed $309,990 OneKey® MLS as Distributed by MLS Grid
- 2026-02-24 Listing Removed — OneKey® MLS as Distributed by MLS Grid
- 2026-01-26 Price Changed $309,990 OneKey® MLS as Distributed by MLS Grid
- 2025-12-12 Listed $329,990 OneKey® MLS as Distributed by MLS Grid
- 2025-11-29 Listing Removed — OneKey® MLS as Distributed by MLS Grid
- 2025-11-07 Listed $355,000 OneKey® MLS as Distributed by MLS Grid
- 2016-09-20 Sold (MLS) $262,000 OneKey® MLS as Distributed by MLS Grid
- 2016-09-20 Sold (MLS) $262,000 MLSLI
- 2016-07-17 Pending — MLSLI
- 2016-06-25 Price Changed $274,999 MLSLI
- 2016-05-16 Listed $279,999 MLSLI
- 2016-05-16 Listed $274,999 OneKey® MLS as Distributed by MLS Grid
- 2015-06-10 Sold (MLS) $1,650 OneKey® MLS as Distributed by MLS Grid
- 2015-06-10 Sold (MLS) $178,000 MLSLI
- 2015-03-27 Pending — MLSLI
- 2015-01-07 Listed $184,999 MLSLI
- 2015-01-07 Listed $184,999 OneKey® MLS as Distributed by MLS Grid
- 2014-08-26 Listing Removed — OneKey® MLS as Distributed by MLS Grid
- 2014-05-26 Listed $189,000 OneKey® MLS as Distributed by MLS Grid
- 2014-05-01 Listing Removed — OneKey® MLS as Distributed by MLS Grid
- 2014-01-11 Listed $209,000 OneKey® MLS as Distributed by MLS Grid
- 2013-12-31 Listing Removed — OneKey® MLS as Distributed by MLS Grid
- 2013-09-22 Listed $199,900 OneKey® MLS as Distributed by MLS Grid
Cash-flow waterfall
monthlySold comps — $/sqft
last 12 mo · ≤1 miLoading sold comps…