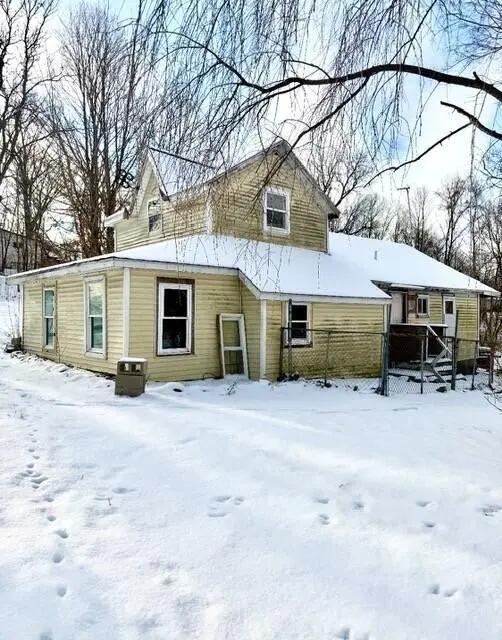
216 Crane St · Union, MI
Flood risk 8/10 · Major
- FEMA flood zone
- X (unshaded)
- Chance of flooding over 30 yrs
- 0.99%
- Est. flood insurance / yr
- $473 – $860
Fire risk 1/10 · Minimal
- Est. fire insurance / yr
- $784 – $1,456
Heat risk 2/10 · Minimal
- Hot days now (above 98°F)
- 7 days/yr
- Hot days in 30 yrs
- 16 days/yr
Wind risk 2/10 · Minimal
- Chance of severe wind over 30 yrs
- —
Air-quality risk 2/10 · Minimal
- Unhealthy air days now
- 1 days/yr
- Unhealthy air days in 30 yrs
- 2 days/yr
Risk factors via First Street. Map © Google.
Why this score? — see what drove the B+ grade
The composite is a weighted blend of 9 inputs, each scored 0–100. Each bar is that input's sub-score; the figure is the points it added to the 100-point composite (weight × sub-score).
- Cash flow +30.0/30.0
- ARV discount +15.0/15.0
- 1% rule +10.0/10.0
- DSCR +10.0/10.0
- Schools +2.6/10.0
- Rent growth +2.5/5.0
- Livability +2.5/5.0
- Condition / age +2.5/5.0
- Appreciation +0.0/10.0
$115,000
🖨 Deal sheet 📄 Offer letter ✓ Due diligence
Listing remarks MLS
Investor special with potential! This 3-bedroom, 1-full-bath home at 216 Crane St. offers a great opportunity for the right buyer ready to bring it back to life. The property is in need of significant updates and repairs and is being sold AS IS, with no repairs to be made by the seller. Ideal for investors, flippers, or buyers with renovation experience looking to add value and build equity. With the right vision and work, this home has the potential to be transformed into something special. A great opportunity for those seeking a project with upside.
Key facts
- 0.31 acre lot
- Built 1900
- Listed 149 days
Neighborhood map
What this means for you Summary
Snapshot
- This is a 3-bed/2.0-bath single-family listed at $115k.
Deal economics
- At list price, monthly cash flow is $723 ($9k/yr) — positive.
- The deal already cash-flows at list — no discount required.
- Meets the 1% rule at list price ($2k rent vs $115k).
- Recommended offer: $101k (12.0% below list) — sets the bar for market timing.
Location & tenants
- Location reads: area grade B — affects rentability + tenant quality, not the cash-flow math above.
- Union City Community Schools (rural): math 22% / reading 39% proficiency, ranked #354 of 540 in MI (top 66%) — families likely to look elsewhere, expect single-tenant / working-renter base with shorter leases.
- Market conditions: 33 active listings in the ZIP; 43 units permitted in Branch County in 2024 (0 in 5+ unit buildings).
Forward outlook
- Local home prices are declining (-3.0%/yr); year-one equity from $795 of loan paydown is wiped out by about $3k of value loss. Plan a longer hold.
- Branch County population projected at -18% by 2050 — secular population decline; favor cash flow + early exit over multi-decade hold.
- At projected returns (-3.0% appreciation + 3.0% rent growth), your $32k cash investment doubles in ~5 years — after that, you're playing with house money.
Negotiation context
- It's been on market 150 days — a 12% lower offer ($101k) is reasonable based on typical stale-listing flexibility.
- 3 sale attempts; this cycle's ask has dropped $25k (18%) from the opening price — seller is motivated, your offer sets the floor, not the list.
Risks & watch-outs
- Watch-outs: flood insurance adds $56/mo; built in 1900 — expect roof / HVAC / electrical / plumbing capex.
- Climate carrying-cost: severe flood risk — expect insurance premiums to compound above CPI over the hold.
Questions for the listing agent
- It's been on market 150 days. Have you received any prior offers? Is the seller open to a 12% concession, seller financing, or rate buy-down credit?
- Built in 1900 — when were the roof, HVAC, electrical panel, plumbing, and water heater last replaced?
- What's the actual annual flood-insurance premium (NFIP or private), and is the property in a SFHA with mandatory coverage?
- Why hasn't it sold? Are there any deal-killer items the seller is aware of (foundation, flood, title, zoning, code violations)?
- Is there a deadline driving the sale (1031 exchange, divorce, estate, relocation)? That informs how much negotiation room exists.
- What's the average days-on-market for RENTAL listings here right now (not sales)? A rising rental-DOM trend means longer vacancies and softer asking-rent achievability than the comps imply.
- What's the recent tenant-quality profile in this submarket — average credit score on applications, eviction rate, late-payment / NSF rate, and stable-employment percentage? A property-management company in the area should have these aggregated.
- How much new for-sale + rental construction is in the pipeline within 1–3 miles? Heavy new supply typically softens prices + rents 12–24 months out; constrained supply supports both.
Investment metrics
- 1% rule
- 1.63% ✓
- Cap rate
- 14.42%
- Cash-on-cash
- 29.01%
- DSCR
- 2.29
- GRM
- 5.1
CMA / ARV
- ARV (median comp)
- $151,035
- List price
- $115,000
- Delta
- -23.86%
- Verdict
- UNDERPRICED
- Comps
- 20 within 1.0 mi
Show comp detail 12 sales within ~0.75 mi
| Address | Dist | Beds/Ba | Sqft | Sold | Price | $/sf | Match |
|---|---|---|---|---|---|---|---|
| 321 E Fenton St | 0.05mi | 4/1.0 (+1) | 1,420 (-4%) | 1mo | $180,000 | $127 | 82 |
| 403 S Broadway St | 0.13mi | 4/1.5 (+1) | 1,600 (+9%) | 9mo | $165,804 | $104 | 65 |
| 434 Ann St | 0.43mi | 3/2.0 | 1,356 (-8%) | 2mo | $175,000 | $129 | 65 |
| 122 Hammond St | 0.27mi | 3/1.0 | 1,607 (+9%) | 7mo | $154,000 | $96 | 62 |
| 126 Barry St | 0.60mi | 3/1.0 | 1,490 (+1%) | 7mo | $215,500 | $145 | 60 |
| 322 St Joseph St | 0.34mi | 3/1.0 | 1,350 (-8%) | 7mo | $145,000 | $107 | 60 |
| 520 S Broadway St | 0.38mi | 3/1.0 | 1,300 (-12%) | 2mo | $125,001 | $96 | 58 |
| 113 S Park St | 0.35mi | 3/1.0 | 1,650 (+12%) | 8mo | $155,000 | $94 | 53 |
| 7 Palmer Dr | 0.31mi | 3/2.0 | 1,625 (+10%) | 24mo | $200,000 | $123 | 48 |
| 402 Division St | 0.68mi | 2/1.0 (-1) | 1,356 (-8%) | 10mo | $164,000 | $121 | 38 |
| 203 Barry St | 0.60mi | 3/1.0 | 1,350 (-8%) | 21mo | $140,000 | $104 | 37 |
| 609 Thomas St | 0.70mi | 4/1.0 (+1) | 1,300 (-12%) | 24mo | $183,000 | $141 | 19 |
Match score weights: distance 35% · size 25% · config 20% · recency 20%. Top-matched comps best support the ARV.
Projected returns pro-forma
-3.0% appreciation · 3.0% rent growth · sell at horizon
- IRR
- 20.9%
- Equity multiple
- 1.85×
- Total profit
- $27,411
- Equity at exit
- $17,147
- IRR
- 29.0%
- Equity multiple
- 3.58×
- Total profit
- $83,182
- Equity at exit
- $9,943
Cash invested: $32,200 (down + closing). Projections, not guarantees.
Landlord ↔ Tenant lean methodology
- Overall (STATE)
- 62 Landlord-Friendly
- State Michigan
- 62 Landlord-Friendly · EVEN
- County
- — inherits STATE
- City
- — inherits STATE
ZIP-level market 49094
- Home prices YoY
- -28.8%
- Active inventory
- 33
- Price-to-rent
- 5.1×
Monthly cashflow live
- Estimated rent
- $1,878 medium interval (Pro) →
- Mortgage (P&I)
- −$603
- Tax from tax record
- −$55 /mo · $655/yr
- Insurance
- −$48
- Flood insurance flood zone
- −$56 /mo · $666/yr
- HOA
- −$0
- Vacancy / Maint / Mgmt
- −$394
- Net cashflow
- $723
Break-even live
UW: 25.0% down · 7.5% · 30yr · 1.5% tax · 5.0% vac · 8.0% maint · 8.0% mgmt
Financing live
Cash to close
- Down payment
- $28,750
- Closing costs
- $3,450
- Reserves months
- —
- Total cash needed
- —
Loan-product check · same deal, 3 products live
Conventional
25% down · 7.5% · 30yr
- Down + closing
- —
- Monthly P&I
- —
- Monthly cashflow
- —
- DSCR
- —
- Eligible?
- —
Personal DTI + credit; lowest rate.
DSCR
20% down · 8.5% · 30yr
- Down + closing
- —
- Monthly P&I
- —
- Monthly cashflow
- —
- DSCR
- —
- Eligible?
- —
No personal income docs; deal must DSCR.
Hard money
10% down · 12.0% · 12mo
- Down + closing
- —
- Monthly P&I
- —
- Monthly cashflow
- —
- DSCR
- —
- Eligible?
- —
Short-term bridge; refi at stabilization.
Listing history 21 events
-
2026-06-18days on market $115,000 Active 150 DOM
-
2026-06-17days on market $115,000 Active 149 DOM
-
2026-06-16days on market $115,000 Active 148 DOM
-
2026-06-15days on market $115,000 Active 147 DOM
-
2026-06-13days on market $115,000 Active 145 DOM
-
2026-06-12days on market $115,000 Active 144 DOM
-
2026-06-09days on market $115,000 Active 141 DOM
-
2026-06-08days on market $115,000 Active 140 DOM
-
2026-06-07days on market $115,000 Active 139 DOM
-
2026-06-07days on market $115,000 Active 138 DOM
-
2026-06-04days on market $115,000 Active 135 DOM
-
2026-06-02days on market $115,000 Active 134 DOM
-
2026-06-01days on market $115,000 Active 133 DOM
-
2026-05-31days on market $115,000 Active 132 DOM
-
2026-05-31days on market $115,000 Active 131 DOM
-
2026-02-17price $115,000 557-char remark
Show marketing remark (557 chars)
Investor special with potential! This 3-bedroom, 1-full-bath home at 216 Crane St. offers a great opportunity for the right buyer ready to bring it back to life. The property is in need of significant updates and repairs and is being sold AS IS, with no repairs to be made by the seller. Ideal for investors, flippers, or buyers with renovation experience looking to add value and build equity. With the right vision and work, this home has the potential to be transformed into something special. A great opportunity for those seeking a project with upside.
-
2026-02-16price $115,000 557-char remark
Show marketing remark (557 chars)
Investor special with potential! This 3-bedroom, 1-full-bath home at 216 Crane St. offers a great opportunity for the right buyer ready to bring it back to life. The property is in need of significant updates and repairs and is being sold AS IS, with no repairs to be made by the seller. Ideal for investors, flippers, or buyers with renovation experience looking to add value and build equity. With the right vision and work, this home has the potential to be transformed into something special. A great opportunity for those seeking a project with upside.
-
2026-02-16price $115,000
Show marketing remark (557 chars)
Investor special with potential! This 3-bedroom, 1-full-bath home at 216 Crane St. offers a great opportunity for the right buyer ready to bring it back to life. The property is in need of significant updates and repairs and is being sold AS IS, with no repairs to be made by the seller. Ideal for investors, flippers, or buyers with renovation experience looking to add value and build equity. With the right vision and work, this home has the potential to be transformed into something special. A great opportunity for those seeking a project with upside.
-
2026-01-19$140,000 Active 557-char remark
Show marketing remark (557 chars)
Investor special with potential! This 3-bedroom, 1-full-bath home at 216 Crane St. offers a great opportunity for the right buyer ready to bring it back to life. The property is in need of significant updates and repairs and is being sold AS IS, with no repairs to be made by the seller. Ideal for investors, flippers, or buyers with renovation experience looking to add value and build equity. With the right vision and work, this home has the potential to be transformed into something special. A great opportunity for those seeking a project with upside.
-
2026-01-18$140,000 Active 557-char remark
Show marketing remark (557 chars)
Investor special with potential! This 3-bedroom, 1-full-bath home at 216 Crane St. offers a great opportunity for the right buyer ready to bring it back to life. The property is in need of significant updates and repairs and is being sold AS IS, with no repairs to be made by the seller. Ideal for investors, flippers, or buyers with renovation experience looking to add value and build equity. With the right vision and work, this home has the potential to be transformed into something special. A great opportunity for those seeking a project with upside.
-
2026-01-18$140,000 Active
Show marketing remark (557 chars)
Investor special with potential! This 3-bedroom, 1-full-bath home at 216 Crane St. offers a great opportunity for the right buyer ready to bring it back to life. The property is in need of significant updates and repairs and is being sold AS IS, with no repairs to be made by the seller. Ideal for investors, flippers, or buyers with renovation experience looking to add value and build equity. With the right vision and work, this home has the potential to be transformed into something special. A great opportunity for those seeking a project with upside.
ⓘ Source: listings_history table (triggers on properties + properties_extension) + one-shot
backfill from property_details.listing_events for pre-trigger history.
Tax reassessment forecast MI · Partial reset (capped growth)
- Current annual tax
- $655 · $55/mo
- Projected year-2 tax
- $1,213 · $101/mo
- Expected delta
- +$558/yr (+$47/mo · 85.2%)
ⓘ Screening estimate from a state-policy table — verify with the county assessor before closing.
Climate risk First Street
- Flood 8/10 Severe FEMA zone X (unshaded) · 99% chance over 30 yrs
- Wildfire 1/10 Low
- Heat 2/10 Low 7 d/yr ≥98°F today · 16 d/yr by 30 yrs out
- Wind 2/10 Low
- Air quality 2/10 Low 1 unhealthy d/yr today · 2 by 30 yrs out
Nearby sold comps map
Loading sold comps map…
Walkable amenities ~0.75 mi
Loading nearby amenities…
Taxation est. · year 1
- Rental income
- $22,541
- − Mortgage interest
- −$6,442
- − Property taxes
- −$655
- − Insurance
- −$1,242
- − Repairs & maintenance
- −$1,803
- − Management
- −$1,803
- − Depreciation
- −$3,345
- Taxable income
- $7,251
- Est. tax owed @ 24.0%
- −$1,740
- After-tax cash flow
- $6,934/yr
For passive investors: Depreciation is non-cash, so a rental often shows a tax loss while cash-flowing — sheltering income. Rental losses are passive: they offset passive income freely, and up to $25,000/yr can offset ordinary (W-2) income if you actively participate and your MAGI is under $100k (phasing out to $0 by $150k); unused losses carry forward. On sale, claimed depreciation is recaptured at up to 25%, and gains may owe capital-gains tax (a 1031 exchange can defer both). Figures are a year-1 estimate at your 24.0% rate — not tax advice; consult a CPA.
Schools (NCES district)
- District
- Union City Community Schools
- NCES district ID
- 2634410
- Math proficiency
- 22% ▼ -9.00%
- Reading proficiency
- 39% ▼ -5.00%
- Median HH income
- $45,302
- Composite
- 26.1/100
- National rank
- #7288
- State rank
- #354 of 540 in MI
Livability — Union
No livability data for this city. (Only ~50 U.S. cities are tracked.)
Census & demographics
- Census place
- Union City, MI
- Population (ZIP)
- 3,755
Population outlook (Branch County) Hauer SSP2
- Today (2025)
- 41,079 people
- By 2030
- 39,622 · -3.5%
- By 2040
- 36,584 · -10.9%
- By 2050
- 33,462 · -18.5%
- By 2075
- 26,612 · -35.2%
- By 2100
- 18,580 · -54.8%
Race, ethnicity, and origin ACS 2023
- Neighborhood character
- Predominantly White (82%)
- Race & ethnicity
- White 82% Two or more races 13% Hispanic / Latino 6%
- Hispanic origin (detail)
- Mexican 5%
- Common ancestry
- Romanian 4% Italian 2% Slovak 2%
- Foreign-born
- 1%
- Languages at home
- 98% English-only · Spanish 1%
Political lean MEDSL · Branch
- 2024 margin
- Solid R (+42.4) · D 28.0% · R 70.4% · Other 1.6%
- 2008→2024 swing
- -36.2pp toward R · 2008: -6.1pp · 2024: -42.4pp
- All cycles
- 2024: R+42.4 2020: R+38.5 2016: R+38.1 2012: R+18.7 2008: R+6.1
Not yet ingested
- Civics
- —
Market trends
- HPI YoY
- ▼ -67.02%
- Current HPI
- 165.9347
- Rent YoY
- —
- Metro
- —
- State GDP YoY
- ▲ 1.37%
- F500 in state
- 28
Industry mix (Fortune 500 HQ in MI)
| Industry | F500 HQs | Revenue |
|---|---|---|
| Automotive Parts | 3 | $48B |
|
||
| Automotive | 2 | $372B |
|
||
| Chemicals | 1 | $45B |
|
||
| Automotive Retail | 1 | $29B |
|
||
| Healthcare / Medical Devices | 1 | $23B |
|
||
| Automotive Technology | 1 | $20B |
|
||
Price history
-17.9% since first listed6 events — show timeline
- 2026-02-17 Price Changed $115,000 MiRealSource-MiMLS
- 2026-02-16 Price Changed $115,000 REALCOMP
- 2026-02-16 Price Changed $115,000 SW Michigan MLS
- 2026-01-19 Listed $140,000 REALCOMP
- 2026-01-18 Listed $140,000 SW Michigan MLS
- 2026-01-18 Listed $140,000 MiRealSource-MiMLS
Property tax history
+121.4%/yrLatest (2024): $655 · +390.1% YoY. Source: county tax records.
Cash-flow waterfall
monthlySold comps — $/sqft
last 12 mo · ≤1 miLoading sold comps…