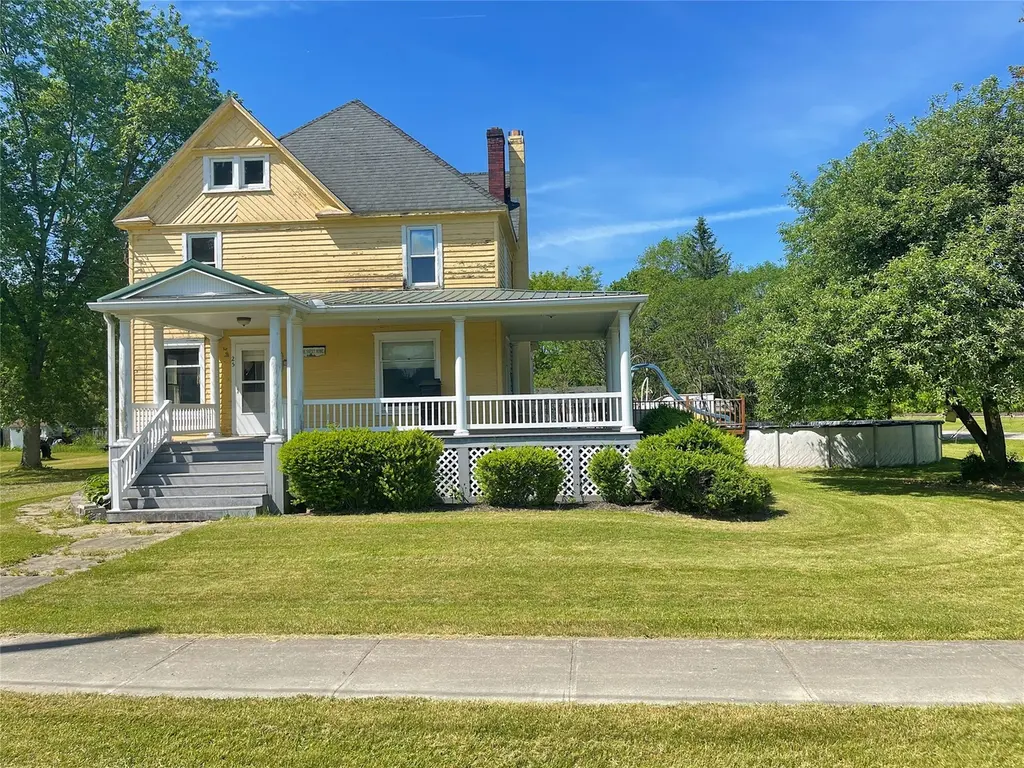
25 Depot Street St · Newark Valley, NY
Flood risk 8/10 · Major
- FEMA flood zone
- A
- Chance of flooding over 30 yrs
- 0.99%
- Est. flood insurance / yr
- $946 – $6,584
Fire risk 3/10 · Minor
- Est. fire insurance / yr
- $691 – $1,283
Heat risk 2/10 · Minimal
- Hot days now (above 93°F)
- 7 days/yr
- Hot days in 30 yrs
- 16 days/yr
Wind risk 2/10 · Minimal
- Chance of severe wind over 30 yrs
- 1.0%
Air-quality risk 2/10 · Minimal
- Unhealthy air days now
- 0 days/yr
- Unhealthy air days in 30 yrs
- 1 days/yr
Risk factors via First Street. Map © Google.
Why this score? — see what drove the C grade
The composite is a weighted blend of 9 inputs, each scored 0–100. Each bar is that input's sub-score; the figure is the points it added to the 100-point composite (weight × sub-score).
- Cash flow +16.5/30.0
- Appreciation +10.0/10.0
- ARV discount +7.5/15.0
- 1% rule +5.8/10.0
- DSCR +5.1/10.0
- Schools +3.8/10.0
- Livability +3.5/5.0
- Rent growth +2.5/5.0
- Condition / age +2.5/5.0
$135,000
🖨 Deal sheet (PDF) 📄 Offer letter ✓ Due diligence
Listing remarks
Step into this home full of timeless charm and character situated on a spacious corner lot in the heart of Berkshire. Rich original oak and chestnut woodwork showcase exceptional craftsmanship, complemented by beautiful pocket doors, an original fireplace, and a stunning bay window that fills the dining room with natural light. Plenty of space both inside and out, including a walk-up attic with potential for future expansion. Presenting a great opportunity for buyers looking to restore and personalize a home with historic appeal. Enjoy outdoor living from the wrap-around composite front porch or relax by the above-ground pool during the warmer months. Including a detached 2-car garage with
Key facts
- Pocket doors
- Chestnut woodwork
- Bay window
Tags
Property features AI
Exterior
- Parking: Detached garage (1 car)
- Utilities: Well water; Septic tank
- Home design: Single-family residence; Two levels
- Construction: Wood siding; Concrete perimeter foundation; Built area above grade: 2,064
- Exterior features: Covered porch; Deck; Above-ground outdoor pool; Shed(s); Level lot
Interior
- Flooring: Hardwood; Laminate; Vinyl
- Bathrooms: 2 full bathrooms
- Heating & cooling: Forced air heating; Other heating (see remarks)
- Interior features: Wood-burning fireplace in the living room; Basement; Hardwood, laminate, and vinyl flooring; 9 total rooms
Neighborhood map
What this means for you Summary
Snapshot
- This is a 3-bed/2.0-bath single-family listed at $135k.
Deal economics
- At list price, monthly cash flow is $-235 ($-3k/yr) — negative.
- To cash-flow at today's rent, offer at most $93k (30.8% below list).
- Meets the 1% rule at list price ($1k rent vs $135k).
- Recommended offer: $93k (30.8% below list) — sets the bar for cash-flow.
Location & tenants
- Location reads 70/100 on livability (#462 in NY) — a middle-class / working-renter tenant base. Strengths: cost of living A+, housing A+, employment B; Watch: health & safety D, crime F, amenities F.
- Newark Valley Central School District (rural): math 37% / reading 51% proficiency, ranked #466 of 590 in NY (top 79%) — families likely to look elsewhere, expect single-tenant / working-renter base with shorter leases.
- Zoned schools: Nathan T Hall School (math 37% / reading 47%, grade F, #1,361 of 2,108 statewide, top 67%, 322 students, 50% FRL); Newark Valley Middle School (math 23% / reading 41%, grade F, #511 of 729 statewide, top 71%, 290 students, 59% FRL); Newark Valley Senior High School (math 57% / reading 72%, grade B-, #776 of 1,100 statewide, top 73%, 414 students, 47% FRL).
- Market conditions: 11 active listings in the ZIP; 139 units permitted in Tioga County in 2024 (65 in 5+ unit buildings).
Forward outlook
- In year one you build about $14k of equity ($933 loan paydown + $14k appreciation (10.0% local appreciation)).
- Tioga County population projected at -27% by 2050 — secular population decline; favor cash flow + early exit over multi-decade hold.
- By year 3, paydown + projected appreciation supports a ~$37k cash-out refi (75% LTV) — recoverable capital for the next deal without selling this one.
Negotiation context
- Only 13 days on market — expect competitive offers; lowballing is unlikely to land.
- 11 sale attempts since 4y ago with the ask held roughly flat each time — persistent listings suggest the price (not the market) is what's stuck; bring a comps-based counter.
- Current owner paid $90k; list at $135k implies a 50% gain — meaningful room to come down on a strong offer.
Risks & watch-outs
- Watch-outs: property tax is 2.8% of price; flood insurance adds $314/mo; built in 1890 — expect roof / HVAC / electrical / plumbing capex.
- Climate carrying-cost: in FEMA flood zone A (mandatory federal flood insurance) — expect insurance premiums to compound above CPI over the hold.
Questions for the listing agent
- What do current leases actually rent for vs. the listed asking? Can we see a recent rent roll and the last 12 months of T-12 income?
- Built in 1890 — when were the roof, HVAC, electrical panel, plumbing, and water heater last replaced?
- Property tax is high relative to price — has the assessment been appealed recently, and will the sale trigger a re-assessment?
- What's the actual annual flood-insurance premium (NFIP or private), and is the property in a SFHA with mandatory coverage?
- Is there a deadline driving the sale (1031 exchange, divorce, estate, relocation)? That informs how much negotiation room exists.
- Crime grade is F in this area — have there been break-ins, vandalism, or insurance claims at this property in the last 3 years? What carrier currently insures it and at what premium?
- What's the average days-on-market for RENTAL listings here right now (not sales)? A rising rental-DOM trend means longer vacancies and softer asking-rent achievability than the comps imply.
- What's the recent tenant-quality profile in this submarket — average credit score on applications, eviction rate, late-payment / NSF rate, and stable-employment percentage? A property-management company in the area should have these aggregated.
- How much new for-sale + rental construction is in the pipeline within 1–3 miles? Heavy new supply typically softens prices + rents 12–24 months out; constrained supply supports both.
Investment metrics
- 1% rule
- 1.08% ✓
- Cap rate
- 6.99%
- Cash-on-cash
- 2.49%
- DSCR
- 1.11
- GRM
- 7.7
CMA / ARV
No comps found within radius.
Projected returns pro-forma
10.0% appreciation · 3.0% rent growth · sell at horizon
- IRR
- 19.1%
- Equity multiple
- 2.56×
- Total profit
- $58,849
- Equity at exit
- $121,619
- IRR
- 17.7%
- Equity multiple
- 5.91×
- Total profit
- $185,685
- Equity at exit
- $262,275
Cash invested: $37,800 (down + closing). Projections, not guarantees.
Landlord ↔ Tenant lean methodology
- Overall (STATE)
- 15 Strongly Tenant-Friendly
- State New York
- 15 Strongly Tenant-Friendly · D+10
- County
- — inherits STATE
- City
- — inherits STATE
ZIP-level market 13736
- Home prices YoY
- 3.5%
- Active inventory
- 11
- Price-to-rent
- 7.7×
Monthly cashflow live
- Estimated rent
- $1,464 medium interval (Pro) →
- Mortgage (P&I)
- −$708
- Tax from tax record
- −$314 /mo · $3,762/yr
- Insurance
- −$56
- Flood insurance flood zone
- −$314 /mo · $3,765/yr
- HOA
- −$0
- Vacancy / Maint / Mgmt
- −$307
- Net cashflow
- $-235
Break-even live
Sensitivity live
| Price | -10% $-159 | -5% $-197 | +0% $-235 | +5% $-273 | +10% $-312 |
|---|---|---|---|---|---|
| Rent | -10% $-351 | -5% $-293 | +0% $-235 | +5% $-177 | +10% $-120 |
| Rate | -1.0pp $-167 | -0.5pp $-201 | base $-235 | +0.5pp $-270 | +1.0pp $-306 |
UW: 25.0% down · 7.5% · 30yr · 1.5% tax · 5.0% vac · 8.0% maint · 8.0% mgmt
Financing live
Cash to close
- Down payment
- $33,750
- Closing costs
- $4,050
- Reserves months
- —
- Total cash needed
- —
Loan-product check · same deal, 3 products live
Conventional
25% down · 7.5% · 30yr
- Down + closing
- —
- Monthly P&I
- —
- Monthly cashflow
- —
- DSCR
- —
- Eligible?
- —
Personal DTI + credit; lowest rate.
DSCR
20% down · 8.5% · 30yr
- Down + closing
- —
- Monthly P&I
- —
- Monthly cashflow
- —
- DSCR
- —
- Eligible?
- —
No personal income docs; deal must DSCR.
Hard money
10% down · 12.0% · 12mo
- Down + closing
- —
- Monthly P&I
- —
- Monthly cashflow
- —
- DSCR
- —
- Eligible?
- —
Short-term bridge; refi at stabilization.
Listing history 11 events
-
2026-06-17status $135,000 Pending 13 DOM
-
2026-06-17days on market $135,000 Active 13 DOM
-
2026-06-16days on market $135,000 Active 12 DOM
-
2026-06-15days on market $135,000 Active 11 DOM
-
2026-06-14days on market $135,000 Active 9 DOM
-
2026-06-13days on market $135,000 Active 8 DOM
-
2026-06-10days on market $135,000 Active 6 DOM
-
2026-06-09days on market $135,000 Active 5 DOM
-
2026-06-08days on market $135,000 Active 4 DOM
-
2026-06-07remarks 699-char remark
-
2026-06-07$135,000 Active 3 DOM
ⓘ Source: listings_history table (triggers on properties + properties_extension) + one-shot
backfill from property_details.listing_events for pre-trigger history.
Tax reassessment forecast NY · Partial reset (capped growth)
- Current annual tax
- $3,762 · $314/mo
- Projected year-2 tax
- $3,762 · $314/mo
- Expected delta
- $0/yr ($0/mo · 0.0%)
ⓘ Screening estimate from a state-policy table — verify with the county assessor before closing.
Climate risk First Street
- Flood 8/10 Severe FEMA zone A · 99% chance over 30 yrs
- Wildfire 3/10 Moderate
- Heat 2/10 Low 7 d/yr ≥93°F today · 16 d/yr by 30 yrs out
- Wind 2/10 Low 100% chance of damaging wind over 30 yrs
- Air quality 2/10 Low 0 unhealthy d/yr today · 1 by 30 yrs out
Nearby sold comps map
Loading sold comps map…
Walkable amenities ~0.75 mi
Loading nearby amenities…
Taxation est. · year 1
- Rental income
- $17,564
- − Mortgage interest
- −$7,562
- − Property taxes
- −$3,762
- − Insurance
- −$4,440
- − Repairs & maintenance
- −$1,405
- − Management
- −$1,405
- − Depreciation
- −$3,927
- Taxable loss
- −$4,938
- Est. tax savings @ 24.0%
- +$1,185
- After-tax cash flow
- $-1,637/yr
For passive investors: Depreciation is non-cash, so a rental often shows a tax loss while cash-flowing — sheltering income. Rental losses are passive: they offset passive income freely, and up to $25,000/yr can offset ordinary (W-2) income if you actively participate and your MAGI is under $100k (phasing out to $0 by $150k); unused losses carry forward. On sale, claimed depreciation is recaptured at up to 25%, and gains may owe capital-gains tax (a 1031 exchange can defer both). Figures are a year-1 estimate at your 24.0% rate — not tax advice; consult a CPA.
Schools (NCES district)
- District
- Newark Valley Central School District
- NCES district ID
- 3620670
- Math proficiency
- 37% ▼ -10.00%
- Reading proficiency
- 51% ▲ 9.00%
- Median HH income
- $53,770
- Composite
- 38.12/100
- National rank
- #4273
- State rank
- #466 of 590 in NY
Livability — Newark Valley
- Score
- 70/100
- State rank
- #462
- US rank
- #8031
Category grades
Schools grade is shown separately in the Schools card above.
Census & demographics
- Population (ZIP)
- 1,887
Population outlook (Tioga County) Hauer SSP2
- Today (2025)
- 45,155 people
- By 2030
- 42,801 · -5.2%
- By 2040
- 37,960 · -15.9%
- By 2050
- 33,071 · -26.8%
- By 2075
- 24,144 · -46.5%
- By 2100
- 16,545 · -63.4%
Race, ethnicity, and origin ACS 2023
- Neighborhood character
- Predominantly White (95%)
- Race & ethnicity
- White 95% Two or more races 3% Hispanic / Latino 1%
- Common ancestry
- Romanian 4% Slovak 3% Italian 2%
- Foreign-born
- 1%
- Languages at home
- 98% English-only · Spanish 1%
Political lean MEDSL · Tioga
- 2024 margin
- Strong R (+22.9) · D 38.6% · R 61.4%
- 2008→2024 swing
- -12.7pp toward R · 2008: -10.2pp · 2024: -22.9pp
- All cycles
- 2024: R+22.9 2020: R+20.6 2016: R+27.6 2012: R+15.1 2008: R+10.2
Not yet ingested
- Civics
- —
Market trends
- HPI YoY
- ▲ 10.36%
- Current HPI
- 304.4569
- Rent YoY
- —
- Metro
- —
- State GDP YoY
- ▲ 2.60%
- F500 in state
- 92
Industry mix (Fortune 500 HQ in NY)
| Industry | F500 HQs | Revenue |
|---|---|---|
| Financial Services | 10 | $950B |
|
||
| Consumer Goods | 9 | $162B |
|
||
| Insurance | 4 | $225B |
|
||
| Telecommunications | 2 | $144B |
|
||
| Pharmaceuticals | 2 | $112B |
|
||
| Media / Entertainment | 2 | $69B |
|
||
Price history
+50.5% since first listed26 events — show timeline
- 2026-06-04 Listed $135,000 GBAOR
- 2025-10-30 Price Changed $149,000 GBAOR
- 2025-09-10 Relisted — GBAOR
- 2025-08-11 Listed $159,000 GBAOR
- 2025-07-15 Sold (Public Records) $90,000 Public Records
- 2023-10-02 Listing Removed — UNYREIS
- 2023-09-13 Price Changed $120,000 UNYREIS
- 2023-09-13 Price Changed $120,000 IBRMLS
- 2023-09-12 Relisted — IBRMLS
- 2023-09-12 Relisted — UNYREIS
- 2023-09-08 Contingent — IBRMLS
- 2023-09-08 Contingent — UNYREIS
- 2023-09-05 Listed $120,000 IBRMLS
- 2023-09-05 Listed $149,000 UNYREIS
- 2023-08-24 Price Changed $149,000 IBRMLS
- 2023-08-07 Price Changed $139,000 IBRMLS
- 2023-08-01 Relisted — IBRMLS
- 2023-08-01 Delisted — IBRMLS
- 2023-05-01 Price Changed $149,000 GBAOR
- 2023-05-01 Price Changed $149,000 IBRMLS
- 2023-03-08 Price Changed $160,900 GBAOR
- 2023-02-02 Price Changed $160,900 IBRMLS
- 2022-11-07 Listed $172,900 GBAOR
- 2022-10-25 Listed $120,000 IBRMLS
- 2022-10-25 Listed $172,900 IBRMLS
- 2011-08-23 Sold (Public Records) $89,725 Public Records
Property tax history
+0.0%/yrLatest (2025): $3,762 · +3.8% YoY. Source: county tax records.
Cash-flow waterfall
monthlySold comps — $/sqft
last 12 mo · ≤1 miLoading sold comps…