201 NW 135th Ave · Rainbow Park, FL
Flood risk 6/10 · Moderate
- FEMA flood zone
- X (unshaded)
- Chance of flooding over 30 yrs
- 0.73%
- Est. flood insurance / yr
- $507 – $1,088
Fire risk 5/10 · Moderate
- Est. fire insurance / yr
- $947 – $1,759
Heat risk 8/10 · Major
- Hot days now (above 107°F)
- 7 days/yr
- Hot days in 30 yrs
- 21 days/yr
Wind risk 9/10 · Severe
- Chance of severe wind over 30 yrs
- 99.0%
Air-quality risk 3/10 · Minor
- Unhealthy air days now
- 3 days/yr
- Unhealthy air days in 30 yrs
- 3 days/yr
Risk factors via First Street. Map © Google.
Why this score? — see what drove the B grade
The composite is a weighted blend of 9 inputs, each scored 0–100. Each bar is that input's sub-score; the figure is the points it added to the 100-point composite (weight × sub-score).
- Cash flow +30.0/30.0
- 1% rule +10.0/10.0
- DSCR +10.0/10.0
- ARV discount +7.5/15.0
- Rent growth +5.0/5.0
- Schools +3.6/10.0
- Livability +2.5/5.0
- Condition / age +2.5/5.0
- Appreciation +0.0/10.0
$119,000
🖨 Deal sheet 📄 Offer letter ✓ Due diligence
Listing remarks MLS
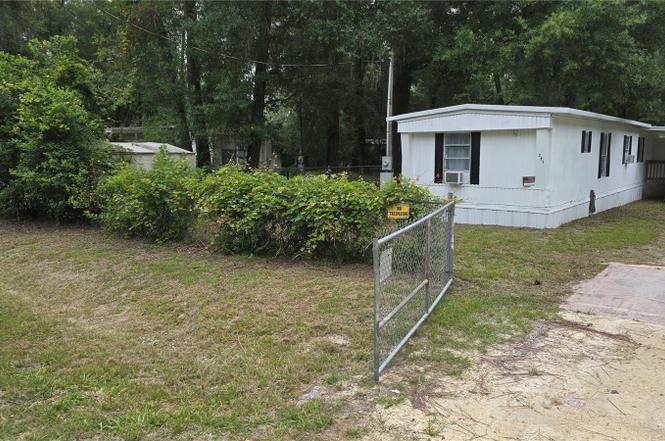
Looking for an affordable investment property or starter home ? This mobile is in the heart of horse country in northwest Marion County not far from the world Equestrian Center and HITS, making it a great rental prospect. This 3 bedroom 2 bath has a new well pump and three new AC wall units making it a great value !
Key facts
- New well pump
- New flooring
- Updated paint
Tags
Property features AI
Finance
- Other: Lot about 0.23 acres (approximately 83 x 120); One well and one septic on the property; Total living area reported as 924 square feet
Exterior
- Utilities: Well water; Septic tank; High-speed internet available; Cable connected; Electricity connected; Phone available
- Home design: Manufactured single-wide home; Attached property; One story; Faces east; Completed condition; Entry level: One
- Construction: Metal siding; Metal roof; Crawlspace foundation with pillar/post/pier
- Exterior features: Storage; Chain-link fencing; Limerock road access
Interior
- Kitchen: Range; Refrigerator; Electric water heater
- Bedrooms: 3 bedrooms
- Bathrooms: 2 full bathrooms
- Heating & cooling: Ductless heating; Wall/window air conditioning units
- Interior features: No notable interior features listed
- Laundry & utility: Washer; Dryer; Laundry located inside
Neighborhood map
What this means for you Summary
Snapshot
- This is a 3-bed/2.0-bath manufactured listed at $119k.
Deal economics
- At list price, monthly cash flow is $853 ($10k/yr) — positive.
- The deal already cash-flows at list — no discount required.
- Meets the 1% rule at list price ($2k rent vs $119k).
- Cap rate 14.9% vs local median 5.4% in Rainbow Park — top-decile yield for the area; either an underpriced asset or a hidden risk that comps aren't pricing in. Stress-test before assuming the spread holds.
Location & tenants
- Location reads: area grade B — affects rentability + tenant quality, not the cash-flow math above.
- Marion (rural): math 42% / reading 43% proficiency, ranked #61 of 73 in FL (top 84%) — families likely to look elsewhere, expect single-tenant / working-renter base with shorter leases; 61% free/reduced lunch — lower-income household profile, screen leases tightly.
- Market conditions: Rents rising fast (+11.1%/yr); 663 active listings in the ZIP; 7,071 units permitted in Marion County in 2024 (534 in 5+ unit buildings).
- This rent runs 37% of the median local income ($66k/yr) — at the standard rent-burdened threshold; future hikes will face affordability resistance.
Forward outlook
- Local home prices are declining (-3.0%/yr); year-one equity from $823 of loan paydown is wiped out by about $4k of value loss. Plan a longer hold.
- Marion County population projected at +13% by 2050 — modest demand growth; plan on rents tracking national, not racing it.
- At projected returns (-3.0% appreciation + 8.0% rent growth), your $33k cash investment doubles in ~4 years — after that, you're playing with house money.
Negotiation context
- Only 7 days on market — expect competitive offers; lowballing is unlikely to land.
- 3 sale attempts since 10y ago with the ask held roughly flat each time — persistent listings suggest the price (not the market) is what's stuck; bring a comps-based counter.
- Current owner paid $68k; list at $119k implies a 75% gain — meaningful room to come down on a strong offer.
Risks & watch-outs
- Climate carrying-cost: major flood risk; severe wind risk, 99% chance of damaging wind over 30y; moderate wildfire risk; extreme-heat days projected 7→21/yr by 2055 (HVAC capex compounding) — expect insurance premiums to compound above CPI over the hold.
Questions for the listing agent
- Is there a deadline driving the sale (1031 exchange, divorce, estate, relocation)? That informs how much negotiation room exists.
- What's the average days-on-market for RENTAL listings here right now (not sales)? A rising rental-DOM trend means longer vacancies and softer asking-rent achievability than the comps imply.
- What's the recent tenant-quality profile in this submarket — average credit score on applications, eviction rate, late-payment / NSF rate, and stable-employment percentage? A property-management company in the area should have these aggregated.
- How much new for-sale + rental construction is in the pipeline within 1–3 miles? Heavy new supply typically softens prices + rents 12–24 months out; constrained supply supports both.
Investment metrics
- 1% rule
- 1.71% ✓
- Cap rate
- 14.90%
- Cash-on-cash
- 30.73%
- DSCR
- 2.37
- GRM
- 4.9
CMA / ARV
No comps found within radius.
Projected returns pro-forma
-3.0% appreciation · 8.0% rent growth · sell at horizon
- IRR
- 30.8%
- Equity multiple
- 2.38×
- Total profit
- $45,817
- Equity at exit
- $17,743
- IRR
- 40.6%
- Equity multiple
- 5.77×
- Total profit
- $158,857
- Equity at exit
- $10,289
Cash invested: $33,320 (down + closing). Projections, not guarantees.
Landlord ↔ Tenant lean methodology
- Overall (STATE)
- 87 Strongly Landlord-Friendly
- State Florida
- 87 Strongly Landlord-Friendly · R+3
- County
- — inherits STATE
- City
- — inherits STATE
ZIP-level market 34482
- Rents YoY
- 11.1%
- Active inventory
- 663
- Price-to-rent
- 4.9×
Monthly cashflow live
- Estimated rent
- $2,038 medium interval (Pro) →
- Mortgage (P&I)
- −$624
- Tax from tax record
- −$84 /mo · $1,003/yr
- Insurance
- −$50
- HOA
- −$0
- Vacancy / Maint / Mgmt
- −$428
- Net cashflow
- $853
Break-even live
UW: 25.0% down · 7.5% · 30yr · 1.5% tax · 5.0% vac · 8.0% maint · 8.0% mgmt
Financing live
Cash to close
- Down payment
- $29,750
- Closing costs
- $3,570
- Reserves months
- —
- Total cash needed
- —
Loan-product check · same deal, 3 products live
Conventional
25% down · 7.5% · 30yr
- Down + closing
- —
- Monthly P&I
- —
- Monthly cashflow
- —
- DSCR
- —
- Eligible?
- —
Personal DTI + credit; lowest rate.
DSCR
20% down · 8.5% · 30yr
- Down + closing
- —
- Monthly P&I
- —
- Monthly cashflow
- —
- DSCR
- —
- Eligible?
- —
No personal income docs; deal must DSCR.
Hard money
10% down · 12.0% · 12mo
- Down + closing
- —
- Monthly P&I
- —
- Monthly cashflow
- —
- DSCR
- —
- Eligible?
- —
Short-term bridge; refi at stabilization.
Listing history 7 events
-
2026-06-18days on market $119,000 Active 7 DOM
-
2026-06-17days on market $119,000 Active 6 DOM
-
2026-06-16days on market $119,000 Active 5 DOM
-
2026-06-15days on market $119,000 Active 4 DOM
-
2026-06-14days on market $119,000 Active 2 DOM
-
2026-06-13remarks 633-char remark
-
2026-06-13$119,000 Active 1 DOM
ⓘ Source: listings_history table (triggers on properties + properties_extension) + one-shot
backfill from property_details.listing_events for pre-trigger history.
Tax reassessment forecast FL · Resets to sale price
- Current annual tax
- $1,003 · $84/mo
- Projected year-2 tax
- $1,003 · $84/mo
- Expected delta
- $0/yr ($0/mo · -0.0%)
ⓘ Screening estimate from a state-policy table — verify with the county assessor before closing.
Climate risk First Street
- Flood 6/10 Major FEMA zone X (unshaded) · 73% chance over 30 yrs
- Wildfire 5/10 Major
- Heat 8/10 Severe 7 d/yr ≥107°F today · 21 d/yr by 30 yrs out
- Wind 9/10 Extreme 99% chance of damaging wind over 30 yrs
- Air quality 3/10 Moderate 3 unhealthy d/yr today · 3 by 30 yrs out
Nearby sold comps map
Loading sold comps map…
Walkable amenities ~0.75 mi
Loading nearby amenities…
Taxation est. · year 1
- Rental income
- $24,461
- − Mortgage interest
- −$6,666
- − Property taxes
- −$1,003
- − Insurance
- −$595
- − Repairs & maintenance
- −$1,957
- − Management
- −$1,957
- − Depreciation
- −$3,462
- Taxable income
- $8,822
- Est. tax owed @ 24.0%
- −$2,117
- After-tax cash flow
- $8,121/yr
For passive investors: Depreciation is non-cash, so a rental often shows a tax loss while cash-flowing — sheltering income. Rental losses are passive: they offset passive income freely, and up to $25,000/yr can offset ordinary (W-2) income if you actively participate and your MAGI is under $100k (phasing out to $0 by $150k); unused losses carry forward. On sale, claimed depreciation is recaptured at up to 25%, and gains may owe capital-gains tax (a 1031 exchange can defer both). Figures are a year-1 estimate at your 24.0% rate — not tax advice; consult a CPA.
Schools (NCES district)
- District
- Marion
- NCES district ID
- 1201260
- Math proficiency
- 42% ▼ -7.00%
- Reading proficiency
- 43% ▼ -4.00%
- Median HH income
- $40,015
- Composite
- 35.61/100
- National rank
- #4890
- State rank
- #61 of 73 in FL
Livability — Rainbow Park
No livability data for this city. (Only ~50 U.S. cities are tracked.)
Census & demographics
- County
- Marion County · 315,796 people
- Metro
- Ocala, FL
- Population (ZIP)
- 22,807
- Household income
- $65,901
- Rent vs Own
- Severe rent burden
- 282.0
Population outlook (Marion County) Hauer SSP2
- Today (2025)
- 365,905 people
- By 2030
- 376,768 · +3.0%
- By 2040
- 396,555 · +8.4%
- By 2050
- 412,723 · +12.8%
- By 2075
- 446,090 · +21.9%
- By 2100
- 436,193 · +19.2%
Race, ethnicity, and origin ACS 2023
- Neighborhood character
- Majority White (63%)
- Race & ethnicity
- White 63% Hispanic / Latino 19% Black 14% Two or more races 12%
- Hispanic origin (detail)
- Mexican 6% Puerto Rican 9% Cuban 2%
- Common ancestry
- Lithuanian 2% Romanian 2% Slovak 2%
- Foreign-born
- 10% · Canada
- Languages at home
- 81% English-only · Spanish 16% Other Indo-European 1%
Political lean MEDSL · Marion
- 2024 margin
- Solid R (+31.6) · D 33.8% · R 65.5%
- 2008→2024 swing
- -20.0pp toward R · 2008: -11.6pp · 2024: -31.6pp
- All cycles
- 2024: R+31.6 2020: R+25.9 2016: R+26.2 2012: R+16.2 2008: R+11.6
Not yet ingested
- Civics
- —
Market trends
- HPI YoY
- ▼ -133.62%
- Current HPI
- 194.3857
- Rent YoY
- ▲ 11.12%
- Metro
- Ocala, FL
- State GDP YoY
- ▲ 3.28%
- F500 in state
- 36
Industry mix (Fortune 500 HQ in FL)
| Industry | F500 HQs | Revenue |
|---|---|---|
| Industrial Technology | 2 | $29B |
|
||
| Insurance | 2 | $17B |
|
||
| Retail | 1 | $60B |
|
||
| Technology Distribution | 1 | $58B |
|
||
| Homebuilding | 1 | $35B |
|
||
| Technology Manufacturing | 1 | $35B |
|
||
Price history
+296.7% since first listed7 events — show timeline
- 2026-06-11 Listed $119,000 Stellar MLS as Distributed by MLS Grid
- 2023-09-28 Sold (MLS) $68,000 Stellar MLS as Distributed by MLS Grid
- 2023-09-21 Sold (Public Records) $68,000 Public Records
- 2023-08-22 Pending — Stellar MLS as Distributed by MLS Grid
- 2023-08-17 Listed $74,900 Stellar MLS as Distributed by MLS Grid
- 2016-08-18 Sold (MLS) $26,500 Stellar MLS as Distributed by MLS Grid
- 2016-03-24 Listed $30,000 Stellar MLS as Distributed by MLS Grid
Property tax history
+7.7%/yrLatest (2025): $1,003 · +15.9% YoY. Source: county tax records.
Cash-flow waterfall
monthlySold comps — $/sqft
last 12 mo · ≤1 miLoading sold comps…