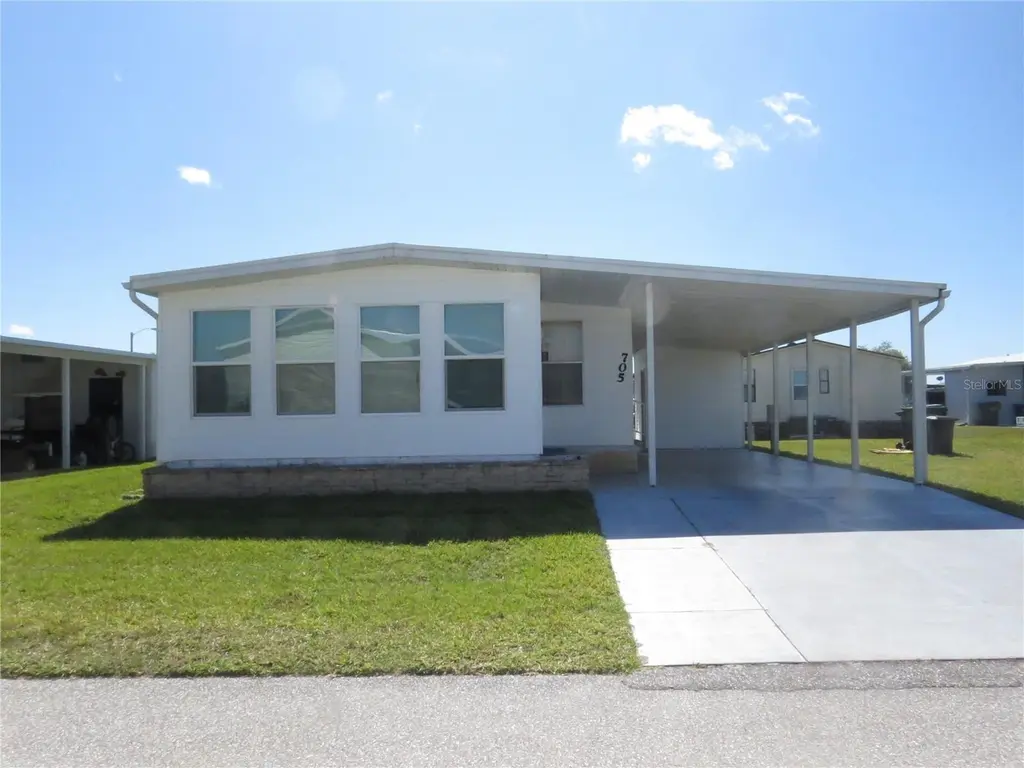
705 Blackburn Blvd · Warm Mineral Springs, FL
Flood risk 9/10 · Severe
- FEMA flood zone
- AE
- Chance of flooding over 30 yrs
- 0.99%
- Est. flood insurance / yr
- $1,737 – $8,500
Fire risk 5/10 · Moderate
- Est. fire insurance / yr
- $947 – $1,759
Heat risk 10/10 · Severe
- Hot days now (above 107°F)
- 7 days/yr
- Hot days in 30 yrs
- 29 days/yr
Wind risk 10/10 · Severe
- Chance of severe wind over 30 yrs
- 99.0%
Air-quality risk 2/10 · Minimal
- Unhealthy air days now
- 1 days/yr
- Unhealthy air days in 30 yrs
- 1 days/yr
Risk factors via First Street. Map © Google.
Why this score? — see what drove the B grade
The composite is a weighted blend of 9 inputs, each scored 0–100. Each bar is that input's sub-score; the figure is the points it added to the 100-point composite (weight × sub-score).
- Cash flow +30.0/30.0
- 1% rule +10.0/10.0
- DSCR +10.0/10.0
- ARV discount +7.5/15.0
- Schools +5.4/10.0
- Livability +3.3/5.0
- Rent growth +2.6/5.0
- Condition / age +2.5/5.0
- Appreciation +0.0/10.0
$100,000
🖨 Deal sheet 📄 Offer letter ✓ Due diligence
Listing remarks MLS
Harbor Cove is a desirable 55+ waterfront community that has everything you need to enjoy paradise. Optional: Recreation/fitness center, a slip in the marina, and a space in compound/storage. Enjoy Florida's Retirement Lifestyle at an affordable price. This home features 2 bedrooms and 2 full bathrooms, a nice size kitchen, living room, dining room plus a remodeled Florida room off the front of the home, a shed with laundry room and storage area. This community is pet friendly. Located on the sought after Myakka River; the 90 slip Marina is a boater's dream come true. Dry storage is also available. Charlotte Harbor and Gulf of Mexico are nearby. Harbor Cove has two heated pools, hot tubs, tennis courts, shuffleboard, pickle ball, horseshoes, water aerobics, fitness classes, art classes, woodworking, golf cart parades, bingo, and dances. Boat clubs, a craft room, picnics on the patio, golf clubs, bowling clubs and much more. There is plenty of wildlife to enjoy in this 190 acre community. Conveniently located within minutes of Downtown shopping, restaurants, and a short drive to beautiful Gulf Beaches.
Key facts
- Slip in marina
- Waterfront community
- Pet friendly
Tags
Neighborhood map
What this means for you Summary
Snapshot
- This is a 2-bed/2.0-bath manufactured listed at $100k.
Deal economics
- At list price, monthly cash flow is $40 ($485/yr) — positive.
- The deal already cash-flows at list — no discount required.
- Meets the 1% rule at list price ($2k rent vs $100k).
- Recommended offer: $88k (12.0% below list) — sets the bar for market timing.
Location & tenants
- Location reads 66/100 on livability (#604 in FL) — a middle-class / working-renter tenant base. Strengths: cost of living A+, housing A+, crime B+; Watch: schools D-, amenities F, commute F.
- Sarasota (urban): math 63% / reading 63% proficiency, ranked #7 of 73 in FL (top 10%) — acceptable for families but not a draw, mixed tenant base, ~2y average lease.
- Market conditions: Rents flat; 852 active listings in the ZIP; 7,466 units permitted in Sarasota County in 2024 (2,138 in 5+ unit buildings).
- This rent runs 31% of the median local income ($63k/yr) — at the standard rent-burdened threshold; future hikes will face affordability resistance.
Forward outlook
- Local home prices are declining (-3.0%/yr); year-one equity from $691 of loan paydown is wiped out by about $3k of value loss. Plan a longer hold.
- Sarasota County population projected at +20% by 2050 — long-run rental-demand tailwind backs the buy-and-hold thesis.
Negotiation context
- It's been on market 287 days — a 12% lower offer ($88k) is reasonable based on typical stale-listing flexibility.
- 3 sale attempts; this cycle's ask has dropped $25k (20%) from the opening price — seller is motivated, your offer sets the floor, not the list.
- Current owner paid $80k; 25% above their basis — modest negotiation headroom, anchor on the comps not their cost.
Risks & watch-outs
- Watch-outs: flood insurance adds $427/mo.
- Climate carrying-cost: in FEMA flood zone AE (mandatory federal flood insurance); severe wind risk, 99% chance of damaging wind over 30y; moderate wildfire risk; extreme-heat days projected 7→29/yr by 2055 (HVAC capex compounding) — expect insurance premiums to compound above CPI over the hold.
Questions for the listing agent
- It's been on market 287 days. Have you received any prior offers? Is the seller open to a 12% concession, seller financing, or rate buy-down credit?
- Built in 1978 — when were the roof, HVAC, electrical panel, plumbing, and water heater last replaced?
- What's the actual annual flood-insurance premium (NFIP or private), and is the property in a SFHA with mandatory coverage?
- What does the HOA fee cover, when was the last increase, and are there any pending special assessments or reserve-fund shortfalls?
- Why hasn't it sold? Are there any deal-killer items the seller is aware of (foundation, flood, title, zoning, code violations)?
- Is there a deadline driving the sale (1031 exchange, divorce, estate, relocation)? That informs how much negotiation room exists.
- Schools are D-rated, which usually means shorter tenancies and higher turnover. Who's the typical renter profile here, and what's been the actual vacancy rate?
- What's the average days-on-market for RENTAL listings here right now (not sales)? A rising rental-DOM trend means longer vacancies and softer asking-rent achievability than the comps imply.
- What's the recent tenant-quality profile in this submarket — average credit score on applications, eviction rate, late-payment / NSF rate, and stable-employment percentage? A property-management company in the area should have these aggregated.
- How much new for-sale + rental construction is in the pipeline within 1–3 miles? Heavy new supply typically softens prices + rents 12–24 months out; constrained supply supports both.
Investment metrics
- 1% rule
- 1.64% ✓
- Cap rate
- 11.90%
- Cash-on-cash
- 20.01%
- DSCR
- 1.89
- GRM
- 5.1
CMA / ARV
No comps found within radius.
Projected returns pro-forma
-3.0% appreciation · 0.26% rent growth · sell at horizon
- IRR
- -18.8%
- Equity multiple
- 0.37×
- Total profit
- $-17,667
- Equity at exit
- $14,910
- IRR
- -27.0%
- Equity multiple
- 0.01×
- Total profit
- $-27,691
- Equity at exit
- $8,646
Cash invested: $28,000 (down + closing). Projections, not guarantees.
Landlord ↔ Tenant lean methodology
- Overall (STATE)
- 87 Strongly Landlord-Friendly
- State Florida
- 87 Strongly Landlord-Friendly · R+3
- County
- — inherits STATE
- City
- — inherits STATE
ZIP-level market 34287
- Home prices YoY
- -20.1%
- Rents YoY
- 0.3%
- Active inventory
- 852
- Price-to-rent
- 5.1×
Monthly cashflow live
- Estimated rent
- $1,645 medium interval (Pro) →
- Mortgage (P&I)
- −$524
- Tax from tax record
- −$116 /mo · $1,393/yr
- Insurance
- −$42
- Flood insurance flood zone
- −$427 /mo · $5,118/yr
- HOA
- −$150
- Vacancy / Maint / Mgmt
- −$345
- Net cashflow
- $40
Break-even live
UW: 25.0% down · 7.5% · 30yr · 1.5% tax · 5.0% vac · 8.0% maint · 8.0% mgmt
Financing live
Cash to close
- Down payment
- $25,000
- Closing costs
- $3,000
- Reserves months
- —
- Total cash needed
- —
Loan-product check · same deal, 3 products live
Conventional
25% down · 7.5% · 30yr
- Down + closing
- —
- Monthly P&I
- —
- Monthly cashflow
- —
- DSCR
- —
- Eligible?
- —
Personal DTI + credit; lowest rate.
DSCR
20% down · 8.5% · 30yr
- Down + closing
- —
- Monthly P&I
- —
- Monthly cashflow
- —
- DSCR
- —
- Eligible?
- —
No personal income docs; deal must DSCR.
Hard money
10% down · 12.0% · 12mo
- Down + closing
- —
- Monthly P&I
- —
- Monthly cashflow
- —
- DSCR
- —
- Eligible?
- —
Short-term bridge; refi at stabilization.
HOA detail
- Monthly dues
- $150 · $1,800/yr
- Likely covers
- waterpoolgym
Listing history 20 events
-
2026-06-18days on market $100,000 Active 287 DOM
-
2026-06-17pricedays on market $100,000 Active 286 DOM
-
2026-06-15days on market $125,000 Active 284 DOM
-
2026-06-13days on market $125,000 Active 282 DOM
-
2026-06-13days on market $125,000 Active 281 DOM
-
2026-06-10days on market $125,000 Active 279 DOM
-
2026-06-09days on market $125,000 Active 278 DOM
-
2026-06-08days on market $125,000 Active 276 DOM
-
2026-06-05days on market $125,000 Active 273 DOM
-
2026-06-03days on market $125,000 Active 272 DOM
-
2026-06-02days on market $125,000 Active 271 DOM
-
2026-06-01days on market $125,000 Active 270 DOM
-
2026-05-31days on market $125,000 Active 269 DOM
-
2025-09-04$125,000 Active 1118-char remark
Show marketing remark (1118 chars)
Harbor Cove is a desirable 55+ waterfront community that has everything you need to enjoy paradise. Optional: Recreation/fitness center, a slip in the marina, and a space in compound/storage. Enjoy Florida's Retirement Lifestyle at an affordable price. This home features 2 bedrooms and 2 full bathrooms, a nice size kitchen, living room, dining room plus a remodeled Florida room off the front of the home, a shed with laundry room and storage area. This community is pet friendly. Located on the sought after Myakka River; the 90 slip Marina is a boater's dream come true. Dry storage is also available. Charlotte Harbor and Gulf of Mexico are nearby. Harbor Cove has two heated pools, hot tubs, tennis courts, shuffleboard, pickle ball, horseshoes, water aerobics, fitness classes, art classes, woodworking, golf cart parades, bingo, and dances. Boat clubs, a craft room, picnics on the patio, golf clubs, bowling clubs and much more. There is plenty of wildlife to enjoy in this 190 acre community. Conveniently located within minutes of Downtown shopping, restaurants, and a short drive to beautiful Gulf Beaches.
-
2025-07-31historical
-
2025-05-02price $125,000
-
2025-05-02price $125,000
-
2025-03-22$150,000 Active
-
2025-03-22$150,000 Active
-
2004-04-30soldstatus $79,900
ⓘ Source: listings_history table (triggers on properties + properties_extension) + one-shot
backfill from property_details.listing_events for pre-trigger history.
Tax reassessment forecast FL · Resets to sale price
- Current annual tax
- $1,393 · $116/mo
- Projected year-2 tax
- $1,393 · $116/mo
- Expected delta
- $0/yr ($0/mo · 0.0%)
ⓘ Screening estimate from a state-policy table — verify with the county assessor before closing.
Climate risk First Street
- Flood 9/10 Extreme FEMA zone AE · 99% chance over 30 yrs
- Wildfire 5/10 Major
- Heat 10/10 Extreme 7 d/yr ≥107°F today · 29 d/yr by 30 yrs out
- Wind 10/10 Extreme 99% chance of damaging wind over 30 yrs
- Air quality 2/10 Low 1 unhealthy d/yr today · 1 by 30 yrs out
Nearby sold comps map
Loading sold comps map…
Walkable amenities ~0.75 mi
Loading nearby amenities…
Taxation est. · year 1
- Rental income
- $19,734
- − Mortgage interest
- −$5,602
- − Property taxes
- −$1,393
- − Insurance
- −$5,618
- − Repairs & maintenance
- −$1,579
- − Management
- −$1,579
- − HOA
- −$1,800
- − Depreciation
- −$2,909
- Taxable loss
- −$746
- Est. tax savings @ 24.0%
- +$179
- After-tax cash flow
- $664/yr
For passive investors: Depreciation is non-cash, so a rental often shows a tax loss while cash-flowing — sheltering income. Rental losses are passive: they offset passive income freely, and up to $25,000/yr can offset ordinary (W-2) income if you actively participate and your MAGI is under $100k (phasing out to $0 by $150k); unused losses carry forward. On sale, claimed depreciation is recaptured at up to 25%, and gains may owe capital-gains tax (a 1031 exchange can defer both). Figures are a year-1 estimate at your 24.0% rate — not tax advice; consult a CPA.
Schools (NCES district)
- District
- Sarasota
- NCES district ID
- 1201680
- Math proficiency
- 63% ▼ -8.00%
- Reading proficiency
- 63% ▼ -3.00%
- Median HH income
- $51,167
- Composite
- 53.68/100
- National rank
- #1428
- State rank
- #7 of 73 in FL
Livability — Warm Mineral Springs
- Score
- 66/100
- State rank
- #604
- US rank
- #11606
Category grades
Schools grade is shown separately in the Schools card above.
Census & demographics
- Census place
- Warm Mineral Springs, FL
- County
- Sarasota County · 448,376 people
- City population
- 75,324
- Metro
- North Port-Sarasota-Bradenton, FL
- Population (ZIP)
- 25,929
- Household income
- $63,464
- Rent vs Own
- Severe rent burden
- 522.0
Population outlook (Sarasota County) Hauer SSP2
- Today (2025)
- 452,380 people
- By 2030
- 474,175 · +4.8%
- By 2040
- 511,577 · +13.1%
- By 2050
- 541,467 · +19.7%
- By 2075
- 604,947 · +33.7%
- By 2100
- 621,965 · +37.5%
Race, ethnicity, and origin ACS 2023
- Neighborhood character
- Predominantly White (77%)
- Race & ethnicity
- White 77% Hispanic / Latino 14% Two or more races 7% Asian 4% Black 3%
- Hispanic origin (detail)
- Mexican 2% Puerto Rican 3% Cuban 3% Dominican 1%
- Common ancestry
- Romanian 4% Scotch-Irish 3% Lithuanian 3%
- Foreign-born
- 16% · Canada, Philippines
- Languages at home
- 81% English-only · Spanish 8% Russian/Polish/Slavic 5% French/Haitian/Cajun 2%
Political lean MEDSL · Sarasota
- 2024 margin
- R (+18.2) · D 40.5% · R 58.7%
- 2008→2024 swing
- -18.1pp toward R · 2008: -0.1pp · 2024: -18.2pp
- All cycles
- 2024: R+18.2 2020: R+10.4 2016: R+11.6 2012: R+7.4 2008: R+0.1
Not yet ingested
- Civics
- —
Market trends
- HPI YoY
- ▼ -70.89%
- Current HPI
- 280.8484
- Rent YoY
- ▲ 0.26%
- Metro
- North Port-Sarasota-Bradenton, FL
- State GDP YoY
- ▲ 3.28%
- F500 in state
- 36
Industry mix (Fortune 500 HQ in FL)
| Industry | F500 HQs | Revenue |
|---|---|---|
| Industrial Technology | 2 | $29B |
|
||
| Insurance | 2 | $17B |
|
||
| Retail | 1 | $60B |
|
||
| Technology Distribution | 1 | $58B |
|
||
| Homebuilding | 1 | $35B |
|
||
| Technology Manufacturing | 1 | $35B |
|
||
Price history
+56.4% since first listed7 events — show timeline
- 2025-09-04 Listed $125,000 Stellar MLS as Distributed by MLS Grid
- 2025-07-31 Listing Removed — Stellar MLS as Distributed by MLS Grid
- 2025-05-02 Price Changed $125,000 NAPLESMLS
- 2025-05-02 Price Changed $125,000 Stellar MLS as Distributed by MLS Grid
- 2025-03-22 Listed $150,000 NAPLESMLS
- 2025-03-22 Listed $150,000 Stellar MLS as Distributed by MLS Grid
- 2004-04-30 Sold (Public Records) $79,900 Public Records
Property tax history
+5.6%/yrLatest (2025): $1,393 · +11.2% YoY. Source: county tax records.
Cash-flow waterfall
monthlySold comps — $/sqft
last 12 mo · ≤1 miLoading sold comps…