5246 Sachem Dr · San Antonio, TX
Flood risk 1/10 · Minimal
- FEMA flood zone
- X (unshaded)
- Chance of flooding over 30 yrs
- 0.0%
- Est. flood insurance / yr
- $507 – $1,088
Fire risk 3/10 · Minor
- Est. fire insurance / yr
- $1,222 – $2,270
Heat risk 8/10 · Major
- Hot days now (above 109°F)
- 7 days/yr
- Hot days in 30 yrs
- 22 days/yr
Wind risk 8/10 · Major
- Chance of severe wind over 30 yrs
- 80.0%
Air-quality risk 2/10 · Minimal
- Unhealthy air days now
- 0 days/yr
- Unhealthy air days in 30 yrs
- 1 days/yr
Risk factors via First Street. Map © Google.
Why this score? — see what drove the C+ grade
The composite is a weighted blend of 9 inputs, each scored 0–100. Each bar is that input's sub-score; the figure is the points it added to the 100-point composite (weight × sub-score).
- Cash flow +23.9/30.0
- ARV discount +15.0/15.0
- DSCR +7.7/10.0
- 1% rule +5.9/10.0
- Livability +4.0/5.0
- Condition / age +2.5/5.0
- Rent growth +2.2/5.0
- Schools +2.2/10.0
- Appreciation +0.0/10.0
$117,999
🖨 Deal sheet 📄 Offer letter ✓ Due diligence
Listing remarks MLS
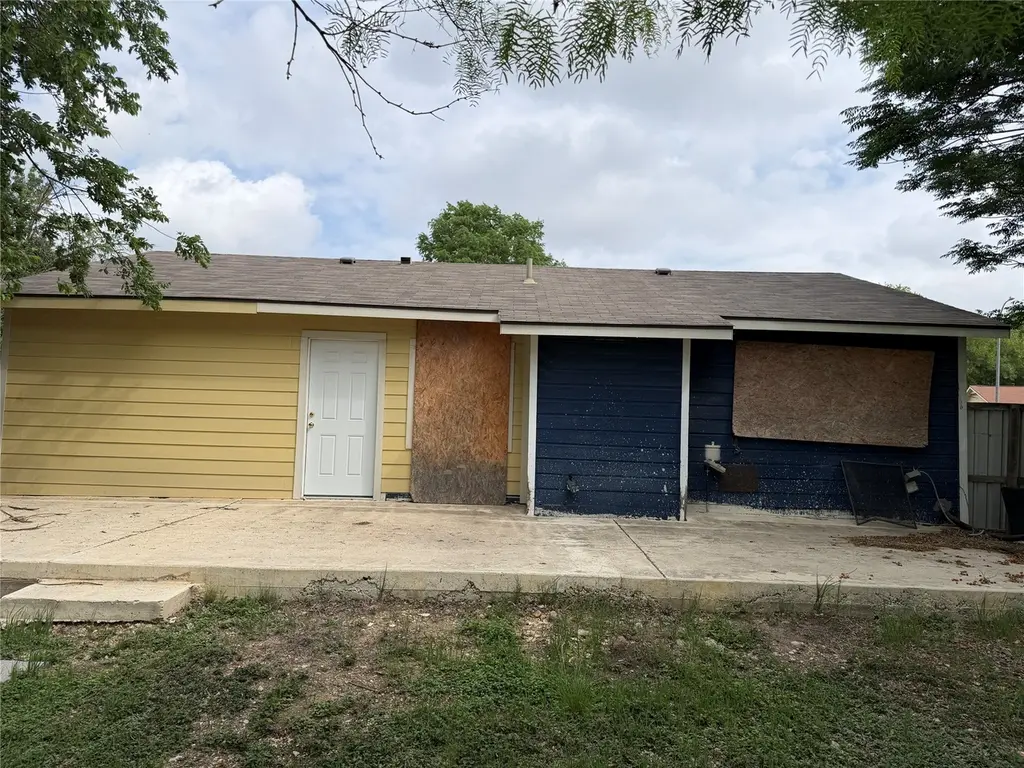
INVESTORS! This might be the ideal fixer upper that you have been looking for. It has some fire damage and is being sold AS IS but it is in a good location and has lots of potential. This home features three bedrooms, one bathroom and a one car attached garage. It has easy access to both 410 and I-35. WE MAKE IT EASY TO OWN. This is a great opportunity! Don't wait, call us today to get more information on the owner's easy terms and smooth process that may be able to put the deed in your name and make this your dream investment.
Key facts
- 7,474 sq ft lot
- Garage
- Built 1978
Neighborhood map
What this means for you Summary
Snapshot
- This is a 3-bed/2.0-bath single-family listed at $118k.
Deal economics
- At list price, monthly cash flow is $229 ($3k/yr) — positive.
- The deal already cash-flows at list — no discount required.
- Meets the 1% rule at list price ($1k rent vs $118k).
- Recommended offer: $104k (12.0% below list) — sets the bar for market timing.
- Cap rate 8.6% vs local median 3.8% in San Antonio — top-decile yield for the area; either an underpriced asset or a hidden risk that comps aren't pricing in. Stress-test before assuming the spread holds.
Location & tenants
- Location reads 80/100 on livability (#31 in TX, #1,616 nationally) — a professional / high-income tenant draw. Strengths: amenities A+, commute A+, cost of living A+; Watch: schools C-, crime F.
- Southwest ISD (rural): math 21% / reading 31% proficiency, ranked #701 of 826 in TX (top 85%) — low school quality limits family demand, transient renter base, plan for 1-2y turnover; 75% free/reduced lunch — lower-income household profile, screen leases tightly.
- Market conditions: Rents soft (-1.3%/yr); 91 active listings in the ZIP; 10 comparable units currently listed for rent nearby; rentals at typical pace (median 22d on market — plan ~3-4 weeks tenant-placement turnaround); 8,308 units permitted in Bexar County in 2024 (2,506 in 5+ unit buildings).
- This rent runs 31% of the median local income ($51k/yr) — at the standard rent-burdened threshold; future hikes will face affordability resistance.
Forward outlook
- Local home prices are declining (-3.0%/yr); year-one equity from $816 of loan paydown is wiped out by about $4k of value loss. Plan a longer hold.
- Bexar County population projected at +50% by 2050 — long-run rental-demand tailwind backs the buy-and-hold thesis.
Negotiation context
- It's been on market 479 days — a 12% lower offer ($104k) is reasonable based on typical stale-listing flexibility.
- 4 sale attempts since 7y ago with the ask held roughly flat each time — persistent listings suggest the price (not the market) is what's stuck; bring a comps-based counter.
- Current owner paid $32k; list at $118k implies a 265% gain — meaningful room to come down on a strong offer.
Risks & watch-outs
- Climate carrying-cost: severe wind risk, 80% chance of damaging wind over 30y; extreme-heat days projected 7→22/yr by 2055 (HVAC capex compounding) — expect insurance premiums to compound above CPI over the hold.
Questions for the listing agent
- It's been on market 479 days. Have you received any prior offers? Is the seller open to a 12% concession, seller financing, or rate buy-down credit?
- Built in 1978 — when were the roof, HVAC, electrical panel, plumbing, and water heater last replaced?
- Why hasn't it sold? Are there any deal-killer items the seller is aware of (foundation, flood, title, zoning, code violations)?
- Is there a deadline driving the sale (1031 exchange, divorce, estate, relocation)? That informs how much negotiation room exists.
- Crime grade is F in this area — have there been break-ins, vandalism, or insurance claims at this property in the last 3 years? What carrier currently insures it and at what premium?
- What's the average days-on-market for RENTAL listings here right now (not sales)? A rising rental-DOM trend means longer vacancies and softer asking-rent achievability than the comps imply.
- What's the recent tenant-quality profile in this submarket — average credit score on applications, eviction rate, late-payment / NSF rate, and stable-employment percentage? A property-management company in the area should have these aggregated.
- How much new for-sale + rental construction is in the pipeline within 1–3 miles? Heavy new supply typically softens prices + rents 12–24 months out; constrained supply supports both.
Investment metrics
- 1% rule
- 1.09% ✓
- Cap rate
- 8.62%
- Cash-on-cash
- 8.32%
- DSCR
- 1.37
- GRM
- 7.6
CMA / ARV
- ARV (median comp)
- $165,107
- List price
- $117,999
- Delta
- -28.53%
- Verdict
- UNDERPRICED
- Comps
- 20 within 1.0 mi
Show comp detail 8 sales within ~0.75 mi
| Address | Dist | Beds/Ba | Sqft | Sold | Price | $/sf | Match |
|---|---|---|---|---|---|---|---|
| 5301 Castle Cv | 0.19mi | 3/1.0 | 852 (+3%) | 14mo | $140,000 | $164 | 70 |
| 8638 Standing Bear | 0.23mi | 3/2.0 | 947 (+15%) | 2mo | $90,000 | $95 | 63 |
| 5154 Sagamore Dr | 0.12mi | 3/1.5 | 900 (+9%) | 19mo | $184,996 | $206 | 61 |
| 9170 Port Victoria | 0.27mi | 3/1.0 | 896 (+9%) | 19mo | $135,000 | $151 | 53 |
| 5823 Bowsprit | 0.71mi | 3/1.0 | 900 (+9%) | 3mo | $129,000 | $143 | 45 |
| 5358 Trading Post Dr | 0.38mi | 3/1.5 | 930 (+13%) | 17mo | $139,995 | $151 | 45 |
| 8610 Big Creek Dr | 0.53mi | 3/2.0 | 928 (+13%) | 14mo | $160,000 | $172 | 43 |
| 9122 Seafarer | 0.62mi | 2/1.0 (-1) | 914 (+11%) | 10mo | $119,000 | $130 | 36 |
Match score weights: distance 35% · size 25% · config 20% · recency 20%. Top-matched comps best support the ARV.
Projected returns pro-forma
-3.0% appreciation · 0.0% rent growth · sell at horizon
- IRR
- -7.0%
- Equity multiple
- 0.75×
- Total profit
- $-8,315
- Equity at exit
- $17,594
- IRR
- -1.6%
- Equity multiple
- 0.91×
- Total profit
- $-3,058
- Equity at exit
- $10,202
Cash invested: $33,040 (down + closing). Projections, not guarantees.
Landlord ↔ Tenant lean methodology
- Overall (STATE)
- 87 Strongly Landlord-Friendly
- State Texas
- 87 Strongly Landlord-Friendly · R+5
- County
- — inherits STATE
- City
- — inherits STATE
ZIP-level market 78242
- Home prices YoY
- -17.6%
- Rents YoY
- -1.3%
- Active inventory
- 91
- Price-to-rent
- 7.6×
Monthly cashflow live
- Estimated rent
- $1,290 high interval (Pro) →
- Mortgage (P&I)
- −$619
- Tax from tax record
- −$122 /mo · $1,467/yr
- Insurance
- −$49
- HOA
- −$0
- Vacancy / Maint / Mgmt
- −$271
- Net cashflow
- $229
Break-even live
UW: 25.0% down · 7.5% · 30yr · 1.5% tax · 5.0% vac · 8.0% maint · 8.0% mgmt
Financing live
Cash to close
- Down payment
- $29,500
- Closing costs
- $3,540
- Reserves months
- —
- Total cash needed
- —
Loan-product check · same deal, 3 products live
Conventional
25% down · 7.5% · 30yr
- Down + closing
- —
- Monthly P&I
- —
- Monthly cashflow
- —
- DSCR
- —
- Eligible?
- —
Personal DTI + credit; lowest rate.
DSCR
20% down · 8.5% · 30yr
- Down + closing
- —
- Monthly P&I
- —
- Monthly cashflow
- —
- DSCR
- —
- Eligible?
- —
No personal income docs; deal must DSCR.
Hard money
10% down · 12.0% · 12mo
- Down + closing
- —
- Monthly P&I
- —
- Monthly cashflow
- —
- DSCR
- —
- Eligible?
- —
Short-term bridge; refi at stabilization.
Rent comps 10 comps
| Address | Beds | Baths | Sqft | Rent | $/sqft | DOM | Units | Dist |
|---|---|---|---|---|---|---|---|---|
| 8715 Yellow Knife St San Antonio, TX | 3.0 | 2.0 | 900 | $1,125 | $1.25 | 23d | 1 | 0.19mi |
| 9228 Balboa Port Dr San Antonio, TX | 3.0 | 2.0 | 1064 | $1,500 | $1.41 | 43d | 1 | 0.68mi |
| 5427 Indian Desert St San Antonio, TX | 3.0 | 2.0 | 888 | $1,195 | $1.35 | 21d | 1 | 0.79mi |
| 5510 Seahorse Dr San Antonio, TX | 3.0 | 1.5 | 1060 | $1,395 | $1.32 | 4d | 1 | 0.93mi |
| 7910 Dempsey Dr San Antonio, TX | 2.0 | 1.0 | 550 | $695 | $1.26 | 43d | 1 | 1.12mi |
| 9447 Tarbutton Trl San Antonio, TX | 3.0 | 2.0 | 1007 | $1,550 | $1.54 | 16d | 1 | 1.27mi |
| 9323 Somerset Rd Unit 710 San Antonio, TX | 2.0 | 2.0 | 954 | $981 | $1.03 | 3d | 1 | 1.47mi |
| 5415 Ray Ellison Blvd San Antonio, TX | 1.0–2.0 | 1.0–2.0 | 878 | $1,240 | $1.41 | 4d | 24 | 1.47mi |
| 7515 Holm Rd San Antonio, TX | 1.0–3.0 | 1.0–2.0 | 886 | $1,404 | $1.58 | 3d | 31 | 1.50mi |
| 9257 Somerset Rd San Antonio, TX | 2.0 | 2.0 | 850 | $863 | $1.02 | 43d | 1 | 1.50mi |
Listing history 27 events
-
2026-06-18days on market $117,999 Active 479 DOM
-
2026-06-17days on market $117,999 Active 478 DOM
-
2026-06-16days on market $117,999 Active 477 DOM
-
2026-06-15days on market $117,999 Active 476 DOM
-
2026-06-13days on market $117,999 Active 474 DOM
-
2026-06-09days on market $117,999 Active 470 DOM
-
2026-06-08days on market $117,999 Active 469 DOM
-
2026-06-07days on market $117,999 Active 468 DOM
-
2026-06-04days on market $117,999 Active 465 DOM
-
2026-06-03days on market $117,999 Active 464 DOM
-
2026-06-02days on market $117,999 Active 463 DOM
-
2026-06-01days on market $117,999 Active 462 DOM
-
2026-05-31days on market $117,999 Active 461 DOM
-
2025-07-03status Active 534-char remark
Show marketing remark (534 chars)
INVESTORS! This might be the ideal fixer upper that you have been looking for. It has some fire damage and is being sold AS IS but it is in a good location and has lots of potential. This home features three bedrooms, one bathroom and a one car attached garage. It has easy access to both 410 and I-35. WE MAKE IT EASY TO OWN. This is a great opportunity! Don't wait, call us today to get more information on the owner's easy terms and smooth process that may be able to put the deed in your name and make this your dream investment.
-
2025-06-24status Pending 534-char remark
Show marketing remark (534 chars)
INVESTORS! This might be the ideal fixer upper that you have been looking for. It has some fire damage and is being sold AS IS but it is in a good location and has lots of potential. This home features three bedrooms, one bathroom and a one car attached garage. It has easy access to both 410 and I-35. WE MAKE IT EASY TO OWN. This is a great opportunity! Don't wait, call us today to get more information on the owner's easy terms and smooth process that may be able to put the deed in your name and make this your dream investment.
-
2025-06-07status Pending 534-char remark
Show marketing remark (534 chars)
INVESTORS! This might be the ideal fixer upper that you have been looking for. It has some fire damage and is being sold AS IS but it is in a good location and has lots of potential. This home features three bedrooms, one bathroom and a one car attached garage. It has easy access to both 410 and I-35. WE MAKE IT EASY TO OWN. This is a great opportunity! Don't wait, call us today to get more information on the owner's easy terms and smooth process that may be able to put the deed in your name and make this your dream investment.
-
2025-01-29$117,999 Active 534-char remark
Show marketing remark (534 chars)
INVESTORS! This might be the ideal fixer upper that you have been looking for. It has some fire damage and is being sold AS IS but it is in a good location and has lots of potential. This home features three bedrooms, one bathroom and a one car attached garage. It has easy access to both 410 and I-35. WE MAKE IT EASY TO OWN. This is a great opportunity! Don't wait, call us today to get more information on the owner's easy terms and smooth process that may be able to put the deed in your name and make this your dream investment.
-
2024-09-20soldstatus
-
2021-09-03soldstatus
-
2019-12-04soldstatus Sold 408-char remark
Show marketing remark (408 chars)
Single family home that contains 824 sq ft and was built in 1978. It contains 3 bedrooms and 2 bathrooms. As is! Close to Pearsall Park and easy access to Interstate 35 Access Rd. Casa familiar que contiene 824 pies cuadrados y fue construido en 1978. Consta de 3 dormitorios y 2 baños. ¡Como está! Cerca de Pearsall Park y de fácil acceso a la autopista interestatal 35 Access Rd.
-
2019-11-19status Pending 408-char remark
Show marketing remark (408 chars)
Single family home that contains 824 sq ft and was built in 1978. It contains 3 bedrooms and 2 bathrooms. As is! Close to Pearsall Park and easy access to Interstate 35 Access Rd. Casa familiar que contiene 824 pies cuadrados y fue construido en 1978. Consta de 3 dormitorios y 2 baños. ¡Como está! Cerca de Pearsall Park y de fácil acceso a la autopista interestatal 35 Access Rd.
-
2019-09-12$79,900 Active 408-char remark
Show marketing remark (408 chars)
Single family home that contains 824 sq ft and was built in 1978. It contains 3 bedrooms and 2 bathrooms. As is! Close to Pearsall Park and easy access to Interstate 35 Access Rd. Casa familiar que contiene 824 pies cuadrados y fue construido en 1978. Consta de 3 dormitorios y 2 baños. ¡Como está! Cerca de Pearsall Park y de fácil acceso a la autopista interestatal 35 Access Rd.
-
2019-09-11historical
-
2019-05-14$79,900 Active
-
1998-06-17soldstatus
-
1998-06-17soldstatus
-
1996-09-16soldstatus $32,362
ⓘ Source: listings_history table (triggers on properties + properties_extension) + one-shot
backfill from property_details.listing_events for pre-trigger history.
Tax reassessment forecast TX · Resets to sale price
- Current annual tax
- $1,467 · $122/mo
- Projected year-2 tax
- $2,159 · $180/mo
- Expected delta
- +$692/yr (+$58/mo · 47.2%)
ⓘ Screening estimate from a state-policy table — verify with the county assessor before closing.
Climate risk First Street
- Flood 1/10 Low FEMA zone X (unshaded) · 0% chance over 30 yrs
- Wildfire 3/10 Moderate
- Heat 8/10 Severe 7 d/yr ≥109°F today · 22 d/yr by 30 yrs out
- Wind 8/10 Severe 80% chance of damaging wind over 30 yrs
- Air quality 2/10 Low 0 unhealthy d/yr today · 1 by 30 yrs out
Nearby sold comps map
Loading sold comps map…
Walkable amenities ~0.75 mi
Loading nearby amenities…
Taxation est. · year 1
- Rental income
- $15,481
- − Mortgage interest
- −$6,610
- − Property taxes
- −$1,467
- − Insurance
- −$590
- − Repairs & maintenance
- −$1,239
- − Management
- −$1,239
- − Depreciation
- −$3,433
- Taxable income
- $905
- Est. tax owed @ 24.0%
- −$217
- After-tax cash flow
- $2,530/yr
For passive investors: Depreciation is non-cash, so a rental often shows a tax loss while cash-flowing — sheltering income. Rental losses are passive: they offset passive income freely, and up to $25,000/yr can offset ordinary (W-2) income if you actively participate and your MAGI is under $100k (phasing out to $0 by $150k); unused losses carry forward. On sale, claimed depreciation is recaptured at up to 25%, and gains may owe capital-gains tax (a 1031 exchange can defer both). Figures are a year-1 estimate at your 24.0% rate — not tax advice; consult a CPA.
Schools (NCES district)
- District
- Southwest ISD
- NCES district ID
- 4840950
- Math proficiency
- 21% ▼ -21.00%
- Reading proficiency
- 31% ▼ -5.00%
- Median HH income
- $43,362
- Composite
- 22.22/100
- National rank
- #8153
- State rank
- #701 of 826 in TX
Livability — San Antonio
- Score
- 80/100
- State rank
- #31
- US rank
- #1616
Category grades
Schools grade is shown separately in the Schools card above.
Census & demographics
- Census place
- San Antonio, TX
- County
- Bexar County · 1,990,555 people
- City population
- 1,806,925
- Metro
- San Antonio-New Braunfels, TX
- Population (ZIP)
- 36,168
- Household income
- $50,644
- Rent vs Own
- Severe rent burden
- 1778.0
Population outlook (Bexar County) Hauer SSP2
- Today (2025)
- 2,336,851 people
- By 2030
- 2,560,728 · +9.6%
- By 2040
- 3,020,569 · +29.3%
- By 2050
- 3,493,522 · +49.5%
- By 2075
- 4,668,459 · +99.8%
- By 2100
- 5,533,242 · +136.8%
Race, ethnicity, and origin ACS 2023
- Neighborhood character
- Predominantly Hispanic (86%)
- Race & ethnicity
- Hispanic / Latino 86% Two or more races 25% White 8% Black 3% Native American 2%
- Hispanic origin (detail)
- Mexican 67%
- Common ancestry
- Romanian 1% Italian 1%
- Foreign-born
- 20% · Canada
- Languages at home
- 43% English-only · Spanish 55%
Political lean MEDSL · Bexar
- 2024 margin
- Lean D (+9.8) · D 54.3% · R 44.6% · Other 1.1%
- 2008→2024 swing
- +4.2pp toward D · 2008: 5.6pp · 2024: 9.8pp
- All cycles
- 2024: D+9.8 2020: D+18.2 2016: D+13.5 2012: D+4.6 2008: D+5.6
Not yet ingested
- Civics
- —
Market trends
- HPI YoY
- ▼ -55.63%
- Current HPI
- 259.9788
- Rent YoY
- ▼ -1.32%
- Metro
- San Antonio-New Braunfels, TX
- State GDP YoY
- ▲ 3.95%
- F500 in state
- 110
Industry mix (Fortune 500 HQ in TX)
| Industry | F500 HQs | Revenue |
|---|---|---|
| Energy | 16 | $1,198B |
|
||
| Technology | 5 | $198B |
|
||
| Engineering / Construction | 4 | $72B |
|
||
| Energy Services | 3 | $60B |
|
||
| Utilities | 3 | $41B |
|
||
| Healthcare | 2 | $330B |
|
||
Price history
+264.6% since first listed14 events — show timeline
- 2025-07-03 Relisted — HARMLS
- 2025-06-24 Pending — HARMLS
- 2025-06-07 Pending — HARMLS
- 2025-01-29 Listed $117,999 HARMLS
- 2024-09-20 Sold (Public Records) — Public Records
- 2021-09-03 Sold (Public Records) — Public Records
- 2019-12-04 Sold (MLS) — HARMLS
- 2019-11-19 Pending — HARMLS
- 2019-09-12 Listed $79,900 HARMLS
- 2019-09-11 Listing Removed — HARMLS
- 2019-05-14 Listed $79,900 HARMLS
- 1998-06-17 Sold (Public Records) — Public Records
- 1998-06-17 Sold (Public Records) — Public Records
- 1996-09-16 Sold (Public Records) $32,362 Public Records
Property tax history
+3.0%/yrLatest (2025): $1,467 · -19.6% YoY. Source: county tax records.
Cash-flow waterfall
monthlySold comps — $/sqft
last 12 mo · ≤1 miLoading sold comps…