 Multi-family
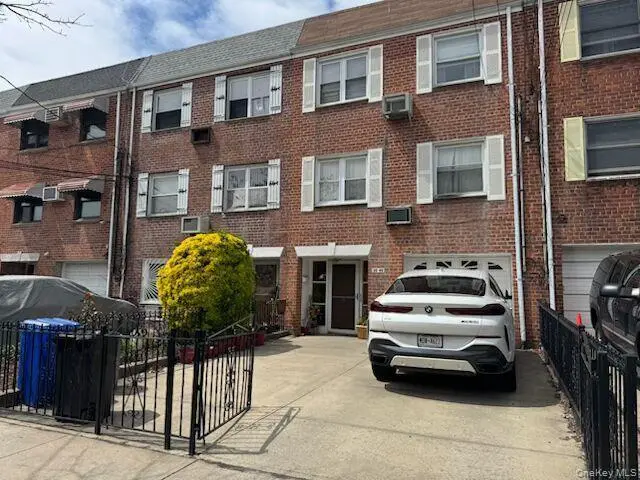
30-40 71st St · New York, NY
Flood risk 7/10 · Major
- FEMA flood zone
- X (unshaded)
- Chance of flooding over 30 yrs
- 0.77%
- Est. flood insurance / yr
- $507 – $1,088
Fire risk 1/10 · Minimal
- Est. fire insurance / yr
- $691 – $1,283
Heat risk 6/10 · Moderate
- Hot days now (above 99°F)
- 7 days/yr
- Hot days in 30 yrs
- 15 days/yr
Wind risk 6/10 · Moderate
- Chance of severe wind over 30 yrs
- 27.0%
Air-quality risk 4/10 · Minor
- Unhealthy air days now
- 5 days/yr
- Unhealthy air days in 30 yrs
- 6 days/yr
Risk factors via First Street. Map © Google.
Why this score? — see what drove the C grade
The composite is a weighted blend of 9 inputs, each scored 0–100. Each bar is that input's sub-score; the figure is the points it added to the 100-point composite (weight × sub-score).
- Cash flow +16.9/30.0
- ARV discount +11.3/15.0
- Appreciation +8.4/10.0
- DSCR +5.3/10.0
- Schools +5.0/10.0
- 1% rule +3.9/10.0
- Livability +3.8/5.0
- Rent growth +2.5/5.0
- Condition / age +2.5/5.0
$1,349,999
🖨 Deal sheet 📄 Offer letter ✓ Due diligence
Multi-family units
County records classify this as Multi-Family (2-4 Unit). Listing-text estimate: 1 unit. estimate disagrees with records
Listing remarks
This solid brick investment property presents an excellent opportunity, featuring five bedrooms and two bathrooms. The second-floor apartment includes a door from the second bedroom that opens to a private terrace, providing a serene space to relax and enjoy the outdoors. The property is equipped with natural gas heating and a separate hot water tank, ensuring comfort and efficiency. Additionally, it offers a one-car garage and is conveniently located close to transportation, shopping, and houses of worship. This is a fantastic chance to own a valuable investment property that combines comfort and convenience.
Key facts
- Natural gas heating
- Private terrace
- Conveniently located
Tags
Property features AI
Exterior
- Parking: Private driveway; Garage (1-car); 3 total parking spaces
- Utilities: Public sewer; Electricity available; Natural gas available; Sewer connected; Water connected
- Home design: Duplex; 2,622 total building area
- Construction: Brick construction
- Exterior features: Brick exterior; Not waterfront
Interior
- Heating & cooling: Hot water heating (natural gas); No central cooling
- Interior features: Formal dining area; No basement
Neighborhood map
What this means for you Summary
Snapshot
- This is a multifamily listed at $1.35M.
Deal economics
- At list price, monthly cash flow is $820 ($10k/yr) — positive.
- The deal already cash-flows at list — no discount required.
- To meet the 1% rule (rent ≥ 1% of price), the offer needs to be $1.20M (10.8% below list).
- Recommended offer: $1.20M (10.8% below list) — sets the bar for 1% rule.
- Cap rate 7.1% vs local median 2.6% in New York — top-decile yield for the area; either an underpriced asset or a hidden risk that comps aren't pricing in. Stress-test before assuming the spread holds.
Location & tenants
- Location reads 75/100 on livability (#268 in NY, #4,188 nationally) — a middle-class / working-renter tenant base. Strengths: amenities A+, commute A+, health & safety A; Watch: crime F, cost of living F.
- Market conditions: 72 active listings in the ZIP; 3 comparable units currently listed for rent nearby; rentals at typical pace (median 22d on market — plan ~3-4 weeks tenant-placement turnaround); solid renter incomes; 5,302 units permitted in Queens County in 2024 (4,918 in 5+ unit buildings).
- At $12,040/mo this rent would consume 190% of the median local household income ($76k/yr) (locally 1451% of renters already pay >50% of income on rent) — very limited rent-growth headroom before tenants either downsize or default.
Forward outlook
- In year one you build about $102k of equity ($9k loan paydown + $93k appreciation (6.9% local appreciation)).
- Queens County population projected at +16% by 2050 — long-run rental-demand tailwind backs the buy-and-hold thesis.
- At projected returns (6.9% appreciation + 3.0% rent growth), your $378k cash investment doubles in ~4 years — after that, you're playing with house money.
- By year 2, paydown + projected appreciation supports a ~$163k cash-out refi (75% LTV) — recoverable capital for the next deal without selling this one.
Negotiation context
- Only 1 days on market — expect competitive offers; lowballing is unlikely to land.
- Current owner paid $285k; list at $1.35M implies a 374% gain — meaningful room to come down on a strong offer.
Risks & watch-outs
- Watch-outs: flood insurance adds $66/mo.
- Climate carrying-cost: major flood risk; major wind risk, 27% chance of damaging wind over 30y; extreme-heat days projected 7→15/yr by 2055 (HVAC capex compounding) — expect insurance premiums to compound above CPI over the hold.
Questions for the listing agent
- Built in 1960 — when were the roof, HVAC, electrical panel, plumbing, and water heater last replaced?
- What's the actual annual flood-insurance premium (NFIP or private), and is the property in a SFHA with mandatory coverage?
- Is there a deadline driving the sale (1031 exchange, divorce, estate, relocation)? That informs how much negotiation room exists.
- Schools are B-rated — typically a magnet for longer-tenancy family renters. What's the average tenant stay here, and is there a school-zone premium baked into asking?
- Crime grade is F in this area — have there been break-ins, vandalism, or insurance claims at this property in the last 3 years? What carrier currently insures it and at what premium?
- What's the average days-on-market for RENTAL listings here right now (not sales)? A rising rental-DOM trend means longer vacancies and softer asking-rent achievability than the comps imply.
- What's the recent tenant-quality profile in this submarket — average credit score on applications, eviction rate, late-payment / NSF rate, and stable-employment percentage? A property-management company in the area should have these aggregated.
- How much new apartment / multifamily construction is in the pipeline within 1–3 miles? Heavy new supply (>2% of stock underway) typically softens rents 12–24 months out; light construction supports rent growth.
Investment metrics
- 1% rule
- 0.89% ✗
- Cap rate
- 7.08%
- Cash-on-cash
- 2.82%
- DSCR
- 1.13
- GRM
- 9.3
CMA / ARV
- ARV (on-the-fly)
- $1,476,186
- Comps found
- 11
Show comp detail 11 sales within ~0.75 mi
| Address | Dist | Beds/Ba | Sqft | Sold | Price | $/sf | Match |
|---|---|---|---|---|---|---|---|
| 3243 71st St | 0.24mi | 7/3.0 | 2,622 (0%) | 8mo | $1,500,000 | $572 | 82 |
| 3241 71st St | 0.24mi | 7/3.0 | 2,560 (-2%) | 6mo | $1,440,000 | $563 | 80 |
| 30-43 69th St | 0.08mi | 7/3.0 | 2,594 (-1%) | 21mo | $1,340,000 | $517 | 77 |
| 32-42 69th St | 0.26mi | 7/3.0 | 2,650 (+1%) | 11mo | $1,500,000 | $566 | 77 |
| 73-09 31st Ave | 0.14mi | 6/2.0 | 2,422 (-8%) | 21mo | $1,325,000 | $547 | 64 |
| 76-14 31 Ave | 0.30mi | 5/3.0 | 2,902 (+11%) | 12mo | $1,550,000 | $534 | 58 |
| 7720 31st Ave | 0.36mi | 6/3.0 | 2,970 (+13%) | 10mo | $1,350,000 | $455 | 53 |
| 31-29 68th St | 0.17mi | 5/3.0 | 2,280 (-13%) | 22mo | $1,250,000 | $548 | 52 |
| 3318 83rd St | 0.69mi | 6/3.0 | 2,340 (-11%) | 5mo | $1,645,000 | $703 | 46 |
| 2134 74th St | 0.71mi | 4/3.0 | 2,242 (-14%) | 2mo | $1,310,000 | $584 | 41 |
| 46-10 28th Ave | 0.69mi | 6/3.0 | 2,310 (-12%) | 10mo | $1,450,000 | $628 | 40 |
Match score weights: distance 35% · size 25% · config 20% · recency 20%. Top-matched comps best support the ARV.
Projected returns pro-forma
6.87% appreciation · 3.0% rent growth · sell at horizon
- IRR
- 19.5%
- Equity multiple
- 2.36×
- Total profit
- $512,428
- Equity at exit
- $923,783
- IRR
- 18.5%
- Equity multiple
- 4.84×
- Total profit
- $1,451,128
- Equity at exit
- $1,744,249
Cash invested: $378,000 (down + closing). Projections, not guarantees.
Landlord ↔ Tenant lean methodology
- Overall (CITY)
- 0 Strongly Tenant-Friendly
- State New York
- 15 Strongly Tenant-Friendly · D+10
- County
- — inherits STATE
- City New York
- 0 Strongly Tenant-Friendly · D+34
ZIP-level market 11370
- Home prices YoY
- 1.7%
- Active inventory
- 72
- Price-to-rent
- 28.0×
Monthly cashflow live
- Estimated rent
- $12,040 medium interval (Pro) →
- Mortgage (P&I)
- −$7,080
- Tax from tax record
- −$983 /mo · $11,792/yr
- Insurance
- −$562
- Flood insurance flood zone
- −$66 /mo · $798/yr
- HOA
- −$0
- Vacancy / Maint / Mgmt
- −$2,528
- Net cashflow
- $820
Break-even live
3-unit breakdown (identical units grouped — click to expand)
| Units | Beds | Baths | Est. rent |
|---|---|---|---|
| 3× units | 5 | 2 | $12,039 |
| #1 | 5 | 2 | $4,013 |
| #2 | 5 | 2 | $4,013 |
| #3 | 5 | 2 | $4,013 |
| Total (3 units) | $12,040 | ||
UW: 25.0% down · 7.5% · 30yr · 1.5% tax · 5.0% vac · 8.0% maint · 8.0% mgmt
Financing live
Cash to close
- Down payment
- $337,500
- Closing costs
- $40,500
- Reserves months
- —
- Total cash needed
- —
Loan-product check · same deal, 3 products live
Conventional
25% down · 7.5% · 30yr
- Down + closing
- —
- Monthly P&I
- —
- Monthly cashflow
- —
- DSCR
- —
- Eligible?
- —
Personal DTI + credit; lowest rate.
DSCR
20% down · 8.5% · 30yr
- Down + closing
- —
- Monthly P&I
- —
- Monthly cashflow
- —
- DSCR
- —
- Eligible?
- —
No personal income docs; deal must DSCR.
Hard money
10% down · 12.0% · 12mo
- Down + closing
- —
- Monthly P&I
- —
- Monthly cashflow
- —
- DSCR
- —
- Eligible?
- —
Short-term bridge; refi at stabilization.
Rent comps 3 comps
| Address | Beds | Baths | Sqft | Rent | $/sqft | DOM | Units | Dist |
|---|---|---|---|---|---|---|---|---|
| 33-30 89th St Unit 3 Flushing, NY | 3.0 | 1.0 | 3713 | $3,400 | $0.92 | 21d | 1 | 0.98mi |
| 2812 37th St Astoria, NY | 3.0 | 1.5 | 2200 | $4,700 | $2.14 | 18d | 1 | 1.10mi |
| 31-33 97th St Unit 1st Floor Flushing, NY | 1.0 | 1.0 | 2500 | $2,650 | $1.06 | 24d | 1 | 1.33mi |
Listing history 2 events
-
2026-06-02remarks 617-char remark
-
2026-06-02$1,349,999 Pending 1 DOM
ⓘ Source: listings_history table (triggers on properties + properties_extension) + one-shot
backfill from property_details.listing_events for pre-trigger history.
Tax reassessment forecast NY · Partial reset (capped growth)
- Current annual tax
- $11,792 · $983/mo
- Projected year-2 tax
- $17,304 · $1,442/mo
- Expected delta
- +$5,511/yr (+$459/mo · 46.7%)
ⓘ Screening estimate from a state-policy table — verify with the county assessor before closing.
Climate risk First Street
- Flood 7/10 Severe FEMA zone X (unshaded) · 77% chance over 30 yrs
- Wildfire 1/10 Low
- Heat 6/10 Major 7 d/yr ≥99°F today · 15 d/yr by 30 yrs out
- Wind 6/10 Major 27% chance of damaging wind over 30 yrs
- Air quality 4/10 Moderate 5 unhealthy d/yr today · 6 by 30 yrs out
Nearby sold comps map
Loading sold comps map…
Walkable amenities ~0.75 mi
Loading nearby amenities…
Taxation est. · year 1
- Rental income
- $144,480
- − Mortgage interest
- −$75,621
- − Property taxes
- −$11,792
- − Insurance
- −$7,547
- − Repairs & maintenance
- −$11,558
- − Management
- −$11,558
- − Depreciation
- −$39,273
- Taxable loss
- −$12,870
- Est. tax savings @ 24.0%
- +$3,089
- After-tax cash flow
- $12,934/yr
For passive investors: Depreciation is non-cash, so a rental often shows a tax loss while cash-flowing — sheltering income. Rental losses are passive: they offset passive income freely, and up to $25,000/yr can offset ordinary (W-2) income if you actively participate and your MAGI is under $100k (phasing out to $0 by $150k); unused losses carry forward. On sale, claimed depreciation is recaptured at up to 25%, and gains may owe capital-gains tax (a 1031 exchange can defer both). Figures are a year-1 estimate at your 24.0% rate — not tax advice; consult a CPA.
Schools (NCES district)
No district data.
Livability — New York
- Score
- 75/100
- State rank
- #268
- US rank
- #4188
Category grades
Schools grade is shown separately in the Schools card above.
Census & demographics
- Census place
- New York, NY
- County
- Queens County · 1,914,869 people
- City population
- 7,731,280
- Metro
- New York-Newark-Jersey City, NY-NJ-PA
- Population (ZIP)
- 30,267
- Household income
- $76,009
- Rent vs Own
- Severe rent burden
- 1451.0
Population outlook (Queens County) Hauer SSP2
- Today (2025)
- 2,546,320 people
- By 2030
- 2,643,059 · +3.8%
- By 2040
- 2,815,563 · +10.6%
- By 2050
- 2,944,423 · +15.6%
- By 2075
- 3,123,338 · +22.7%
- By 2100
- 3,098,688 · +21.7%
Race, ethnicity, and origin ACS 2023
- Neighborhood character
- Highly diverse neighborhood (Simpson 0.71)
- Race & ethnicity
- Hispanic / Latino 39% White 27% Asian 25% Two or more races 13% Black 7% Native American 1%
- Hispanic origin (detail)
- Mexican 7% Puerto Rican 4% Dominican 2%
- Common ancestry
- Scotch-Irish 1% Slovak 1% Romanian 1%
- Foreign-born
- 47% · Canada, Jamaica, China
- Languages at home
- 35% English-only · Spanish 33% Other Indo-European 17% Chinese 7%
Political lean MEDSL · Queens
- 2024 margin
- Strong D (+24.6) · D 62.3% · R 37.7%
- 2008→2024 swing
- -26.2pp toward R · 2008: 50.8pp · 2024: 24.6pp
- All cycles
- 2024: D+24.6 2020: D+45.2 2016: D+53.4 2012: D+58.5 2008: D+50.8
Not yet ingested
- Civics
- —
Market trends
- HPI YoY
- ▲ 6.87%
- Current HPI
- 411.1525
- Rent YoY
- —
- Metro
- New York-Newark-Jersey City, NY-NJ-PA
- State GDP YoY
- ▲ 2.60%
- F500 in state
- 92
Industry mix (Fortune 500 HQ in NY)
| Industry | F500 HQs | Revenue |
|---|---|---|
| Financial Services | 10 | $950B |
|
||
| Consumer Goods | 9 | $162B |
|
||
| Insurance | 4 | $225B |
|
||
| Telecommunications | 2 | $144B |
|
||
| Pharmaceuticals | 2 | $112B |
|
||
| Media / Entertainment | 2 | $69B |
|
||
Price history
+373.7% since first listed3 events — show timeline
- 2026-06-01 Pending — OneKey® MLS as Distributed by MLS Grid
- 2026-05-11 Listed $1,349,999 OneKey® MLS as Distributed by MLS Grid
- 1996-08-19 Sold (Public Records) $285,000 Public Records
Property tax history
+6.1%/yrLatest (2025): $11,792 · +3.4% YoY. Source: county tax records.
Cash-flow waterfall
monthlySold comps — $/sqft
last 12 mo · ≤1 miLoading sold comps…